. 2024 Jun 25;15(1):5380.
doi: 10.1038/s41467-024-49737-5.

The tyrosine kinase KDR is essential for the survival of HTLV-1-infected T cells by stabilizing the Tax oncoprotein

Affiliations

The tyrosine kinase KDR is essential for the survival of HTLV-1-infected T cells by stabilizing the Tax oncoprotein

Suchitra Mohanty et al. Nat Commun. .

Abstract

Human T-cell leukemia virus type 1 (HTLV-1) infection is linked to the development of adult T-cell leukemia/lymphoma (ATLL) and the neuroinflammatory disease, HTLV-1-associated myelopathy/tropical spastic paraparesis (HAM/TSP). The HTLV-1 Tax oncoprotein regulates viral gene expression and persistently activates NF-κB to maintain the viability of HTLV-1-infected T cells. Here, we utilize a kinome-wide shRNA screen to identify the tyrosine kinase KDR as an essential survival factor of HTLV-1-transformed cells. Inhibition of KDR specifically induces apoptosis of Tax expressing HTLV-1-transformed cell lines and CD4 + T cells from HAM/TSP patients. Furthermore, inhibition of KDR triggers the autophagic degradation of Tax resulting in impaired NF-κB activation and diminished viral transmission in co-culture assays. Tax induces the expression of KDR, forms a complex with KDR, and is phosphorylated by KDR. These findings suggest that Tax stability is dependent on KDR activity which could be exploited as a strategy to target Tax in HTLV-1-associated diseases.


Conflict of interest statement

The authors declare no competing interests.

Figures
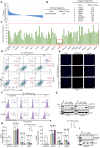
Fig. 1
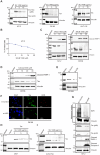
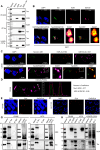
Fig. 1. KDR is essential for the survival of HTLV-1-transformed cells.
A Waterfall plot representing Z scores for each shRNA in the kinome-wide shRNA screen for identification of survival factors in MT-2 cells. B Genes from the shRNA screen are listed with a mean Z-score of either <−1.5 (positive regulator) or >1.5 (negative regulator). C MT-2 cell viability in the 96-well plate from the kinome-wide shRNA screen containing the five KDR shRNAs (boxed area). D HTLV-1 transformed cells were treated with SU 1498 in a concentration-dependent manner for 24 h and stained with Annexin V-FITC and propidium iodide for acquisition by flow cytometry. Representative pseudocolor plots indicate the gating strategy for quantifying the percentage of each single-stained and dual-stained cells and highlighting the percentage of pre-apoptotic and post-apoptotic cell death in response to SU 1498 treatment. E Immunofluorescence was performed using HTLV-1 transformed cells treated with SU 1498 for 24 h and stained with MitoTracker Deep Red. The experiment is representative of two independent experiments with similar results. F FLICA caspase assays were performed using MT-2 and C8166 cells treated with SU 1498 at the indicated concentrations for 24 h. The histograms represent the percentage of active caspase 3/7 in treated cells. G Immunoblotting was performed with the indicated antibodies using lysates from MT-2 and C8166 cells treated with the indicated concentrations of SU 1498 for 24 h. The experiment is representative of three independent experiments with similar results. H Graphical representation of cell cycle analysis of HTLV-1 transformed cells treated with the indicated concentrations of SU 1498 for 24 h and the proportions of cells at different phases of the cell cycle (sub G1, G1/M, S, G2/M). The results are expressed as the mean ± SD of three independent experiments. ****P < 0.0001; ***P < 0.001; **P < 0.01; *P < 0.05. Two-way ANOVA with Dunnett’s multiple comparisons test. P values from left to right: P = 0.7880, P = 0.4538, P = 0.1483, P < 0.0001, P = 0.0010, P  < 0.0001, P = 0.2411, P < 0.0001, P = 0.9872, P = 0.8933, P = 0.0005, P < 0.0001, P = 0.9264, P < 0.0001, P = 0.0002, P < 0.0001, ns not significant. I Immunoblotting was performed with the indicated antibodies using lysates from Jurkat cells treated with the indicated concentrations of SU 1498 for 24 h. The experiment was independently repeated three times with similar results. Representative data from one experiment is shown. Source data are provided as a Source data file.
Fig. 2
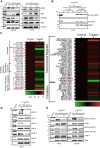
Fig. 2. KDR inhibition induces Tax degradation.
A Immunoblotting was performed with the indicated antibodies using lysates from MT-2, C8166, and HUT-102 cells treated with different concentrations of SU 1498 for 24 h. The experiment is representative of three independent experiments with similar results. B Cell viability assay was performed in MT-2 cells treated with different concentrations of SKLB 1002 for 24 h. C Immunoblotting was performed with the indicated antibodies using lysates from MT-2 and C8166 cells treated with SKLB 1002 for 24 h. D Immunoblotting was performed with the indicated antibodies using lysates from C8166 cells treated with Cabozantinib for 24 h. E Immunoblotting was performed with the indicated antibodies using lysates from C8166 cells expressing control or KDR siRNAs. F Immunofluorescence confocal microscopy was performed with the indicated antibodies using C8166 cells expressing control scrambled siRNA or KDR siRNA. G Immunoblotting was performed with the indicated antibodies using membrane fractions and whole-cell lysates from MT-2 cells expressing control shRNA or KDR shRNA. H Immunoblotting was performed with the indicated antibodies using lysates from 293T cells transfected with vector control or Tax, and then treated with SU 1498. I Immunoblotting was performed with the indicated antibodies using lysates from Jurkat Tax Tet-On cells treated with Dox for 24 h followed by SU 1498 for 24 h. The experiments in (CI) are representative of two independent experiments with similar results. Source data are provided as a Source data file.
Fig. 3
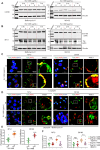
Fig. 3. KDR inhibition induces autophagic/lysosomal degradation of Tax.
Immunoblotting was performed with the indicated antibodies using lysates from (A) C8166 and (B) MT-2 cells treated with 0 μg or 5 μg of SU 1498 at the indicated times. The experiments were independently repeated three times with similar results. Representative data from one experiment is shown. C Immunofluorescence confocal microscopy was performed using MT-2 and C8166 cells treated with SU 1498 and leupeptin (20 μM) for 24 h and labeled with Tax-Alexa Fluor 488 and LAMP2-Alexa Fluor 647 (pseudo red) antibodies and DAPI for nuclear staining. D Immunofluorescence confocal microscopy was performed using MT-2 and C8166 cells treated with SU 1498 and leupeptin (20 μM) and Bafilomycin A1 (20 nM) for 24 h and labeled with Tax-Alexa Fluor 488 and LAMP2-Alexa Fluor 647 antibodies and DAPI for nuclear staining. The experiments in (C, D) are representative of two independent experiments with similar results. E, F Graphical representation of Pearson’s coefficient analysis of the number of cells showing localization of Tax in lysosomes (LAMP2), where each dot represents a single cell. MT-2 and C8166 cells were treated with SU 1498 and E leupeptin or F leupeptin (20 μM) and Bafilomycin A1 (20 nM) for 24 h. The results in (E) are expressed as the mean ± SD. Unpaired Student’s t test with Welch’s correction. ****P < 0.0001. Two-tailed Student’s t test. P values from left to right: P < 0.0001, P < 0.0001 with n = 12 cells (MT-2) and n = 10 cells (C8166). The results in (F) are expressed as the mean ± SD. One-way ANOVA with Šídák’s multiple comparisons test. ****P < 0.0001 and ns = not significant. P values from left to right: P = 0.9991, P < 0.0001, P = 0.8735, P < 0.0001. n = 12 cells (MT-2) and n = 10 cells (C8166). Source data are provided as a Source data file.
Fig. 4
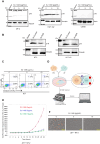
Fig. 4. KDR inhibition inhibits HTLV-1 replication by suppressing p19 Gag expression and preventing HTLV-1 transmission.
A Immunoblotting was performed with p19 and vinculin antibodies using lysates from MT-2, HUT-102, and C8166 cells treated with SU 1498 for 24 h. The experiment is representative of two independent experiments with similar results. B Immunoblotting was performed with p19 and vinculin antibodies using lysates from MT-2 and HUT-102 cells expressing control scrambled shRNA or KDR shRNA. The experiment is representative of two independent experiments with similar results. C Annexin assay of JET cells treated with SU 1498 for 24 h and the percentage of pre-apoptotic (Annexin V+ and PI-) and post-apoptotic (Annexin+ and PI+) cell death was highlighted in representative pseudocolor plots demonstrating the gating strategy. D Schematic illustration of the co-culture of MT-2 and JET (1:3) cells and subsequent treatment with SU 1498 for analysis by Incucyte S3 live-cell imaging of RFP expression in infected JET cells. The schematic was created with BioRender.com and released under a Creative Commons Attribution-NonCommercial-NoDerivs 4.0 International license. E Incucyte S3 live-cell imaging of RFP expression at 2-h intervals in co-cultured MT-2 and JET cells treated with SU 1498 for 24 h. At each time point, images were taken from 24 wells (8 wells/sample and 16 images/well) in the phase bright-field and red channel at ×10 magnification with an S3/SX1 G/R optical module. The error bars are presented as a standard error with n = 8 technical replicates. The experiment is representative of two independent experiments with similar results. F Representative images of Incucyte S3 live-cell analysis of co-cultured MT-2 and JET cells treated with SU 1498 for 24 h with ×10 magnification. Source data are provided as a Source data file.
Fig. 5
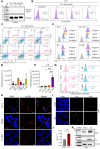
Fig. 5. Tax induces KDR expression.
A Immunoblotting was performed with cleaved PARP-1 and Vinculin antibodies using lysates from TL-OM1 cells treated with SU 1498 for 24 h. The experiment is representative of three independent experiments with similar results. B FLICA caspase assay was performed using MT-1 cells treated with SU 1498 for 24 h. The histograms indicate the percentage of active caspase 3/7 in treated cells. C Annexin assay of MT-1 and TL-OM1 cells treated with SU 1498 for 24 h and the percentage of pre-apoptotic (Annexin V+ and PI) and post-apoptotic (Annexin V+ and PI+) cell death was shown in representative pseudocolor plots demonstrating the gating strategy. D Tax+ (MT-2 and HUT-102) and Tax- (MT-1 and TL-OM1) cells were treated with SU 1498 for 24 h and stained with MDC for acquisition by flow cytometry. Histogram overlays show changes in MDC staining levels in treated cells, indicating autophagy induction. E qRT-PCR of KDR mRNA in C8166, MT-2, HUT-102, SLB-1, Jurkat, and HL-60 cells. The results are expressed as the mean ± SD from two independent experiments. F qRT-PCR of KDR mRNA in MT-1, ATL-2S, TL-OM1, and HUT-102 cells. The results are expressed as the mean ± SD from two independent experiments. **P < 0.01. One-way ANOVA with Dunnett’s multiple comparisons test with P values from left to right: P = 0.0032, P = 0.0035, P = 0.0045. G Flow cytometry-based analysis of KDR protein expression in Tax+ and Tax- ATLL cell lines. H Immunofluorescence confocal microscopy was performed using MT-2, C8166, and TL-OM1 cells labeled with pKDR-Alexa Fluor 488 and DAPI for nuclear staining. I Immunofluorescence confocal microscopy was performed using 293T cells transiently transfected with Tax and stained with Tax-Alexa Fluor 488, KDR-Alexa Fluor 594, and DAPI for nuclear staining. The experiments in (H, I) are representative of two independent experiments with similar results. J qRT-PCR of KDR mRNAs in 293T cells transiently transfected with Tax. The results are expressed as the mean ± SD from two independent experiments. *P < 0.05. Two-tailed Student’s t test. P = 0.0228. K Immunoblotting was performed using the indicated antibodies in 293T cells transiently transfected with Tax. The experiment is representative of two independent experiments with similar results. Source data are provided as a Source data file.
Fig. 6
Fig. 6. Tax interacts with and colocalizes with KDR at the Golgi.
A Co-IP analysis of Tax and KDR-GFP from lysates of transfected 293T cells. Immunoblotting was performed with lysates using the indicated antibodies. B Immunofluorescence confocal microscopy was performed using 293T cells stained with the indicated antibodies. C Immunofluorescence confocal microscopy was performed using C8166 cells with the indicated antibodies. D The fluorescence intensity profile is plotted along the white arrow represented in the graph showing overlap, and Pearson’s coefficient analysis was performed using NIS-Element software. E, F PLA was performed using C8166 (E) and HUT-102 (F) cells with Tax and KDR antibodies. The cells were labeled with DAPI for nuclear staining. G, H Co-IP assay was performed with either control IgG, anti-Tax (G) or anti-KDR (H) immunoprecipitates from lysates of C8166 and MT-2 cells as indicated. The experiments in (AH) are representative of two independent experiments with similar results. Source data are provided as a Source data file.
Fig. 7
Fig. 7. KDR inhibition impairs NF-κB and JAK/STAT signaling pathways.
A Immunoblotting was performed with the indicated antibodies using lysates from C8166 and MT-2 cells treated with SU 1498 for 24 h. The experiment is representative of two independent experiments with similar results. B Co-IP assay was performed with either control IgG or anti-NEMO using lysates from MT-2 cells treated with SU 1498 and leupeptin (20 μM) for 24 h. The experiment is representative of two independent experiments with similar results. C Heatmap representation of phosphoproteomics results in SU 1498-treated MT-2 cells showing alterations in tyrosine phosphorylation of proteins grouped according to their functions. The color gradient indicates the intensity of gene expression. D, E Immunoblotting was performed with the indicated antibodies specific for JAK-STAT signaling components using lysates from MT-2 and C8166 cells treated with SU 1498 and leupeptin (20 μM) for 24 h. The experiments were independently repeated two times with similar results. Representative data from one experiment is shown. Source data are provided as a Source data file.
Fig. 8
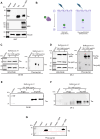
Fig. 8. KDR induces Tax phosphorylation.
A Immunoblotting was performed with the indicated antibodies using lysates from 293T cells transfected with Tax and/or KDR-GFP plasmids. The experiment is representative of two independent experiments with similar results. B Schematic depicting the principle of Phos-Tag gels for the analysis of phosphorylated proteins. The schematic was created with BioRender.com and released under a Creative Commons Attribution-NonCommercial-NoDerivs 4.0 International license. C, D Lysates from C8166 (C) and MT-2 cells (D) treated with SU 1498 and Bafilomycin A1 (20 nM) for 24 h were resolved by SDS-PAGE and Phos-Tag gels and subjected to immunoblotting. E, F Co-IP assay was performed with either control IgG or phosphoTyrosine (pTYR) immunoprecipitates from lysates of C8166 (E) or MT-2 cells (F) treated with SU 1498 and Bafilomycin A1 (20 nM) for 24 h. G In vitro kinase assay using immunoprecipitated Tax and recombinant KDR. The reaction was resolved on a Phos-Tag gel and subjected to immunoblotting. The experiments in (CG) were independently repeated two times with similar results. Representative data from one experiment is shown. Source data are provided as a Source data file.
Fig. 9
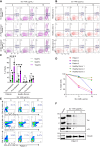
Fig. 9. KDR inhibition induces Tax degradation and cell death and decreases p19 Gag expression in HAM/TSP PBMCs.
A, B Annexin assay of HAM/TSP PBMCs (A) and healthy donor PBMCs (B) treated with SU 1498 for 24 h and the percentage of pre-apoptotic (Annexin V+ and PI) and post-apoptotic (Annexin V+ and PI+) cell death is indicated in representative pseudocolor plots demonstrating the gating strategy. C Graphical representation of the percentage of pre-apoptotic and post-apoptotic cells in HAM/TSP PBMCs and healthy donor PBMCs treated with SU 1498 for 24 h. ****P < 0.0001; *P < 0.05. Two-way ANOVA with Dunnett’s multiple comparisons test. P values from left to right: P = 0.0198, P  < 0.0001, P = 0.2322, P  < 0.0001, P = 0.9953, P = 0.9824, P = 0.8125, P = 0.2594, ns not significant. Data are represented as mean ± SD from three biological replicates (HAM/TSP patients and healthy donor PBMCs). D Cell viability assay was performed using HAM/TSP PBMCs, and healthy donor PBMCs treated with SU 1498 for 24 h. E Flow cytometry-based analysis of the percentage of CD3 + CD4 + CD25+ in HAM/TSP PBMCs treated with SU 1498 for 24 h. F Immunoblotting was performed with the indicated antibodies using lysates from HAM/TSP PBMCs (patient#3) treated with SU 1498 for 24 h. The experiment was repeated two times with technical replicates with similar results. Representative data from one experiment is shown. Source data are provided as a Source data file.
Fig. 10
Fig. 10. Model depicting the role of KDR in protecting Tax from autophagic degradation.
Tax induces the expression of KDR and interacts with KDR at the Golgi. KDR phosphorylates Tax and protects Tax from autophagic degradation. KDR inhibitors such as SU 1498 trigger the degradation of Tax which leads to the downregulation of prosurvival NF-κB and JAK/STAT pathways. KDR inhibition also leads to decreased viral gene expression, disruption of the Tax-NEMO complex and the targeted cell death of Tax-expressing HTLV-1-infected T cells. The schematic was created with BioRender.com and released under a Creative Commons Attribution-NonCommercial-NoDerivs 4.0 International license.

Similar articles

References

    1. Gessain A, Cassar O. Epidemiological aspects and world distribution of HTLV-1 infection. Front. Microbiol. 2012;3:388. doi: 10.3389/fmicb.2012.00388. - DOI - PMC - PubMed
    1. Einsiedel LJ, Pham H, Woodman RJ, Pepperill C, Taylor KA. The prevalence and clinical associations of HTLV-1 infection in a remote Indigenous community. Med. J. Aust. 2016;205:305–309. doi: 10.5694/mja16.00285. - DOI - PubMed
    1. Phillips AA, Harewood JCK. Adult T cell leukemia-lymphoma (ATL): state of the art. Curr. Hematol. Malignancy Rep. 2018;13:300–307. doi: 10.1007/s11899-018-0458-6. - DOI - PubMed
    1. Bangham CR, Araujo A, Yamano Y, Taylor GP. HTLV-1-associated myelopathy/tropical spastic paraparesis. Nat. Rev. Dis. Prim. 2015;1:15012. doi: 10.1038/nrdp.2015.12. - DOI - PubMed
    1. Shimoyama M. Diagnostic criteria and classification of clinical subtypes of adult T-cell leukaemia-lymphoma. A report from the Lymphoma Study Group (1984-87) Br. J. Haematol. 1991;79:428–437. doi: 10.1111/j.1365-2141.1991.tb08051.x. - DOI - PubMed

MeSH terms

Substances