

Mapping intracellular NAD content in entire human brain using phosphorus-31 MR spectroscopic imaging at 7 Tesla
- PMID: 38911598
- PMCID: PMC11190064
- DOI: 10.3389/fnins.2024.1389111
Mapping intracellular NAD content in entire human brain using phosphorus-31 MR spectroscopic imaging at 7 Tesla
Abstract
Introduction: Nicotinamide adenine dinucleotide (NAD) is a crucial molecule in cellular metabolism and signaling. Mapping intracellular NAD content of human brain has long been of interest. However, the sub-millimolar level of cerebral NAD concentration poses significant challenges for in vivo measurement and imaging.
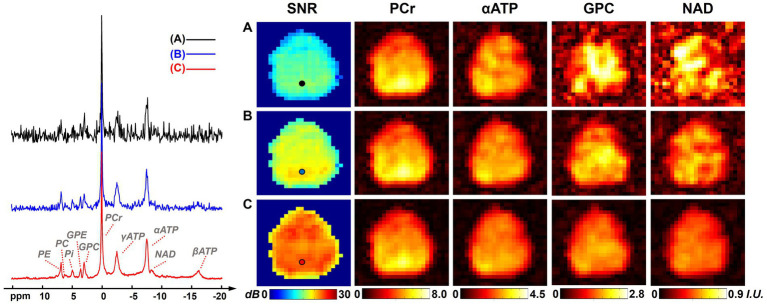
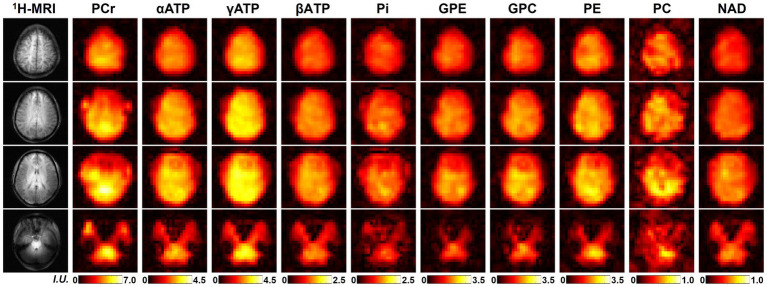
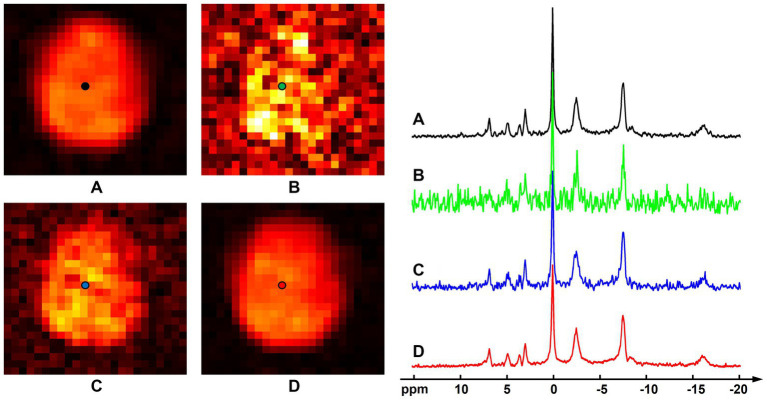
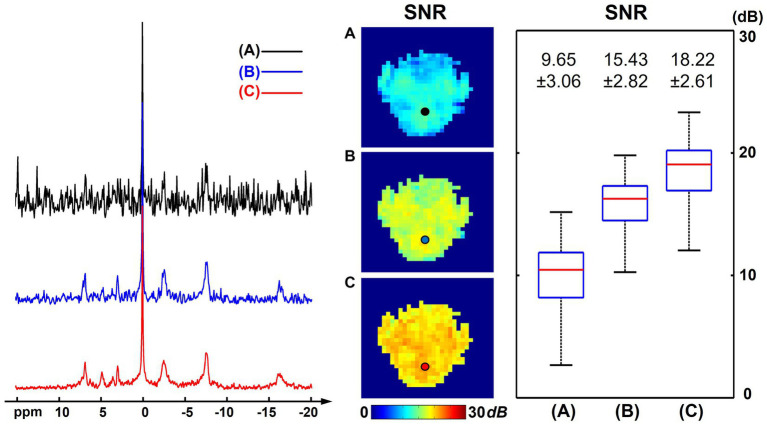
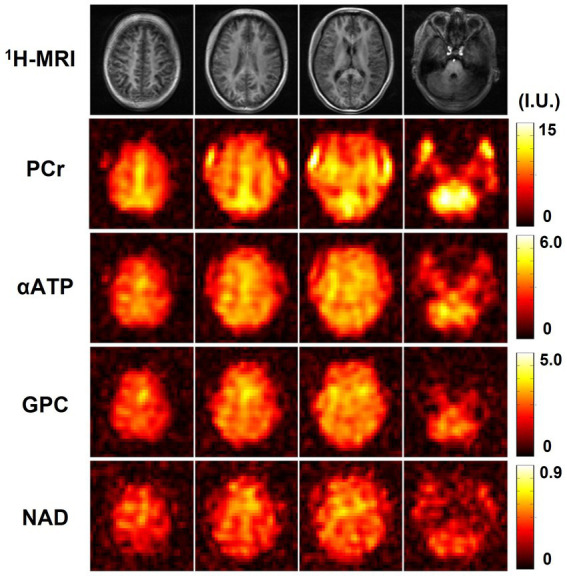
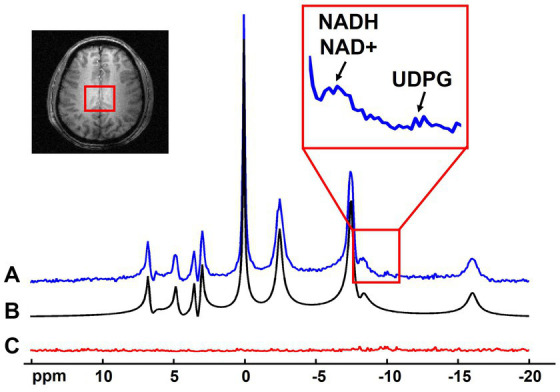
Methods: In this study, we demonstrated the feasibility of non-invasively mapping NAD contents in entire human brain by employing a phosphorus-31 magnetic resonance spectroscopic imaging (31P-MRSI)-based NAD assay at ultrahigh field (7 Tesla), in combination with a probabilistic subspace-based processing method.
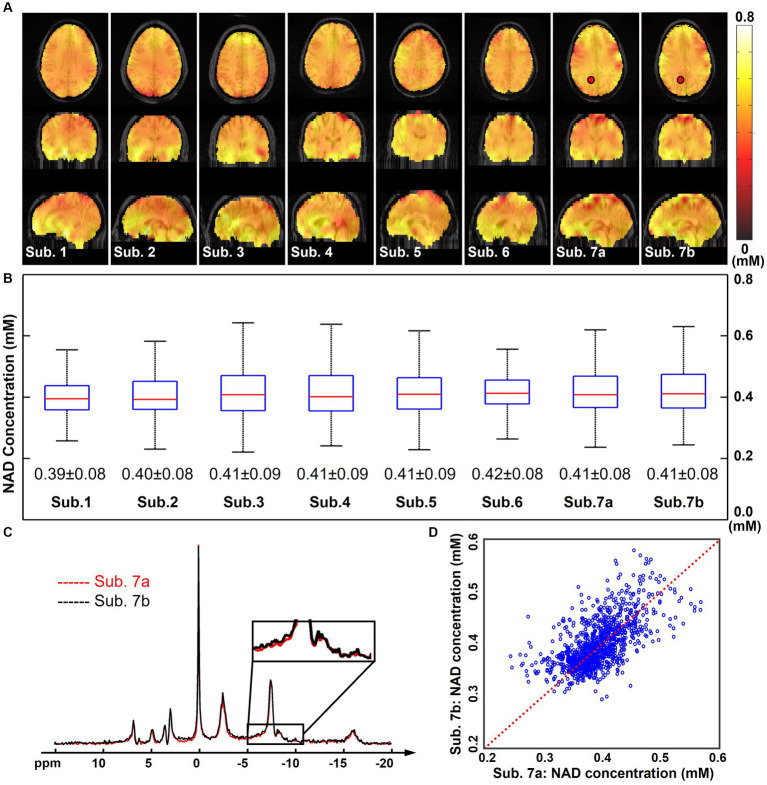
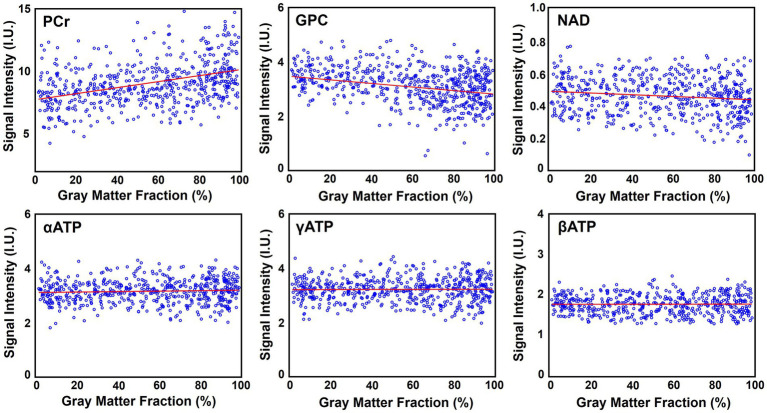
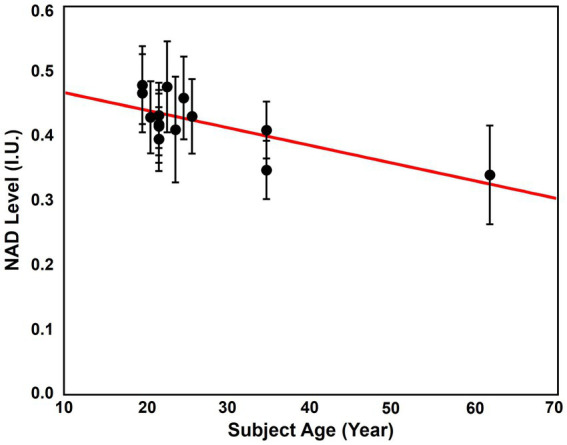
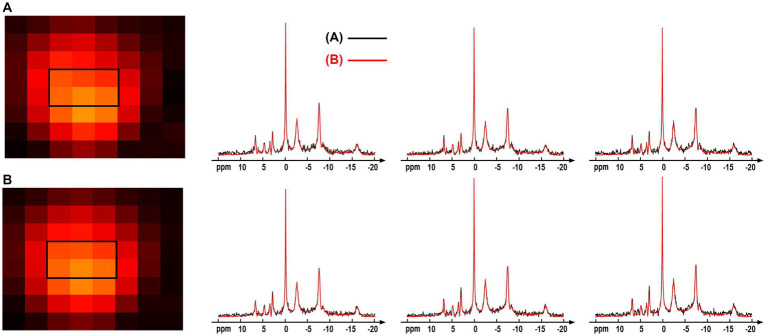
Results: The processing method achieved about a 10-fold reduction in noise over raw measurements, resulting in remarkably reduced estimation errors of NAD. Quantified NAD levels, observed at approximately 0.4 mM, exhibited good reproducibility within repeated scans on the same subject and good consistency across subjects in group data (2.3 cc nominal resolution). One set of higher-resolution data (1.0 cc nominal resolution) unveiled potential for assessing tissue metabolic heterogeneity, showing similar NAD distributions in white and gray matter. Preliminary analysis of age dependence suggested that the NAD level decreases with age.
Discussion: These results illustrate favorable outcomes of our first attempt to use ultrahigh field 31P-MRSI and advanced processing techniques to generate a whole-brain map of low-concentration intracellular NAD content in the human brain.
Keywords: brain metabolites; nicotinamide adenine dinucleotide; phosphorus-31 magnetic resonance spectroscopic imaging; subspace modeling; ultrahigh field.
Copyright © 2024 Guo, Yang, Wiesner, Li, Zhao, Liang, Chen and Zhu.
Conflict of interest statement
RG is currently an employee of Siemens Medical Solutions USA, Inc. The remaining authors declare that the research was conducted in the absence of any commercial or financial relationships that could be construed as a potential conflict of interest.
Figures
Similar articles
-
Assessment of Nicotinamide Adenine Dinucleotide in Human Tissues by In Vivo Phosphorus-31 Magnetic Resonance Spectroscopic Imaging at 1.5 Tesla.Adv Exp Med Biol. 2022;1395:323-328. doi: 10.1007/978-3-031-14190-4_52. Adv Exp Med Biol. 2022. PMID: 36527656 Free PMC article.
-
3D 31 P MR spectroscopic imaging of the human brain at 3 T with a 31 P receive array: An assessment of 1 H decoupling, T1 relaxation times, 1 H-31 P nuclear Overhauser effects and NAD.NMR Biomed. 2021 May;34(5):e4169. doi: 10.1002/nbm.4169. Epub 2019 Sep 13. NMR Biomed. 2021. PMID: 31518036 Free PMC article.
-
Mapping an Extended Metabolic Profile of Gliomas Using High-Resolution 31P MRSI at 7T.Front Neurol. 2021 Dec 23;12:735071. doi: 10.3389/fneur.2021.735071. eCollection 2021. Front Neurol. 2021. PMID: 35002914 Free PMC article.
-
Hyperpolarized sodium 1-[13C]pyruvate.2008 Jan 29 [updated 2008 Feb 28]. In: Molecular Imaging and Contrast Agent Database (MICAD) [Internet]. Bethesda (MD): National Center for Biotechnology Information (US); 2004–2013. 2008 Jan 29 [updated 2008 Feb 28]. In: Molecular Imaging and Contrast Agent Database (MICAD) [Internet]. Bethesda (MD): National Center for Biotechnology Information (US); 2004–2013. PMID: 20641814 Free Books & Documents. Review.
-
Translational Metabolomics of Head Injury: Exploring Dysfunctional Cerebral Metabolism with Ex Vivo NMR Spectroscopy-Based Metabolite Quantification.In: Kobeissy FH, editor. Brain Neurotrauma: Molecular, Neuropsychological, and Rehabilitation Aspects. Boca Raton (FL): CRC Press/Taylor & Francis; 2015. Chapter 25. In: Kobeissy FH, editor. Brain Neurotrauma: Molecular, Neuropsychological, and Rehabilitation Aspects. Boca Raton (FL): CRC Press/Taylor & Francis; 2015. Chapter 25. PMID: 26269925 Free Books & Documents. Review.
References
-
- Bagga P., Hariharan H., Wilson N. E., Beer J. C., Shinohara R. T., Elliott M. A., et al. . (2020). Single-voxel 1H MR spectroscopy of cerebral nicotinamide adenine dinucleotide (NAD+) in humans at 7T using a 32-channel volume coil. Magn. Reson. Med. 83, 806–814. doi: 10.1002/mrm.27971, PMID: - DOI - PMC - PubMed
-
- Barker P. B. (2014). “Ultra-high field MRSI (7T and beyond)” in Functional Brain Tumor Imaging, (ed.) Pillai J. J., (New York, NY: Springer; ), 195–209.
-
- Barkhuijsen H., de Beer R., van Ormondt D. (1987). Improved algorithm for noniterative time-domain model fitting to exponentially damped magnetic resonance signals. J. Magn. Reson. 73, 553–557. doi: 10.1016/0022-2364(87)90023-0 - DOI
-
- Boldea O., Magnus J. R. (2009). Maximum likelihood estimation of the multivariate normal mixture model. J. Am. Stat. Assoc. 104, 1539–1549. doi: 10.1198/jasa.2009.tm08273 - DOI
Grants and funding
LinkOut - more resources
Full Text Sources