. 2024 Dec;46(6):6229-6256.
doi: 10.1007/s11357-024-01223-y. Epub 2024 Jun 21.

Rotating magnetic field improved cognitive and memory impairments in a sporadic ad model of mice by regulating microglial polarization

Affiliations

Rotating magnetic field improved cognitive and memory impairments in a sporadic ad model of mice by regulating microglial polarization

Mengqing Li et al. Geroscience. 2024 Dec.

Abstract

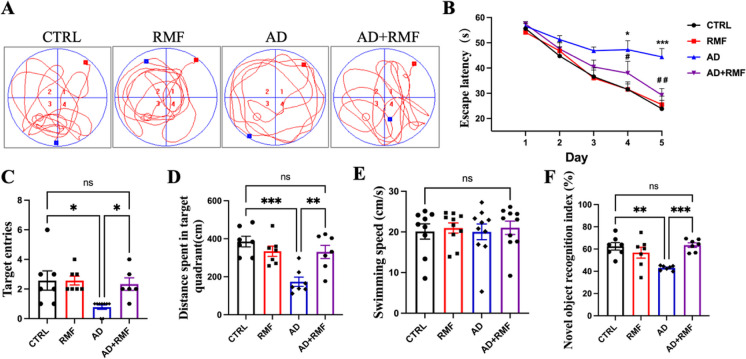
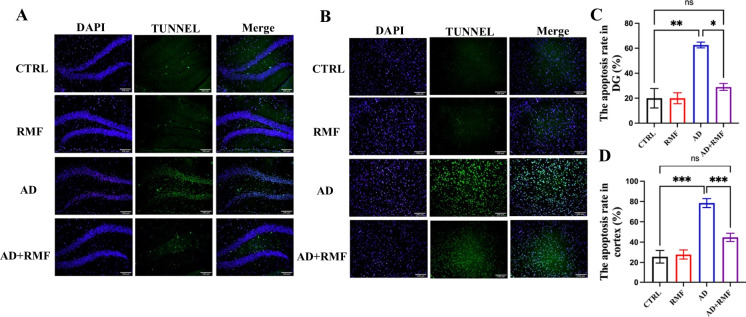
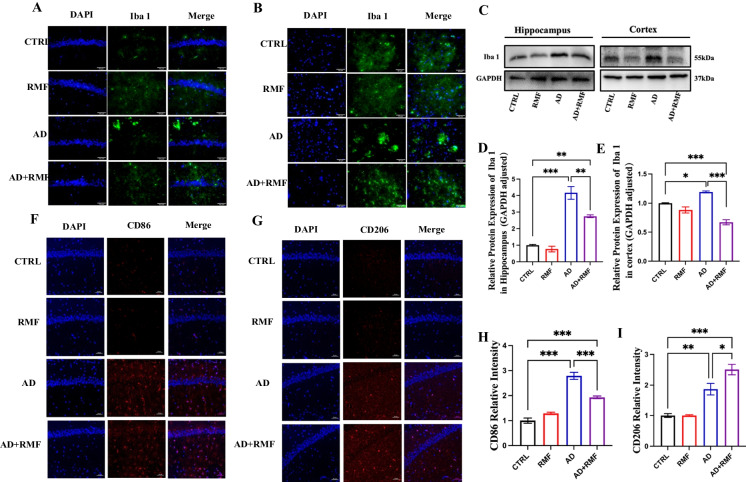
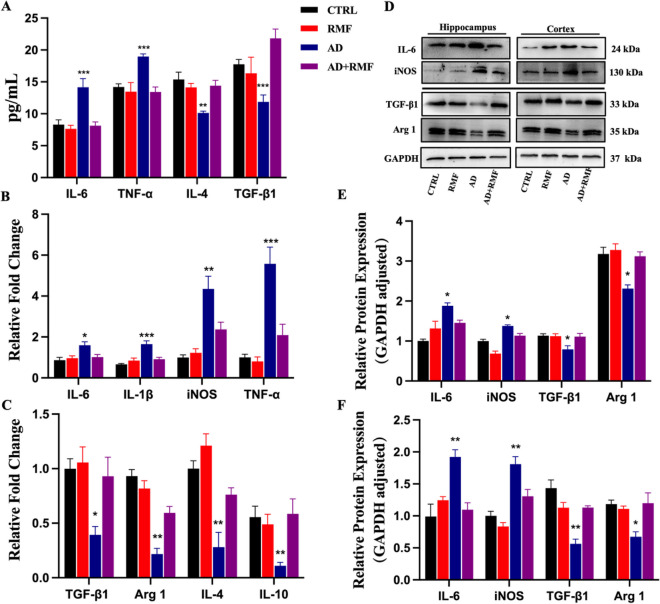
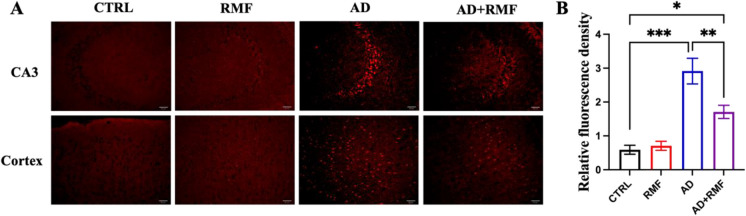
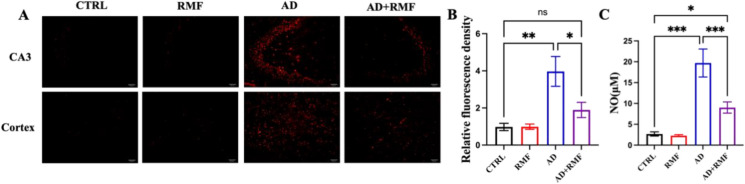
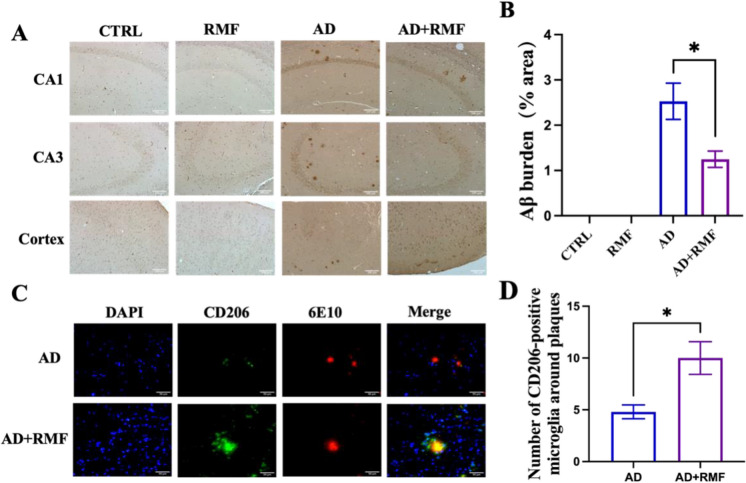
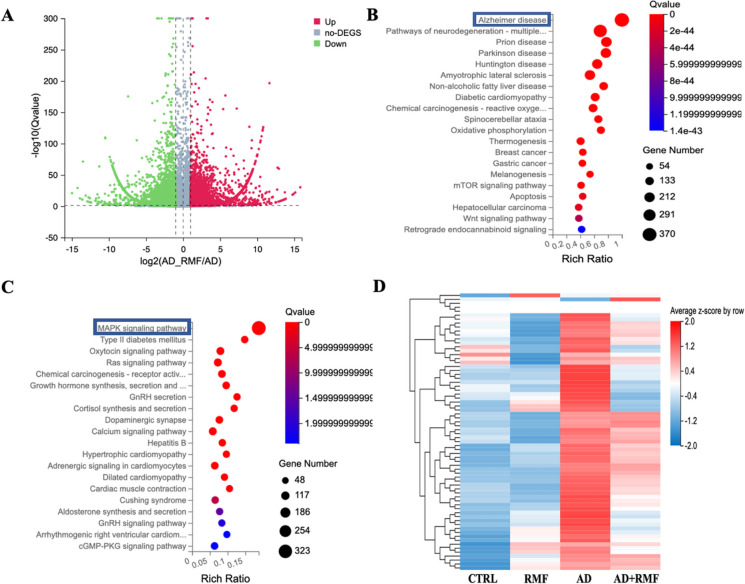
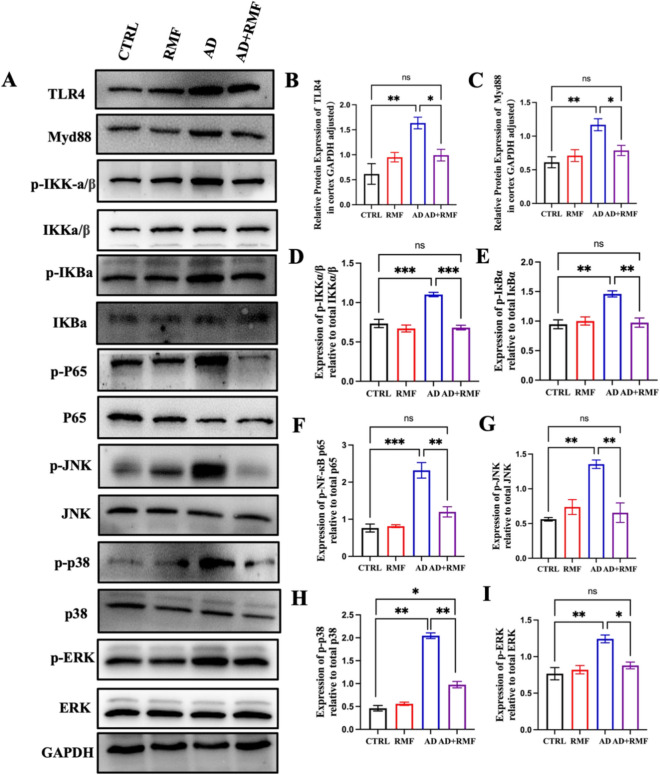
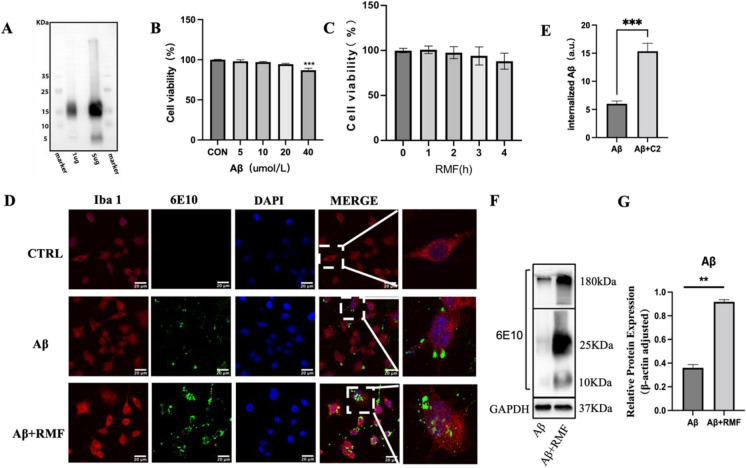
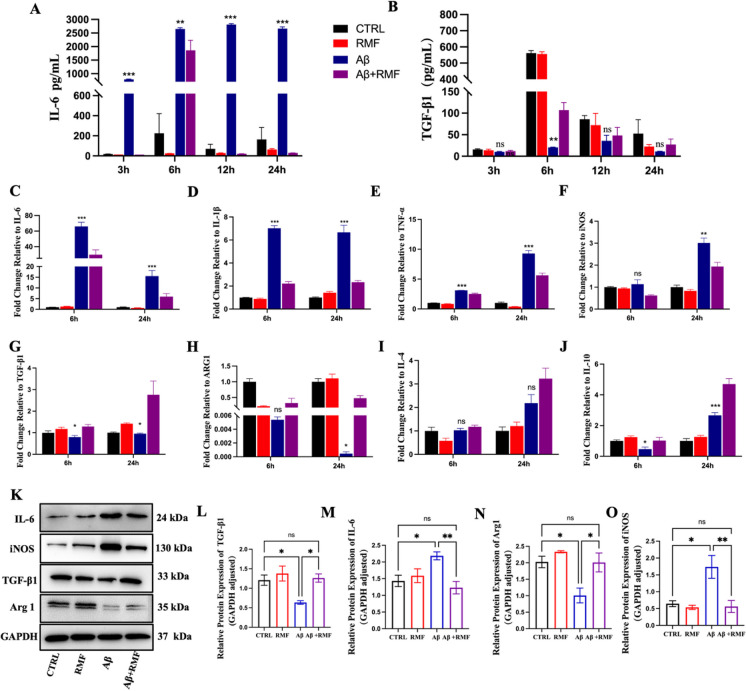
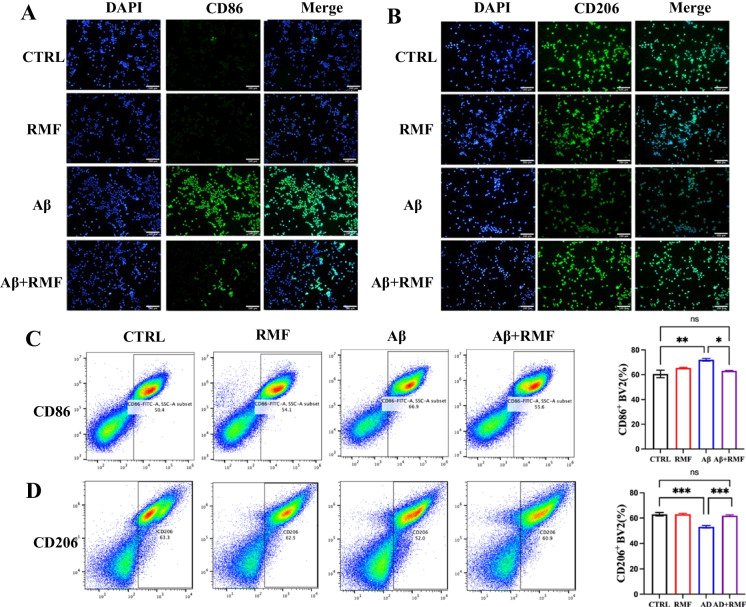
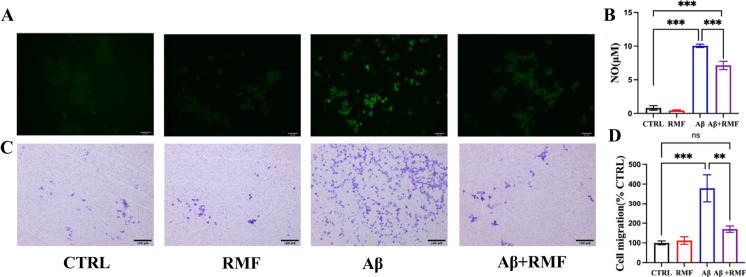
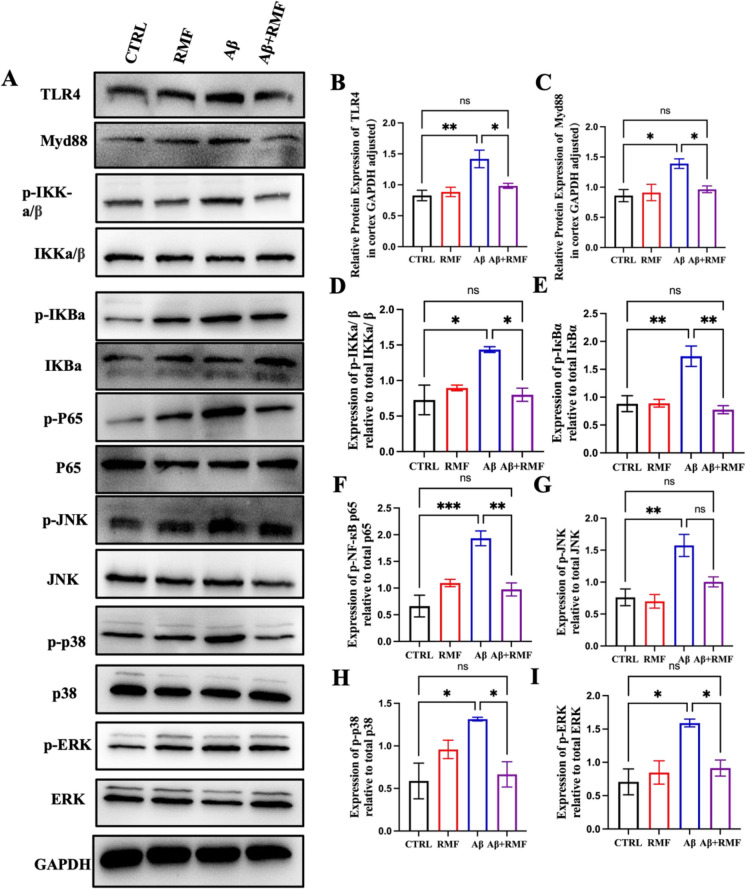
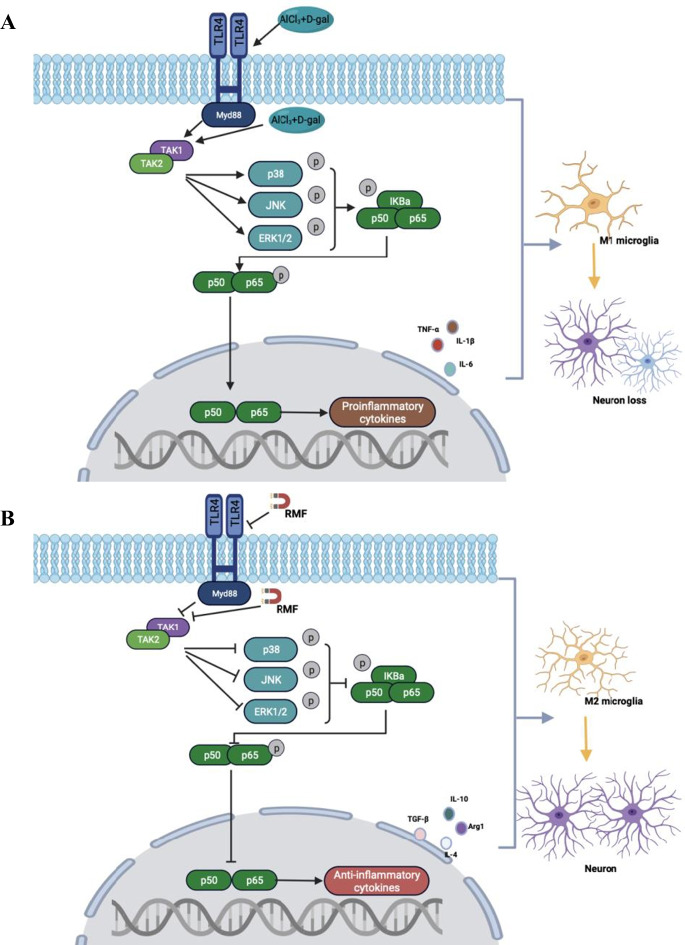
Neuroinflammation, triggered by aberrantly activated microglia, is widely recognized as a key contributor to the initiation and progression of Alzheimer's disease (AD). Microglial activation in the central nervous system (CNS) can be classified into two distinct phenotypes: the pro-inflammatory M1 phenotype and the anti-inflammatory M2 phenotype. In this study, we investigated the effects of a non-invasive rotating magnetic field (RMF) (0.2T, 4Hz) on cognitive and memory impairments in a sporadic AD model of female Kunming mice induced by AlCl3 and D-gal. Our findings revealed significant improvements in cognitive and memory impairments following RMF treatment. Furthermore, RMF treatment led to reduced amyloid-beta (Aβ) deposition, mitigated damage to hippocampal morphology, prevented synaptic and neuronal loss, and alleviated cell apoptosis in the hippocampus and cortex of AD mice. Notably, RMF treatment ameliorated neuroinflammation, facilitated the transition of microglial polarization from M1 to M2, and inhibited the NF-кB/MAPK pathway. Additionally, RMF treatment resulted in reduced aluminum deposition in the brains of AD mice. In cellular experiments, RMF promoted the M1-M2 polarization transition and enhanced amyloid phagocytosis in cultured BV2 cells while inhibiting the TLR4/NF-кB/MAPK pathway. Collectively, these results demonstrate that RMF improves memory and cognitive impairments in a sporadic AD model, potentially by promoting the M1 to M2 transition of microglial polarization through inhibition of the NF-кB/MAPK signaling pathway. These findings suggest the promising therapeutic applications of RMF in the clinical treatment of AD.

Keywords: Microglia polarization; Neuroinflammation; Rotating magnetic field; Sporadic Alzheimer’s disease.


Conflict of interest statement

The authors declare no competing interests.

Figures

Fig. 1
Fig. 1
The RMF exposure apparatus. A Side view of RMF apparatus. B Top view of RMF apparatus. C The RMF exposure apparatus in the cellular room. D The RMF exposure apparatus in the animal room. E The core structure of RMF apparatus. F Travel direction of the magnetic induction line. G Distribution of magnetic induction intensity
Fig. 2
Fig. 2
RMF treatment ameliorated learning and memory deficits in AD model mice. A Representative track images of mice in the probe test of the Morris water maze. B Escape latency to get to the platform during the training (*P < 0.05 and ***P < 0.001: AD vs. CTRL; #P < 0.05 and ##P < 0.01: AD vs. AD + RMF). C Target (platform) entries in the probe test. D Distance spent in the target quadrant in the probe test. E Swimming speed in the probe test. F Novel object recognition index in the novel object recognition test. Data are expressed in the form of means ± SEM. *P < 0.05, **P < 0.01, and ***P < 0.001; ns, not significant. n = 6
Fig. 3
Fig. 3
RMF treatment attenuated hippocampal morphological damage and neuronal death. A Representative images of Nissl staining in the hippocampus and the CA1 region. B Representative images of NeuN staining in the hippocampal CA1 and cortex were examined by Immunohistochemistry. Scale bars = 50 μm. Quantification of NeuN-positive cells in CA1 (C) and cortex (D). EG levels of NeuN in the hippocampus and cortex were examined by Western blot and quantified with Image J software. Data were performed as means ± SEM. *P < 0.05, **P < 0.01 and ***P < 0.001; ns, not significant. n = 6
Fig. 4
Fig. 4
RMF treatment relieved hippocampal and cortical cell apoptosis. A, B Representative images of TUNEL staining in the hippocampal DG (A) and cortex (B) region. Scale bars = 100 μm. C, D Statistical analysis of apoptosis rate in the hippocampal DG (C) and cortex (D) region. Data were performed as means ± SEM. *P < 0.05, **P < 0.01, ***P < 0.001; ns, not significant. n = 5
Fig. 5
Fig. 5
RMF treatment inhibited M1-type microglia polarization and promoted M2-type microglia polarization. A, B Co-immunofluorescence staining of the CA1 (A) and cortex region (B) for Iba 1 (activated microglia marker) (green) and DAPI (blue). CE Expression levels of Iba 1 in the hippocampus and cortex were examined by Western blot and quantified with ImageJ software. FG Co-immunofluorescence staining of the CA1 region for M1 marker CD86 (red) (F), M2 marker CD206 (red) (G), and DAPI (blue). Scale bars = 50 μm. H, I Statistical graph of (F) and (G), respectively. Data were performed as means ± SEM. *P < 0.05, **P < 0.01, ***P < 0.001; ns, not significant. n = 5
Fig. 6
Fig. 6
RMF treatment regulated the secretion of pro-inflammatory/anti-inflammatory cytokines in the AD mice. A The levels of IL-6, TNF-α, IL-4, and TGF-β1 in the serum of AD model mice were determined using corresponding ELISA kits. B Relative mRNA levels of IL-6, IL-1β, iNOS, and TNF-α in the hippocampus of AD model mice. C Relative mRNA levels of TGF-β1, Arg-1, IL-4, IL-10 in the hippocampus of AD model mice. D–F Expression levels of IL-6, iNOS, TGF-β1, and Arg 1 in the hippocampus and cortex were examined by Western blot and quantified with ImageJ software. Data were performed as means ± SEM. *P < 0.05, **P < 0.01, and ***P < 0.001; ns, not significant. n = 6
Fig. 7
Fig. 7
RMF treatment reduced Al deposition in the brain of AD mice. A Representative images of Lumogallion staining in the hippocampal CA3 and cortex region. Scale bars = 50 μm. B statistical graph of (A). Data were performed as means ± SEM. *P < 0.05, **P < 0.01, and ***P < 0.001; n = 6
Fig. 8
Fig. 8
RMF treatment reduced ROS levels in the brain and NO production in the serum of AD mice. A ROS level in the hippocampal CA3 and cortex region. Scale bars = 50 μm. B Statistical graph of (A). C The level of NO in serum was determined using NO assay. Data are means ± SEM. *P < 0.05, **P < 0.01, and ***P < 0.001; ns, not significant; n = 6
Fig. 9
Fig. 9
RMF treatment reduced Aβ deposition in the AD model mice. A Representative images of Aβ (6E10) staining in the hippocampal CA1 and CA3 region. Scale bars = 100 μm. B Quantification of Aβ plaques in the cortex and hippocampal CA1 and CA3 region. C Co-immunofluorescence staining of Aβ (6E10) (red) and M2 marker CD206 (green). Scale bars = 20 μm. D The number of CD206-positive microglia around plaques. Data were performed as means ± SEM. *P < 0.05; ns, not significant. n = 6
Fig. 10
Fig. 10
The whole-transcriptome sequencing of hippocampal tissues. A Volcano maps of differential genes between AD and AD + RMF group. B, C Classification map of differential gene KEGG pathway. D Heatmap for the differential gene in MAPK signal pathway. n = 3
Fig. 11
Fig. 11
RMF treatment inhibited NF-κB and MAPK pathways in vivo. AI Expression levels of TLR4, Myd88, p-IKKα/β, IKKα/β, p-IкBα, IкBα, p-NF-кB p65, NF-кB p65, p-JNK, JNK, p-p38, p38, p-ERK, and ERK in the hippocampus were examined by Western blot and quantified with ImageJ software. Data were performed as means ± SEM. *P < 0.05, **P < 0.01, and ***P < 0.001, ns, not significant. n = 3
Fig. 12
Fig. 12
RMF treatment promotes amyloid phagocytosis in BV2 cells. A Identification of Aβ1-42 oligomers was determined by Western blot using 6E10 antibody. B Viability of BV2 cells pre-treated by Aβ1-42 in different concentrations after 24 h. C Viability of BV2 cells treated with RMF at different times. D Co-immunofluorescence staining of BV2 cells of Iba 1 (red), 6E10 (green), and DAPI (blue). E Statistical graph of (D). F, G Expression levels of 6E10 in BV2 cells after Aβ1-42 pre-treatment were examined by Western blot and quantified with ImageJ software. Scale bars = 50 μm. Data were performed as means ± SEM. *P < 0.05, **P < 0.01, and ***P < 0.001; ns, not significant, dimensionless unit. n = 3
Fig. 13
Fig. 13
RMF treatment inhibited the release of pro-inflammatory cytokines and promoted the secretion of anti-inflammatory cytokines in vitro. A, B The levels of IL-6 (A) and TGF-β1 (B) in the supernatant collected in 3 h, 6 h, 12 h, and 24 h after Aβ stimulation were determined using corresponding ELISA kits. CJ Relative mRNA expression levels of IL-6 (C), IL-1 β (D), iNOS (E), TNF- α (F), TGF-β1 (G), Arg-1 (H), IL-4 (I), and IL-10 (J) in BV2 cells. K-O Protein expression levels of IL-6, iNOS, TGF-β1, and Arg 1 in BV2 cells were examined by Western blot and quantified with ImageJ software. Data were performed as means ± SEM. *P < 0.05, **P < 0.01, ***P < 0.001; ns, not significant. n = 5
Fig. 14
Fig. 14
RMF treatment increased the proportion of CD206-positive cells and reduced that of the CD86-positive cells. A, B Immunofluorescence staining of BV2 cells with M1 marker CD86 (A) and M2 marker CD206 (B) (green); C, D The percentage of CD86 and CD206 positive BV2 cells were assessed by flow cytometry. Scale bars = 50 μm. Data were performed as means ± SEM. *P < 0.05, **P < 0.01; ns, not significant. n = 3
Fig. 15
Fig. 15
RMF treatment attenuated ROS, reduced NO production, and inhibited BV2 cell migration. A Intracellular ROS levels in Aβ1-42 pre-treated BV2 cells were determined using H2DCFDA assay. B The levels of NO in the supernatant were determined using NO assay. C The changes in cell migration were determined by trans-well assay. D The ratio of cell migration. Scale bars = 50 μm. Data were performed as means ± SEM. *P < 0.05, **P < 0.01, ***P < 0.001; ns, not significant. n = 3
Fig. 16
Fig. 16
RMF treatment inhibited the activation of NF-κB and MAPK pathways in vitro. AI Expression levels of TLR4, Myd88, p-IKKα/β, IKKα/β, p-IкBα, IкBα, p-NF-кB p65, NF-кB p65, p-JNK, JNK, p-p38, p38, p-ERK, and ERK in BV2 cells were examined by Western blot and quantified with ImageJ software. Data were performed as means ± SEM. *P < 0.05, **P < 0.01, and ***P < 0.001; ns, not significant. n = 5
Fig. 17
Fig. 17
A proposed mechanism that underlies the ameliorative effects of RMF on the cognitive and memory impairments of AD mice in this study. A AlCl3 and D-gal stimulated inflammation by activating the TLR4-Myd88-MAPK-NF-κB signaling pathway, resulting in overactivated M1-type microglia and subsequent neuronal loss. B RMF exerted anti-inflammatory effects by inhibiting the TLR4-Myd88-MAPK-NF-κB signaling pathway and promoting the M2-type polarization shifting of microglia to play a neuroprotective role

Similar articles

References

    1. Alzheimer’s disease facts and figures. Alzheimers Dement. 2023;19:1598-1695. 10.1002/alz.13016. - PubMed
    1. Arriagada PV, Growdon JH, Hedley-Whyte ET, Hyman BT. Neurofibrillary tangles but not senile plaques parallel duration and severity of Alzheimer’s disease. Neurology. 1992;42:631–9. 10.1212/wnl.42.3.631. - PubMed
    1. Glenn JA, Ward SA, Stone CR, Booth PL, Thomas WE. Characterisation of ramified microglial cells: detailed morphology, morphological plasticity and proliferative capability. J Anat. 1992;180(Pt 1):109–18. - PMC - PubMed
    1. Nimmerjahn A, Kirchhoff F, Helmchen F. Resting microglial cells are highly dynamic surveillants of brain parenchyma in vivo. Science. 2005;308:1314–8. 10.1126/science.1110647. - PubMed
    1. Lavin Y, et al. Tissue-resident macrophage enhancer landscapes are shaped by the local microenvironment. Cell. 2014;159:1312–26. 10.1016/j.cell.2014.11.018. - PMC - PubMed

Substances

LinkOut - more resources