[Preprint]. 2024 Jun 8:2024.06.08.597999.
doi: 10.1101/2024.06.08.597999.

Identification of molecular determinants of gene-specific bursting patterns by high-throughput imaging screens

Affiliations

Identification of molecular determinants of gene-specific bursting patterns by high-throughput imaging screens

Varun Sood et al. bioRxiv. .

Abstract

Stochastic transcriptional bursting is a universal property of active genes. While different genes exhibit distinct bursting patterns, the molecular mechanisms for gene-specific stochastic bursting are largely unknown. We have developed and applied a high-throughput-imaging based screening strategy to identify cellular factors and molecular mechanisms that determine the bursting behavior of human genes. Focusing on epigenetic regulators, we find that protein acetylation is a strong acute modulator of burst frequency, burst size and heterogeneity of bursting. Acetylation globally affects the Off-time of genes but has gene-specific effects on the On-time. Yet, these effects are not strongly linked to promoter acetylation, which do not correlate with bursting properties, and forced promoter acetylation has variable effects on bursting. Instead, we demonstrate acetylation of the Integrator complex as a key determinant of gene bursting. Specifically, we find that elevated Integrator acetylation decreases bursting frequency. Taken together our results suggest a prominent role of non-histone proteins in determining gene bursting properties, and they identify histone-independent acetylation of a transcription cofactor as an allosteric modulator of bursting via a far-downstream bursting checkpoint.

Keywords: Integrator complex; Stochastic gene bursting; acetylation; high-throughput imaging screen.


Conflict of interest statement

Declaration of interests The authors declare no competing interests.

Figures
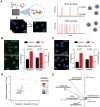
Figure 1:
Figure 1:. A high-throughput assay for transcriptional bursting of native genes based on nscRNA-FISH.
A. Schematic of a high-throughput nscRNA-FISH assay to measure transcriptional bursting of endogenous genes. Left. Fluorescent probes targeting the intron of target genes are hybridized to fixed cells in 384-well plate and the number of active TS are measured using automated image acquisition and spot segmentation. Right. The average number of active TS for cells in the population is a surrogate for the bursting behavior of genes. The number of active TS at any given time in the population is higher for a gene with high bursting rate. B and C. The RNA-FISH assay accurately detects the increase in transcription bursting seen in live cells. Representative image (left) and plot (right) for the average frequency and intensity of ERRFI1 TS detected using either MS2-GFP (B) or nscRNA-FISH (C) in HBEC for control (DMSO) or trichostatin A (TSA) treated cells. Values represent mean ± SEM of >300 cells from 3 biological replicates. Scale bar = 10μm and P value: two sample t-test. Active transcription sites in A, B and C are indicated by arrowheads. D. Reproducibility of small molecule modulator screen for ERRFI1 bursting. Relative TS frequency (Freq) of ERRFI1, defined as the ratio of TS frequency in treated vs untreated (DMSO) controls from two biological replicates of the screen. The average change in the relative TS intensity is color coded on each data point. E. Changes in the mean Off- and On- times from live-cell bursting assay for ERRFI1 recoded between 4 h to 16 h of treatment with selected inhibitors. Data is representative of >30 cells from one or more acquisitions.
Figure 2.
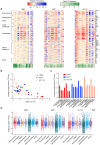
Figure 2.. TS frequency changes are sensitive to changes in acetylation and inversely related with native TS frequencies across multiple cell lines.
A. Heat maps of the relative TS frequency (Freq), defined as the ratio of TS frequency in treated vs untreated (DMSO) controls (FreqTreated/FreqUntreated) obtained from the screen with small molecule modulators targeting different classes of chromatin modifying enzymes for model genes in three cell types: HBEC, MCF7 and HCT116. Treatments with no detectable TS are colored white. The rows are arranged by modulators of major classes indicated on the left, panobinostat treatment is asterisked on the right and gene names are color coded based on their native TS frequencies. Data represents mean of two biological replicates. B. Relationship between native TS frequency (Native TS Freq) and the average change in relative TS frequency, defined as the magnitude of TS frequency changes relative to the native TS frequency for a gene averaged across the screen, avg(|FreqTreated-FreqUntreated|)/FreqUntreated. Values represent mean ± SEM of at least ten and two biological replicates for FreqUntreated and the average magnitude change, respectively. C and D. Quantitation of the impact of the major classes of chromatin modifying enzymes on TS frequency changes. C. Comparison of the magnitude of change in relative TS frequency, averaged across all modulators in the respective classes, avg(|FreqTreated-FreqUntreated|)/FreqUntreated, in three cell lines. Values represent mean ± SEM of two biological replicates. D. Relative changes in TS frequency, (FreqTreated-FreqUntreated)/FreqUntreated, for each modulator of the respective classes in the three cell lines. Values from the two biological replicates are shown adjacent. All TS frequency measurements were derived from imaging of >300 cells per condition and data shown for relative change between 1 and −1.
Figure 3.
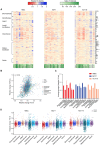
Figure 3.. TS intensity changes are sensitive to acetylation and correlated with changes in TS frequency.
A. Heat maps of the relative TS intensity (Int), defined as the ratio of TS intensity in treated vs untreated (DMSO) controls (IntTreated/IntUntreated) obtained from the screen with small molecule modulators targeting different classes of chromatin modifying enzymes for model genes in three cell types: HBEC, MCF7 and HCT116. Treatments with no detectable TS are colored white. The rows are arranged by modulators of major classes indicated on the left, panobinostat treatment is asterisked on the right and gene names are color coded based on their native TS intensities. Data represents mean of two biological replicates. B. Relationship between relative changes in TS frequency (IntTreated-IntUntreated)/IntUntreated) and TS intensity ((IntTreated-IntUntreated)/IntUntreated) in response to modulators of the major classes. Spearman rank coefficient (rs) indicated. Values represent mean of two biological replicates between ranges of −1.0 to 1.0 and −0.5 to 0.5 for frequency and intensity changes, respectively. C and D. Quantitation of the impact of the major classes of chromatin modifying enzymes on TS intensity changes. C. Comparison of the average change in relative TS intensity, defined as the magnitude of TS intensity changes relative to the native TS intensity averaged across all modulators in the respective classes, avg(|IntTreated-IntUntreated|)/IntUntreated, in three cell lines. Values represent mean ± SEM of two biological replicates. D. Relative changes in TS intensity, (IntTreated-IntUntreated)/IntUntreated, for each modulator in the respective classes from three cell lines. Values from the two biological replicates are show adjacent. All TS intensity measurements were derived from imaging of >300 cells per condition and data shown for relative change between 0.5 and −0.5.
Figure 4.
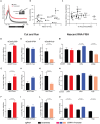
Figure 4.. Deacetylase inhibitor decreases Off-time but change On- time on a gene-specific basis.
A and B. Normalized histograms for the Off- (A) and On-(B) time of bursting for model genes in DMSO controls and deacetylase inhibitor (Panobinostat) treated cells from live-cell bursting assay using a monoclonal cell lines with MS2 inserted in the intron of model genes. The acquisition post 4 h of treatment was done for 12 h at 100 s interval. P value: Kolmogorov–Smirnov test. C. Mean changes in the Off- and On- time between panobinostat treated cell vs controls from live-cell bursting assay described in A and B. The data in A-C was derived from >40 cells from one or more acquisitions. D. Relative TS frequencies between panobinostat treated and control cells from nscRNA-FISH for model genes after four hours of incubation with panobinostat. Data represents mean of two biological replicates of >300 cells per condition E. qRT-qPCR for model genes at different incubations times in panobinostat. The abundances between samples were normalized with a spike-in control. Values represent mean ± SEM of at least three biological replicates.
Figure 5:
Figure 5:. Changes in TS frequencies are stoichiometrically uncoupled from chromatin acetylation changes.
A. Meta-gene plot of H3K27ac levels at the gene-body ± 1kb region in HBEC treated with panobinostat or DMSO (control) for 4 h. H3K27ac levels between samples were normalized using spike-in Drosophila chromatin for comparison. The values represent mean ± SEM from at least 2 and 3 biological replicates for control and panobinostat treated cell, respectively. The inset shows the western blot for total H3K27ac and H3 loading control in treated and control cells. B and C. Plots depicting the lack of correlation between native TS frequency and H3K27ac levels at the promoter region (TSS ± 1kb) in (B) DMSO controls and (C) the relative changes in panobinostat (Pano) vs DMSO control for model genes used in the screen. Values represent mean ± SEM from at least 2 biological replicates. D-O. Spike-in normalized qPCR coupled Cut-and-Run assay for promoter H3K27ac levels (D-L) and nscRNA-FISH (M-O) for ERRFI1 (D, G, J and M), MYC (E, H, K and N) and CASC19 (F, I, L and O) upon dCas9 tethering of p300 (D-F), VP64(G-I) or Krab(J-L). Cut-and-Run values represent mean ± SEM of at least three biological replicates. TS frequencies in B, C, M, N and O were estimated from >300 cells for each experiment. P value (t-test) for the significant differences from the controls are indicated.
Figure 6:
Figure 6:. Acetylation at Ints4 K26–27 decreases bursting of target genes.
A. Enrichment plot for genes based on the increased levels of immune-enriched acetylated lysine containing peptides (Log2FC>0.2) derived from nuclei of HBEC treated with panobinostat for 4 h with respect to control treatment (DMSO). The values represent mean ± SEM from two experiments with 5 and 9 biological replicates. B. TS frequency for ERRFI1, KPNB1 and MYC after 48 h depletion of INTS4 using both siRNA and sgRNA targeted to INTS4 gene body and promoter, respectively, or scrambled controls in wild-type cells constitutively expressing dCas9-KRAB. C-D. Assaying the effect of overexpressing wild-type and mutant INTS4. TS frequencies for ERRFI1, KPNB1 and MYC in monoclonal wild-type HBEC lines with no ectopic INTS4 (Blank) or ectopic expression of either wild-type INTS4, acetylation mimic (INTS4 K>Q) and acetylation null (INTS4 K>A) mutant, normalized by allele frequency relative to HBEC with no ectopic INTS4. Both K26 and K27 were altered in the mutants. The TS frequency values in B and C represents mean ± SEM of at least four biological replicates with >300 cells for each experiment and P value (t-test) for the significant differences from the controls are indicated. D. Mean changes in the Off- and On- times of ERRFI1 bursting in INTS4 depleted cells or monoclonal cells over expressing the INTS4 mutant (acetylation mimic and null), with respect to the scrambled control or cells overexpressing wild-type INTS4, respectively. The mean values were derived from >40 cells from one or more acquisitions.

Similar articles

References

    1. Chubb J.R., Trcek T., Shenoy S.M., and Singer R.H. (2006). Transcriptional pulsing of a developmental gene. Curr Biol 16, 1018–1025. 10.1016/j.cub.2006.03.092. - DOI - PMC - PubMed
    1. Golding I., Paulsson J., Zawilski S.M., and Cox E.C. (2005). Real-time kinetics of gene activity in individual bacteria. Cell 123, 1025–1036. 10.1016/j.cell.2005.09.031. - DOI - PubMed
    1. Larson D.R., Zenklusen D., Wu B., Chao J.A., and Singer R.H. (2011). Real-time observation of transcription initiation and elongation on an endogenous yeast gene. Science 332, 475–478. 10.1126/science.1202142. - DOI - PMC - PubMed
    1. Raj A., Peskin C.S., Tranchina D., Vargas D.Y., and Tyagi S. (2006). Stochastic mRNA synthesis in mammalian cells. PLoS Biol 4, e309. 10.1371/journal.pbio.0040309. - DOI - PMC - PubMed
    1. Lenstra T.L., Rodriguez J., Chen H., and Larson D.R. (2016). Transcription Dynamics in Living Cells. Annu Rev Biophys 45, 25–47. 10.1146/annurev-biophys-062215-010838. - DOI - PMC - PubMed

Publication types