. 2024 May 9;22(1):qzae003.
doi: 10.1093/gpbjnl/qzae003.

Integrated Single-cell Multiomic Analysis of HIV Latency Reversal Reveals Novel Regulators of Viral Reactivation

Affiliations

Integrated Single-cell Multiomic Analysis of HIV Latency Reversal Reveals Novel Regulators of Viral Reactivation

Manickam Ashokkumar et al. Genomics Proteomics Bioinformatics. .

Abstract

Despite the success of antiretroviral therapy, human immunodeficiency virus (HIV) cannot be cured because of a reservoir of latently infected cells that evades therapy. To understand the mechanisms of HIV latency, we employed an integrated single-cell RNA sequencing (scRNA-seq) and single-cell assay for transposase-accessible chromatin with sequencing (scATAC-seq) approach to simultaneously profile the transcriptomic and epigenomic characteristics of ∼ 125,000 latently infected primary CD4+ T cells after reactivation using three different latency reversing agents. Differentially expressed genes and differentially accessible motifs were used to examine transcriptional pathways and transcription factor (TF) activities across the cell population. We identified cellular transcripts and TFs whose expression/activity was correlated with viral reactivation and demonstrated that a machine learning model trained on these data was 75%-79% accurate at predicting viral reactivation. Finally, we validated the role of two candidate HIV-regulating factors, FOXP1 and GATA3, in viral transcription. These data demonstrate the power of integrated multimodal single-cell analysis to uncover novel relationships between host cell factors and HIV latency.

Keywords: HIV latency reversal; HIV-regulating factor; Machine learning; Primary CD4+ T cell; Single-cell multiomics.


Conflict of interest statement

The authors have declared no competing interests.

Figures
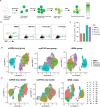
Figure 1
Figure 1
Single-cell multiomic analysis of HIV latency reversal A. A schematic of the experimental design of primary CD4+ T cell HIV latency model followed by stimulation with LRAs. DMSO was used as a control. B. Flow cytometry showing the expression of the viral GFP reporter in HIV-GFP-infected primary CD4+ T cells from donor 1 after exposure to LRAs (vorinostat, prostratin, and iBET151) or control vehicle (DMSO). C. Bar plot showing the percentage of GFP+ cells in infected cells for each condition. D. and E. UMAP dimension reduction of scRNA-seq and scATAC-seq, and WNN with cells labeled by conditions (D) and by graph-based clusters (E). Data shown here are from primary CD4+ T cells of donor 1. Data from 2D10 cells and primary CD4+ T cells of donor 2 are shown in Figures S1 and S2, respectively. LRA, latency reversing agent; HIV, human immunodeficiency virus; GFP, green fluorescent protein; DMSO, dimethylsulfoxide; WNN, weighted nearest neighbor; UMAP, Uniform Manifold Approximation and Projection; scRNA-seq, single-cell RNA sequencing; scATAC-seq, single-cell assay for transposase-accessible chromatin with sequencing.
Figure 2
Figure 2
HIV vRNA expression and chromatin accessibility A. Transformed HIV vRNA reads under different treatment conditions. P values from one-way ANOVA test and for significant pairwise differences based on the Tukey test are shown. B. UMAP plot of the scRNA-seq data color-coded based on the level of HIV vRNA expression. C. Transformed HIV mapping scATAC-seq reads under different treatment conditions. P values from one-way ANOVA test and for significant pairwise differences based on the Tukey test are shown. D. UMAP plot of the scATAC-seq data color-coded based on the levels of HIV mapping scATAC-seq reads. E. Correlation scatter plot showing the sqrt proportion of scATAC-seq reads mapping to HIV (X-axis) vs. the sqrt proportion of scRNA-seq reads mapping to HIV (Y-axis) across the cell population. F. Coverage plots showing normalized read counts from scATAC-seq along the HIV reference genome for different LRA conditions. The dark blue and gray boxes represent gene annotations and ATAC-seq peaks, respectively. G. Dot plot showing the percentage of cells expressing HIV and the average expression level for vRNAs. H. Percentage of cells with accessible HIV DNA and the average accessibility for different regions of the HIV proviral genome. Data shown here are from primary CD4+ T cells of donor 1. Data from 2D10 cells and primary CD4+ T cells of donor 2 are shown in Figures S4 and S5, respectively. ANOVA, analysis of variance; ATAC, assay for transposase-accessible chromatin; scATAC-seq, single-cell assay for transposase-accessible chromatin with sequencing; vRNA, viral RNA; RNA-seq, RNA sequencing; sqrt, square root.
Figure 3
Figure 3
DEGs stimulated by LRAs A. Venn diagrams showing the number of down-regulated (upper) and up-regulated (lower) genes upon treatment with LRAs (FDR-adjusted P value < 0.05). B. Heatmaps showing normalized and scaled RNA expression levels for different treatment conditions. The rows contain representative genes that were down-regulated (left) and up-regulated (right), respectively. The columns represent single cells. Data shown here are from primary CD4+ T cells of donor 1. Data from 2D10 cells and primary CD4+ T cells of donor 2 are shown in Figures S9 and S10, respectively. FDR, false discovery rate.
Figure 4
Figure 4
DATFs stimulated by LRAs A. Venn diagrams showing the number of TFs whose motif accessibilities were significantly down-regulated (upper) or up-regulated (lower) upon treatment with LRAs compared with DMSO (FDR-adjusted P value < 0.05). B. Box plots showing distributions of motif accessibilities (deviation scores) of selected TFs with decreased accessibility scores (SNAI2, SREBF1, and ZNF135; upper) or increased accessibility scores (NFATC2, RBPJ, and TEAD2; lower) in response to all three LRAs. P values from Wilcoxon rank sum tests comparing DMSO-treated and one of the LRA-treated samples were integrated using the Cauchy combination. C. Box plots showing distributions of motif accessibilities of positive controls, FOS and JUN. Data shown here are from primary CD4+ T cells of donor 1. Data from primary CD4+ T cells of donor 2 and 2D10 cells are shown in Figures S11 and S12, respectively. TF, transcription factor; DATF, differentially accessible transcription factor.
Figure 5
Figure 5
Linkage analyses between HIV transcription and cellular transcripts/TFs/peaks A. Distribution of nominal P values from cellular RNA expression linkage analysis. B. Visualization of selected cellular transcripts linked with HIV vRNA expression. The dotted line represents the fitted line from a simple regression. Spearman correlation coefficient (r) and nominal P value are shown. C. Distribution of nominal P values from TF activity linkage analysis. D. Visualization of activities of selected TFs linked with HIV vRNA expression. E. Distribution of nominal P values from peak linkage analysis. F. Visualization of motifs enriched in ATAC-seq peaks that were positively (top) and negatively (bottom) associated with the HIV vRNA expression. Data shown here are from primary CD4+ T cells of donor 1. Data from 2D10 cells and primary CD4+ T cells of donor 2 are shown in Figures S14 and S15, respectively.
Figure 6
Figure 6
TF regulators of HIV latency reversal A. Venn diagram showing the number of HIV-linked TFs from three different testing schemes: expression linkage analysis of TF-coding genes (TF expression linkage), enrichment analysis of TF-binding motifs using significantly linked peaks (motif enrichment), and analysis of TFs with differential motif accessibility (differential accessibility). B. Heatmap showing correlations between TF pairs for selective 50 TFs with the highest combined P values from the three testing schemes shown in (A). The correlation is computed using the TF-specific consensus PCs, calculated using both the TF-coding gene expression level and its motif accessibility. C. TF regulatory network constructed from TFs’ motif deviation scores and expression levels (see Materials and methods for details). Data shown here are from primary CD4+ T cells of donor 1. Data from 2D10 cells and primary CD4+ T cells of donor 2 are shown in Figures S19 and S20, respectively. PC, principal component.
Figure 7
Figure 7
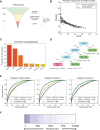
Machine learning model of HIV reactivation A. Schematic overview of model feature selection for GOSDT models of cells with high HIV expression (top 10%) across the dataset. Numbers to left represent the number of features used for model refinement at each stage. B. A set of GOSDT models trained and tested on the dataset were evaluated for precision (percentage of cells classified as high expressors that are actually high expressors) and recall (percentage of high expressors recovered) performances. Each dot represents a model. For each model, performances during training (yellow) and testing (blue) are shown. C. The top 7 most commonly occurring model features used by the set of GOSDT models to classify cells with respect to high HIV expression are shown as a ranked list. D. An example of a decision tree for predicting cells with high HIV expression (top 10%). Features that comprise this model are shown in blue, and the thresholds for data splitting are shown above each arrow. E. Performance of a boosting based XGBoost model predicting HIV expression levels across the cell population. The model was trained (green lines) on data from both primary CD4+ T cell donors (left), donor 1 only (middle), and donor 2 only (right), and tested on each donor separately — donor 1 in yellow and donor 2 in blue. AUC for each test is shown. F. Graphical display of the test dataset ranked by XGBoost predicted likelihood of each being within the top 10% of HIV-expressing cells (left to right), with cells that are actually within the top 10% shown as vertical blue columns. GOSDT, Generalized and Scalable Optimal Sparse Decision Trees; AUC, area under the curve.
Figure 8
Figure 8
GATA3 and FOXP1 regulate HIV latency A. Binding site accessibility and RNA expression of GATA3 and FOXP1 across drug conditions. B. Western blot showing the depleted GATA3 in 2D10 cells transduced with shGATA3. β-actin was used as a loading control. Non-transduced 2D10 cells were used as mock. C. Flow cytometry analysis of viral GFP expression in 2D10 cells transduced with shGATA3 or shNT at baseline and 24 h after prostratin stimulation. Data were represented by mean ± SD (n = 3). P values were determined by Student’s t-test. D. Western blot showing the depleted FOXP1 in 2D10 cells transduced with shFOXP1. β-actin was used as a loading control. Non-transduced 2D10 cells were used as mock. E. Flow cytometry analysis of viral GFP expression in 2D10 cells at 5 days post transduction with shFOXP1 or shNT. Data were represented by mean ± SD (n = 3). P value was determined by Student’s t-test. F. Dot plot showing representative flow cytometry for viral GFP expression in 2D10 cells at 5 days post transduction with shFOXP1 or shNT. G. Western blot showing the overexpression of FOXP1D in HEK293T cells transfected with a FOXP1-mCherry-expressing plasmid or a mCherry-expressing plasmid (control) plus HIV-GFP. β-actin was used as a loading control. Non-transfected HEK293T cells were used as mock. H. Flow cytometry analysis of viral GFP expression in HEK293 cells transfected with a FOXP1-mCherry-expressing plasmid or a mCherry-expressing plasmid (control) plus HIV-GFP. Data were represented by mean ± SD (n = 3). P value was determined by Student’s t-test. I. Schematic overview of experimental design for CRISPR/Cas9 targeting of GATA3 and FOXP1 in HIV-GFP-infected primary CD4+ T cells. Activated CD4+ T cells were infected with HIV-GFP. At 3 days post infection, infected (GFP+) cells were enriched by flow sorting and cultured for 1 week before nucleofection of Cas9/sgRNA complexes targeting GATA3 or FOXP1. One week post nucleofection of sgRNAs, knockout of the targets was analyzed by Western blot. Furthermore, GFP+ cells were quantified after stimulation with prostratin for 24 h at 1 week post nucleofection. J. Western blot showing the depletion of GATA3 and FOXP1 at 1 week post Cas9/sgRNA nucleofection. β-actin was used as a loading control. HIV-GFP-infected primary CD4+ T cells without Cas9/sgRNA nucleofection were used as mock. K. Flow cytometry analysis of viral GFP expression in HIV-GFP-infected primary CD4+ T cells nucleofected with sgGATA3 or sgFOXP1 at baseline and 24 h after prostratin stimulation. sgNT was used as a negative control, and sgTat was used as a positive control. Data were represented by mean ± SD (n = 3), and P values were determined by one-way ANOVA Tukey’s multiple comparisons test. shRNA, short hairpin RNA; shNT, non-targeting shRNA; shGATA3, GATA3-targeting shRNA; shFOXP1, FOXP1-targeting shRNA; FOXP1A, FOXP1 isoform A; FOXP1D, FOXP1 isoform D; FOXP1-OE, FOXP1 overexpression; sgRNA, single-guide RNA; sgNT, non-targeting sgRNA; sgGATA3, GATA3-targeting sgRNA; sgFOXP1, FOXP1-targeting sgRNA; sgTat, Tat-targeting sgRNA; CRISPR, clustered regularly interspaced short palindromic repeats; Cas9, CRISPR-associated protein 9; SD, standard deviation.

Similar articles

References

    1. Chun TW, Engel D, Berrey MM, Shea T, Corey L, Fauci AS.. Early establishment of a pool of latently infected, resting CD4+ T cells during primary HIV-1 infection. Proc Natl Acad Sci U S A 1998;95:8869–73. - PMC - PubMed
    1. Finzi D, Hermankova M, Pierson T, Carruth LM, Buck C, Chaisson RE, et al.Identification of a reservoir for HIV-1 in patients on highly active antiretroviral therapy. Science 1997;278:1295–300. - PubMed
    1. Siliciano JD, Kajdas J, Finzi D, Quinn TC, Chadwick K, Margolick JB, et al.Long-term follow-up studies confirm the stability of the latent reservoir for HIV-1 in resting CD4+ T cells. Nat Med 2003;9:727–8. - PubMed
    1. Wang Z, Gurule EE, Brennan TP, Gerold JM, Kwon KJ, Hosmane NN, et al.Expanded cellular clones carrying replication-competent HIV-1 persist, wax, and wane. Proc Natl Acad Sci U S A 2018;115:E2575–84. - PMC - PubMed
    1. Maldarelli F, Wu X, Su L, Simonetti FR, Shao W, Hill S, et al.Specific HIV integration sites are linked to clonal expansion and persistence of infected cells. Science 2014;345:179–83. - PMC - PubMed

Publication types

MeSH terms