[Preprint]. 2024 Jun 7:2024.06.07.597932.
doi: 10.1101/2024.06.07.597932.

γ-secretase facilitates retromer-mediated retrograde transport

Affiliations

γ-secretase facilitates retromer-mediated retrograde transport

Yuka Takeo et al. bioRxiv. .

Abstract

The retromer complex mediates retrograde transport of protein cargos from endosomes to the trans-Golgi network (TGN). γ-secretase is a multisubunit protease that cleaves the transmembrane domain of its target proteins. Mutations in genes encoding subunits of retromer or γ-secretase can cause familial Alzheimer disease (AD) and other degenerative neurological diseases. It has been reported that retromer interacts with γ-secretase, but the consequences of this interaction are not known. Here, we report that retromer-mediated retrograde protein trafficking in cultured human epithelial cells is impaired by inhibition of γ-secretase activity or by genetic elimination of γ-secretase. γ-secretase inhibitor XXI and knockout of PS1, the catalytic subunit of γ-secretase, inhibit endosome to TGN trafficking of retromer-dependent retrograde cargos, divalent metal transporter 1 isoform II (DMT1-II), cation-independent mannose-6-phosphate receptor (CIMPR), and shiga toxin. Trafficking of retromer-independent cargos, such as cholera toxin and a CIMPR mutant that does not bind to retromer was not affected by γ-secretase inhibition. XXI treatment and PS1 KO inhibit interaction of γ-secretase with retromer but do not inhibit the association of cargo with retromer or with γ-secretase in intact cells. Similarly, these treatments do not affect the level of Rab7-GTP, which regulates retromer-cargo interaction. These results suggest that the γ-secretase-retromer interaction facilitates retromer-mediated retrograde trafficking.

Keywords: protein trafficking; retrograde; retromer; shiga toxin; γ-secretase.


Figures
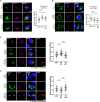
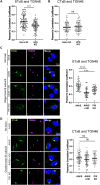
Figure 1.
Figure 1.. γ-secretase inhibition and PS1 knockout inhibit retrograde trafficking of DMT1-II.
(A) Parental control HeLa cells (AAVS) and PS1 knockout HeLa cells (PS1 KO) were treated with DMSO or 1μM γ-secretase inhibitor XXI for 30 min and then transfected with a plasmid expressing GFP-DMT1-II. Cells were fixed 24 h post transfection (hpt) and stained with DAPI and an antibody recognizing EEA1. Fluorescence images of single confocal planes are shown: GFP-DMT1-II, intrinsic green fluorescence; EEA1, magenta; nuclei, blue. Merged images show overlap between GFP-DMT1-II and EEA1 pseudocolored white. Graph shows Pearson’s correlation coefficients for colocalization of GFP-DMT1-II and EEA1 in cells expressing GFP-DMT1-II. Each dot represents an individual cell (n=25), and black horizonal line indicates the mean value of the analyzed population in each group. *, P<0.05; ****, P<0.0001. Similar results were obtained in three independent experiments. (B) As in (A) except cells were stained with an antibody recognizing TGN46 instead of EEA1, and merged image shows overlap between GFP-DMT1-II and TNG46. **, P<0.01; ***, P<0.001. (C) AAVS and PS1 KO cells were transfected with a plasmid expressing GFP-DMT1-II and cotransfected with the empty control plasmid or a plasmid expressing FLAG-PS1. Cells were fixed 24 hpt and stained with DAPI and antibodies recognizing EEA1 and FLAG. Fluorescent images of single confocal planes are shown: GFP-DMT1-II, intrinsic green fluorescence; EEA1, magenta; FLAG-PS1, red; nuclei, blue. Merged images show overlap between GFP-DMT1-II and EEA1 pseudocolored white. Graph shows Pearson’s correlation coefficients for colocalization of GFP-DMT1-II and EEA1 in cells expressing GFP-DMT1-II (or co-expressing GFP-DMT1-II and FLAG-PS1 in the case of cells transfected with plasmid expressing FLAG-PS1 [KO + PS1]). Each dot represents an individual cell (n>50), and horizonal line indicates the mean value of the analyzed population in each group. **, P<0.01; ****, P<0.0001. Similar results were obtained in two independent experiments. (D) As in (C) except cells were stained with antibodies recognizing TGN46 and FLAG, and merged images show overlap between GFP-DMT1-II and TGN46.
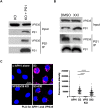
Figure 2.
Figure 2.. γ-secretase inhibition and PS1 knockout inhibit retrograde trafficking of shiga toxin but not cholera toxin.
(A) HeLa S3 cells and VPS35/26 KO HeLa S3 cells (VPS KO) were incubated with 1 μg/ml fluorescent shiga toxin subunit B (STxB). Cells were fixed 30 min after the treatment and stained with DAPI and an antibody recognizing TGN46. Fluorescent confocal images were captured to determine overlap between STxB with TGN46 (representative images in Fig. S3). Graph shows Pearson’s correlation coefficients for colocalization between STxB and TGN46 in cells containing detectable toxin. Each dot represents an individual cell (n>50), and horizonal lines indicate the mean value of the analyzed population in each group. ****, P<0.0001. Similar results were obtained in two independent experiments. (B) Same as (A) except cells were incubated with 1 μg/ml fluorescent cholera toxin subunit B (CTxB), and Graph shows Pearson’s correlation coefficients for colocalization between CTxB and TGN46 in cells containing detectable toxin ns, not significant. (C) AAVS and PS1 KO HeLa cells were treated with DMSO or XXI for 24 h and then incubated with or without 1 μg/ml fluorescent STxB. Cells were fixed 30 min after treatment and stained with DAPI and an antibody recognizing TGN46. Fluorescent images of single confocal planes are shown: STxB, green; TGN46, magenta; nuclei, blue. Merged images show overlap between STxB and TGN46 pseudocolored white. Similar results were obtained in two independent experiments. Graph shows Pearson’s correlation coefficients for colocalization between STxB and TGN46 in cells containing detectable toxin. Each dot represents an individual cell (n>50), and horizonal lines indicate the mean value of the analyzed population in each group. ***, P<0.001; ****, P<0.0001. Similar results were obtained in two independent experiments. (D) As in (C) except cells were incubated with 1 μg/ml fluorescent (CTxB), and merged images show overlap between CTxB and TGN46. ns, not significant.
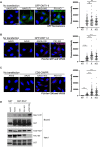
Figure 3.
Figure 3.. Inhibition of γ-secretase does not affect expression or localization of the retromer complex and vice-versa.
(A) Extracts were prepared from HeLa S3, VPS35/26 KO, AAVS, and PS1 KO cells, and from AAVS cells treated with 1 μM XXI for 24 h. Cell extracts were subjected to western blot analysis using antibodies recognizing endogenous VPS35, VPS26, VPS29, PS1, NCT, DMT1, and actin (as a loading control). (B) AAVS and PS1 KO HeLa cells were treated with DMSO or 1 μM XXI for 24 h and then stained with DAPI and antibodies recognizing VPS26 and EEA1. Fluorescent images of single confocal planes are shown: VPS26, green; EEA1, magenta; nuclei, blue. Merged image shows overlap between VPS26 and EEA1 pseudocolored white. Graph shows Pearson’s correlation coefficients for colocalization of VPS26 and EEA1. Each dot represents an individual cell (n>40), and horizonal lines indicate the mean value of the analyzed population in each group. ns, not significant. Similar results were obtained in two independent experiments. (C) As in (B) except cells were stained with an antibody recognizing TGN46, and merged images and graph shows overlap between VPS26 and TGN46. (D) Images as in (B) and (C) were quantified, and graph shows Pearson’s correlation coefficient for overlap between VPS26 and EEA1 (left panel) and VPS26 and TGN46 (right panel). ns, not significant. (E) HeLa S3 and VPS35/26 KO cells were stained with antibodies recognizing APH1 and EEA1, and merged image shows overlap between APH1 and EEA1 pseudocolored white. (F) Same as (E) except cells were stained with antibodies recognizing APH1 and TGN46, and merged images shows overlap between APH1 and TGN46 pseudocolored white. (G) Images as in (E) and (F) were quantified, and graph shows Pearson’s correlation coefficient for overlap between APH1 and EEA1 (left panel) and APH1 and TGN46 (right panel). ns, not significant.
Figure 4.
Figure 4.. γ-secretase and retromer interact in cell lysates and intact cells.
(A) PS1 KO cells were transfected with plasmids expressing VPS35, VPS26, and VPS29 and with empty control plasmid or a plasmid expressing FLAG-PS1. 24 hpt, detergent lysates were prepared and immunoprecipitated (IP) with an antibody recognizing PS1 and subjected to western blot analysis using an antibody recognizing VPS35 or PS1, as indicated. Blot of total lysates is shown as input. 2.25% for input and 47.75% for IP was used for Western blot analysis. Similar results were obtained in two independent experiments. (B) Same as (A) except HeLa cells expressing endogenous PS1 were transfected with plasmids expressing VPS35, VPS26, VPS29 and then treated with DMSO or 1 μM XXI. Similar results were obtained in four independent experiments. (C) HeLa S3 cells were treated with DMSO or 1μM XXI for 24 h, and then PLA was performed with antibodies recognizing APH1 and VPS35. As negative controls, PLA was performed in VPS26/35 KO cells or in HeLa S3 cells with the VPS35 antibody omitted (α-APH1 alone). Images show single confocal planes. PLA signals are magenta; nuclei are stained blue with DAPI. The fluorescence of PLA signals was determined from multiple images. In the graph, each dot represents an individual cell (n>50) and horizonal lines indicate the mean value of the analyzed population in each group. ****, P<0.0001. Similar results were obtained in two independent experiments.
Figure 5.
Figure 5.. γ-secretase inhibition and PS1 knockout do not block association of retromer and cargo nor increase the levels of GTP-Rab7.
(A) AAVS and PS1 KO HeLa cells were treated with DMSO or 1 μM XXI for 30 min and then mock transfected (NT) or transfected with a plasmid expressing GFP-DMT1-II. Cells were fixed 24 hpt and stained with DAPI. Single confocal planes are shown: GFP-DMT1-II, intrinsic green fluorescence; nuclei, blue. The GFP signals from multiple images was determined. In the graph, each dot represents an individual cell (n>50) and horizonal lines indicate the mean value of the analyzed population in each group. ns, not significant. Similar results were obtained in two independent experiments. (B) Cells were treated as in panel (A). After fixation, PLA was performed with antibodies recognizing GFP and VPS35. Single confocal planes are shown: PLA signals, magenta; nuclei, blue. These are the same fields of cells shown in panel (A). PLA signals from multiple images was determined in cells expressing GFP-DMT1-II. In the graph, each dot represents an individual cell (n>50) and horizonal lines indicate the mean value of the analyzed population in each group. ****, P<0.0001. Similar results were obtained in two independent experiments. (C) As in (B) except cells were transfected with a plasmid expressing CD8-CIMPR, and PLA was performed with antibodies recognizing CD8 and VPS35. **, P<0.01; ****, P<0.0001. (D) As indicated, AAVS and PS1 KO cells were untransfected, or PS1 KO cells were transfected with siRNA targeting TBC1D5 and then treated with DMSO or 1 μM XXI for 24 h. 48 hpt, detergent lysates were incubated with GST or GST-RILP, pulled down with glutathione agarose and subjected to western blot analysis by using antibodies recognizing Rab7 or GST (panels labeled bound). Western blot of total lysates probed for Rab7, TBC1D5, and GST is shown as input. Similar results were obtained in three independent experiments.
Figure 6.
Figure 6.. γ-secretase colocalizes with STxB in intact cells.
HeLa S3 and VPS26/35 KO cells were treated with DMSO or 1 μM XXI for 24 h and then incubated with 1 μg/ml fluorescent STxB for 30 min. Cells were fixed and stained with DAPI and an antibody recognizing APH1. Fluorescent confocal images were captured to determine overlap between STxB with APH1. Graph shows Pearson’s correlation coefficients for colocalization between STxB and APH1 in cells containing detectable toxin. Each dot represents an individual cell (n>50), and horizonal lines indicate the mean value of the analyzed population in each group. ***, P<0.001. Similar results were obtained in two independent experiments.

Similar articles

References

    1. Burd C. and Cullen P.J., Retromer: a master conductor of endosome sorting. Cold Spring Harb Perspect Biol, 2014. 6(2). - PMC - PubMed
    1. Seaman M.N.J., The Retromer Complex: From Genesis to Revelations. Trends Biochem Sci, 2021. 46(7): p. 608–620. - PubMed
    1. Yoshida S. and Hasegawa T., Beware of Misdelivery: Multifaceted Role of Retromer Transport in Neurodegenerative Diseases. Front Aging Neurosci, 2022. 14: p. 897688. - PMC - PubMed
    1. Wen L., et al., VPS35 haploinsufficiency increases Alzheimer’s disease neuropathology. J Cell Biol, 2011. 195(5): p. 765–79. - PMC - PubMed
    1. Siegenthaler B.M. and Rajendran L., Retromers in Alzheimer’s disease. Neurodegener Dis, 2012. 10(1–4): p. 116–21. - PubMed

Publication types