[Preprint]. 2024 Jun 8:2024.06.07.597858.
doi: 10.1101/2024.06.07.597858.

CLCC1 promotes hepatic neutral lipid flux and nuclear pore complex assembly

Affiliations

CLCC1 promotes hepatic neutral lipid flux and nuclear pore complex assembly

Alyssa J Mathiowetz et al. bioRxiv. .

Abstract

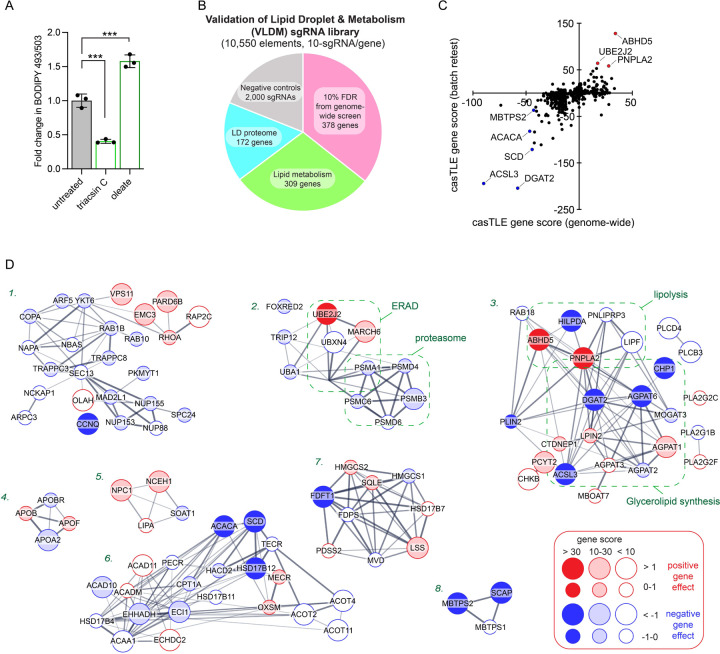
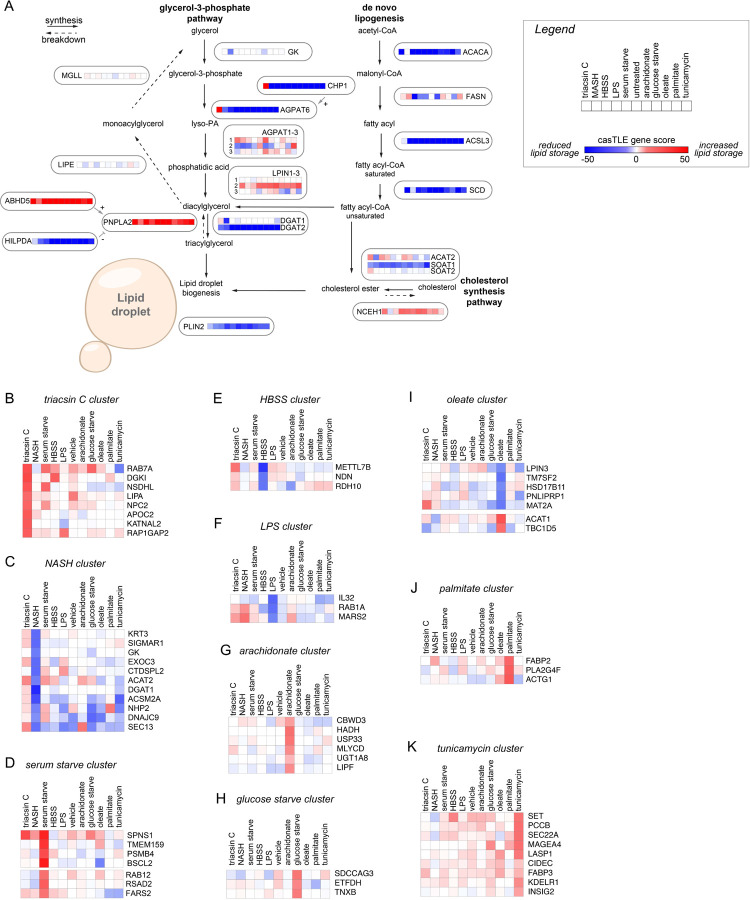
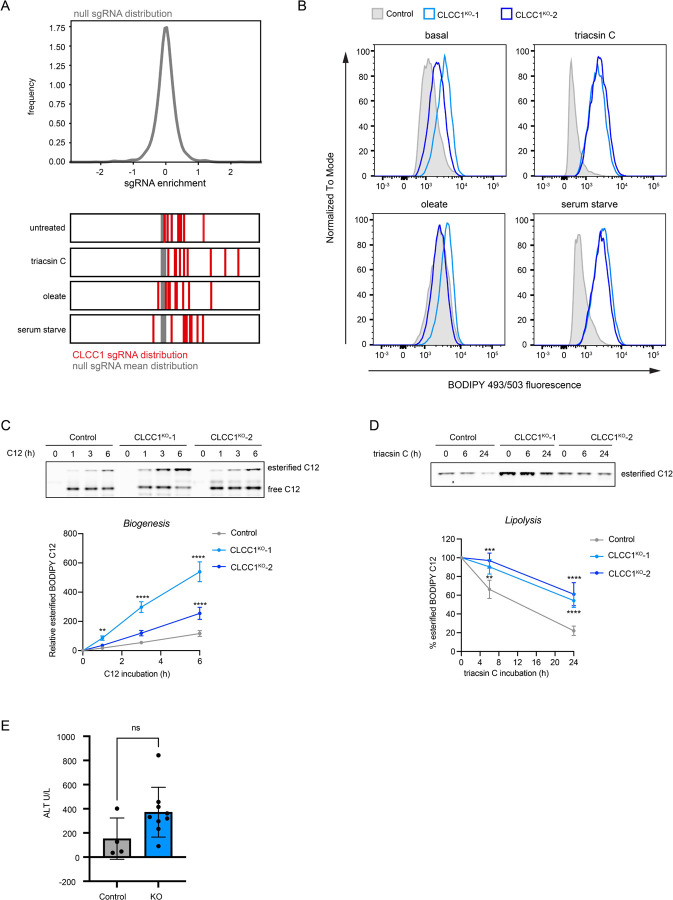
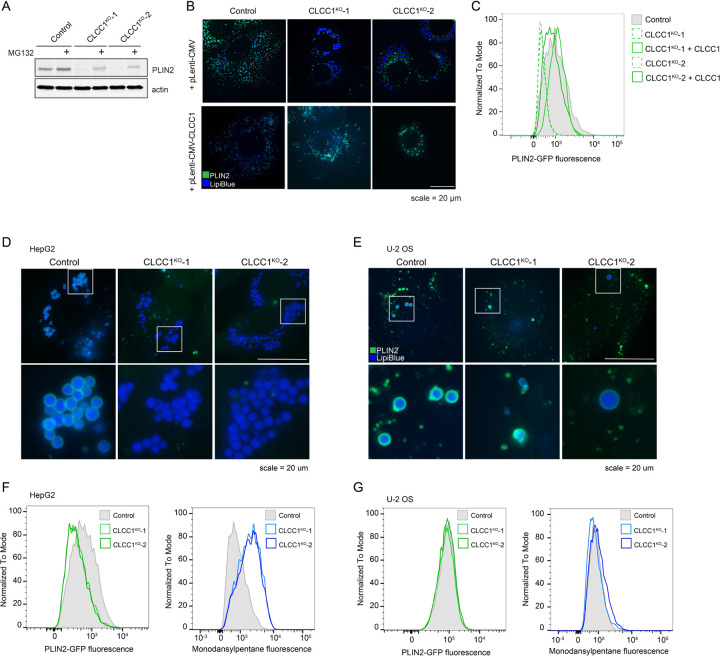
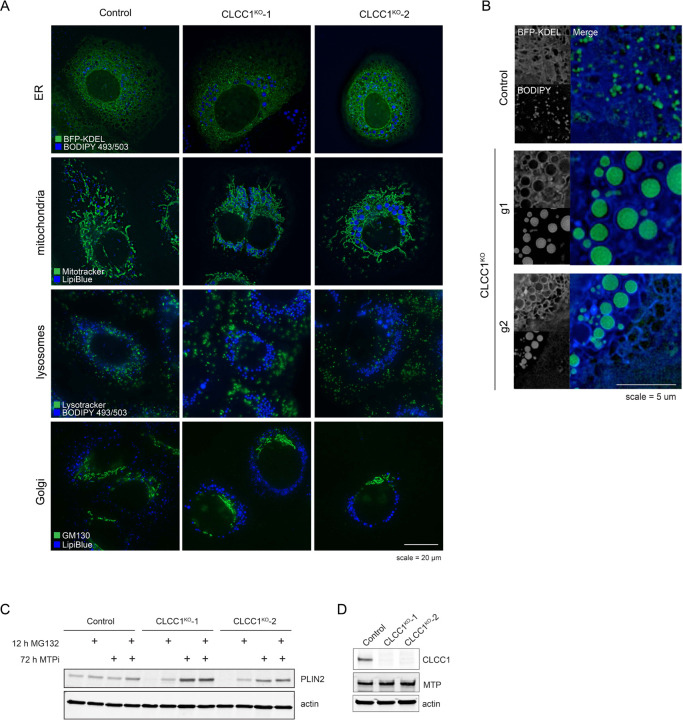
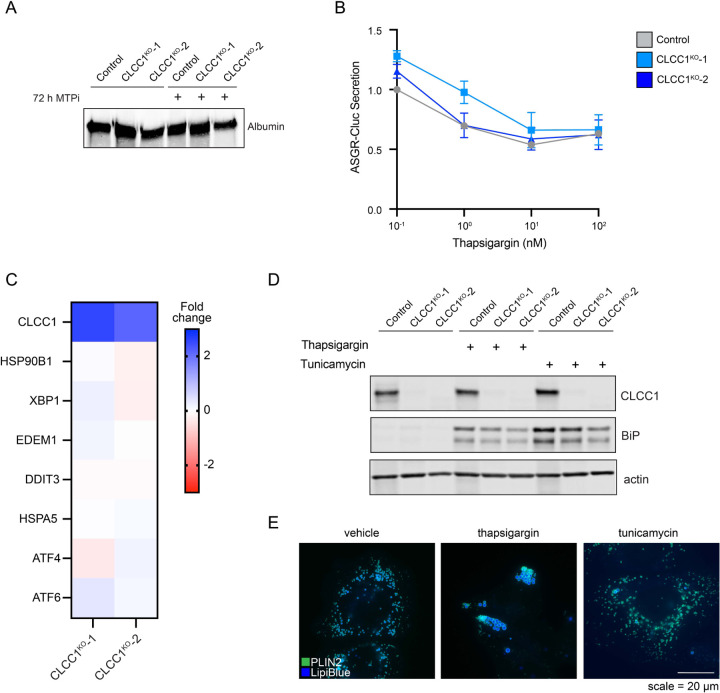
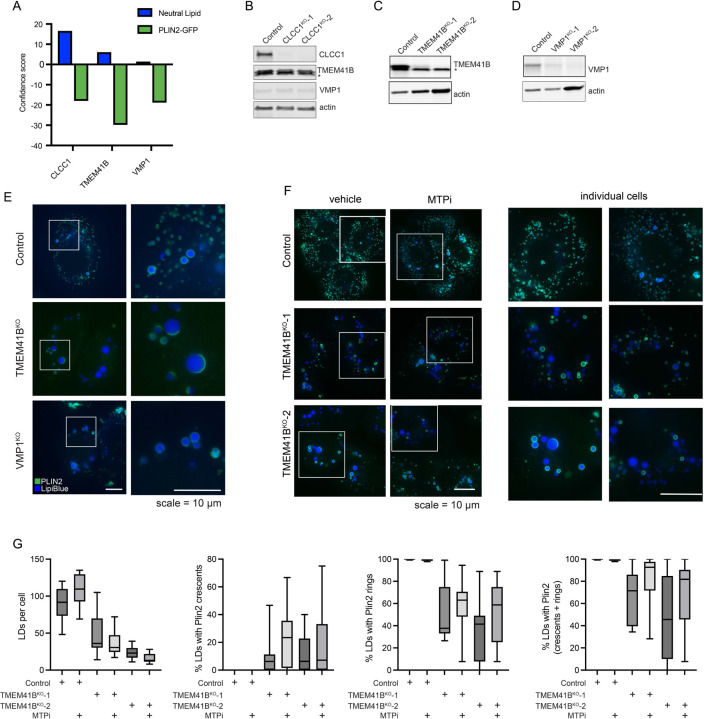
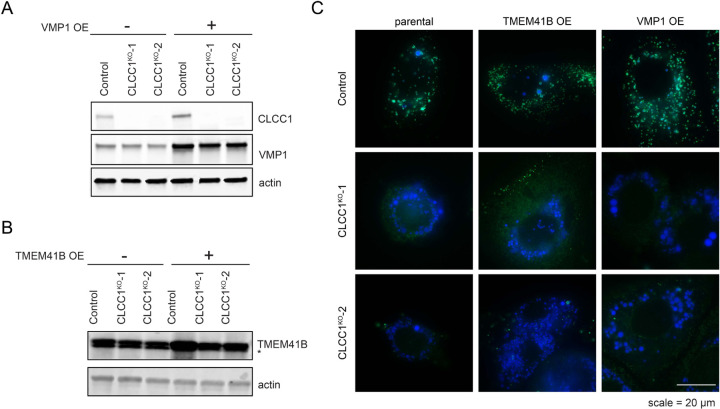
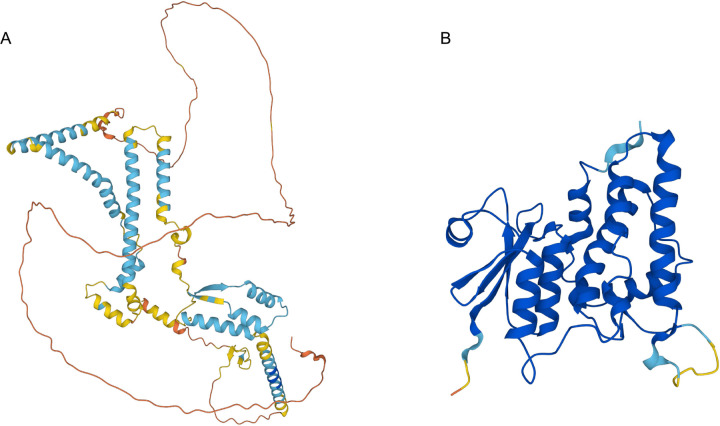
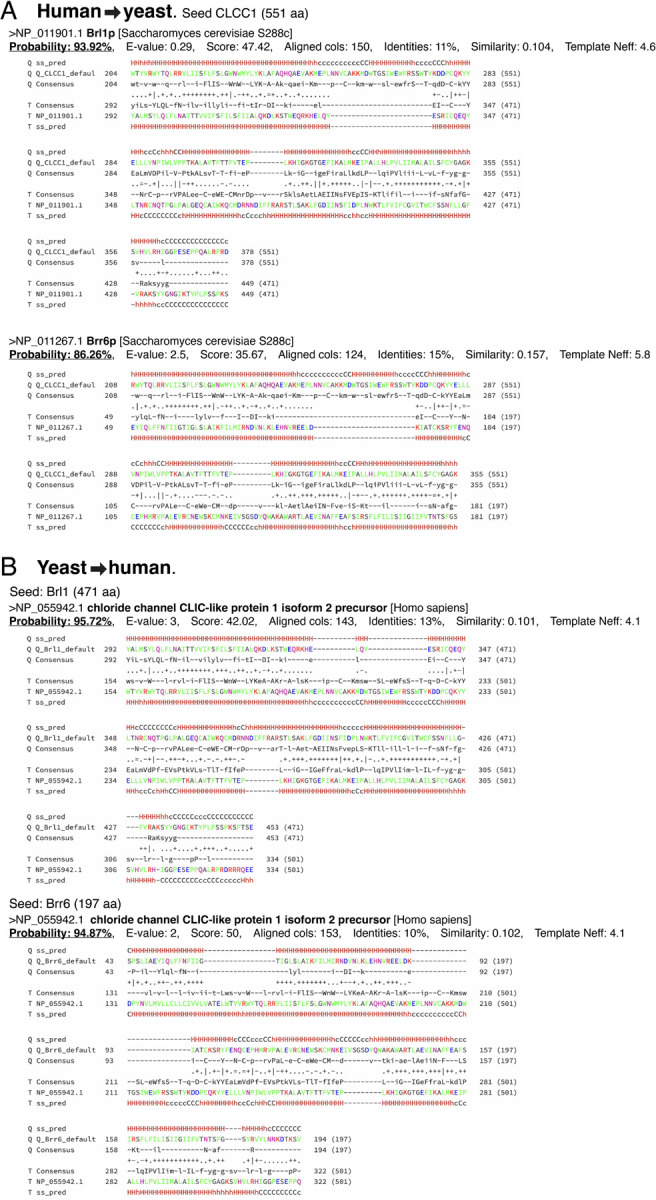
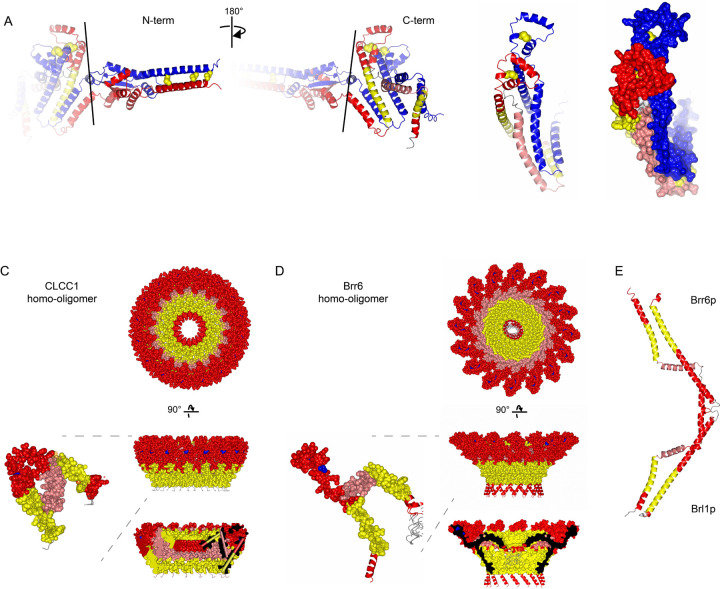
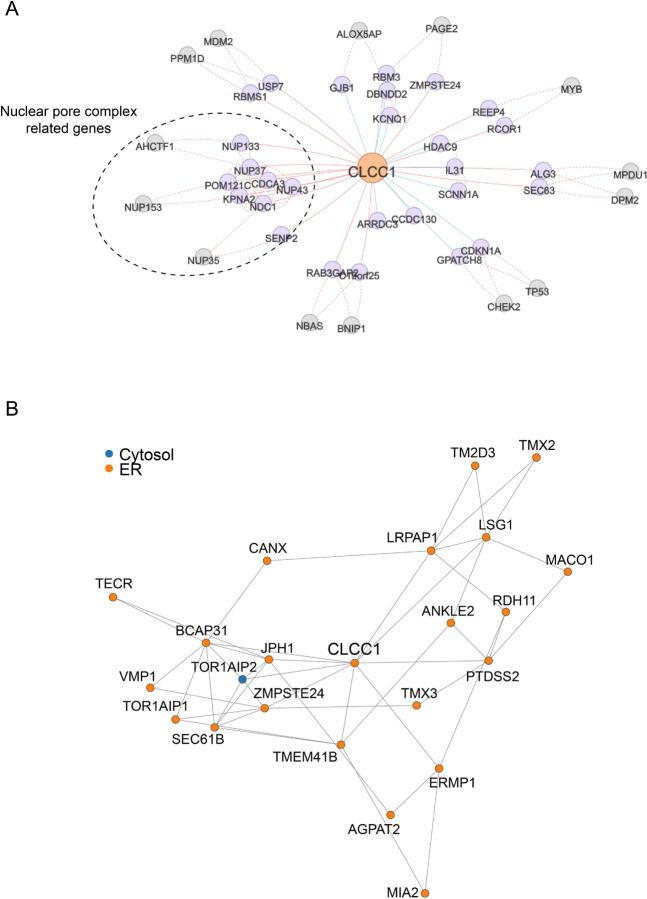
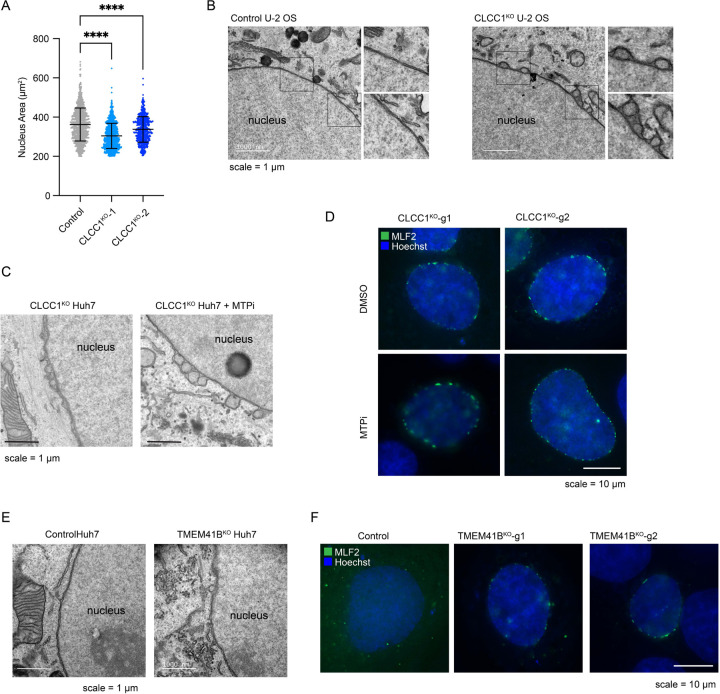
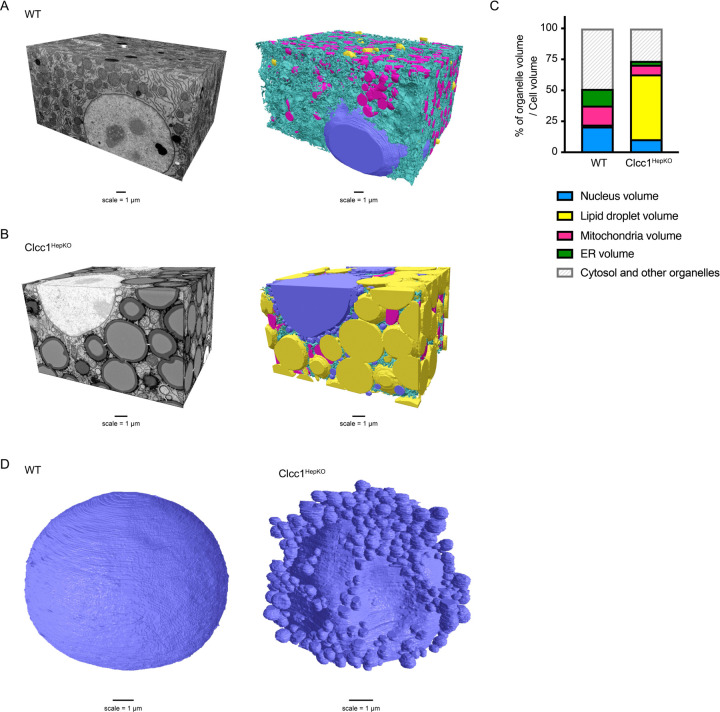
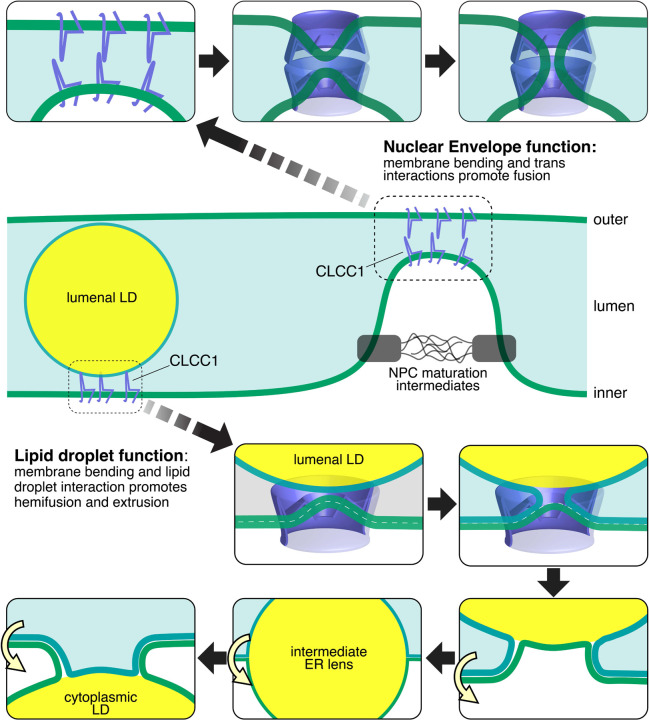
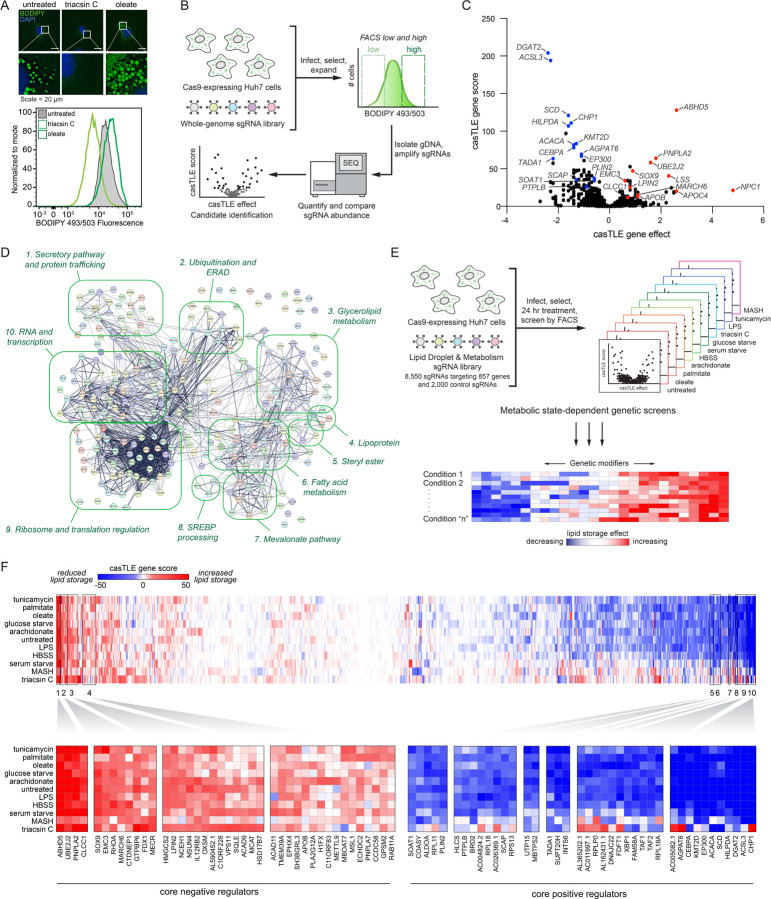
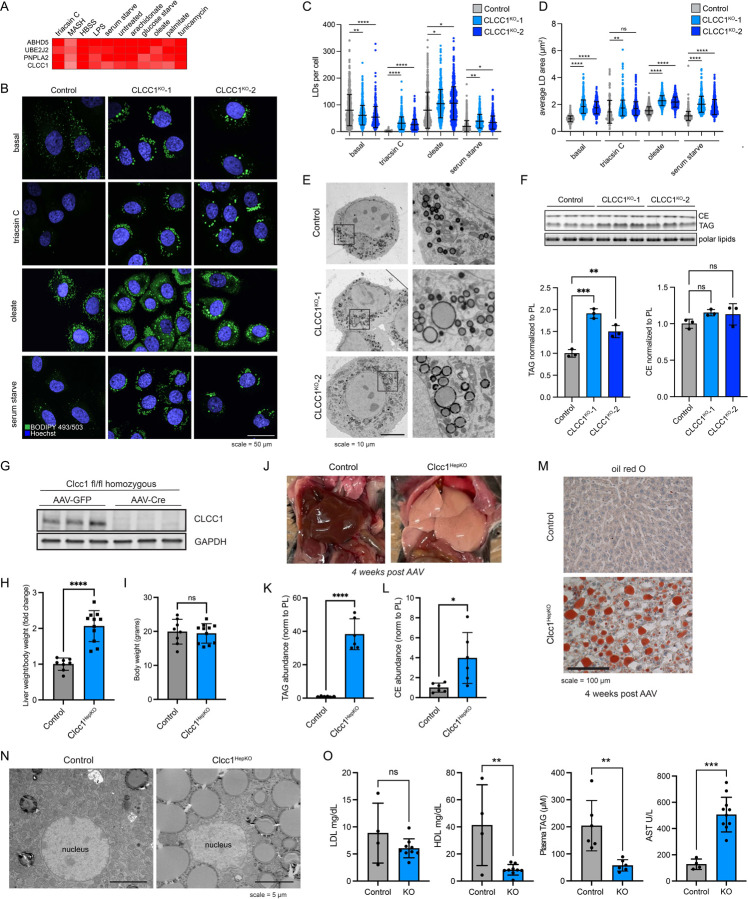
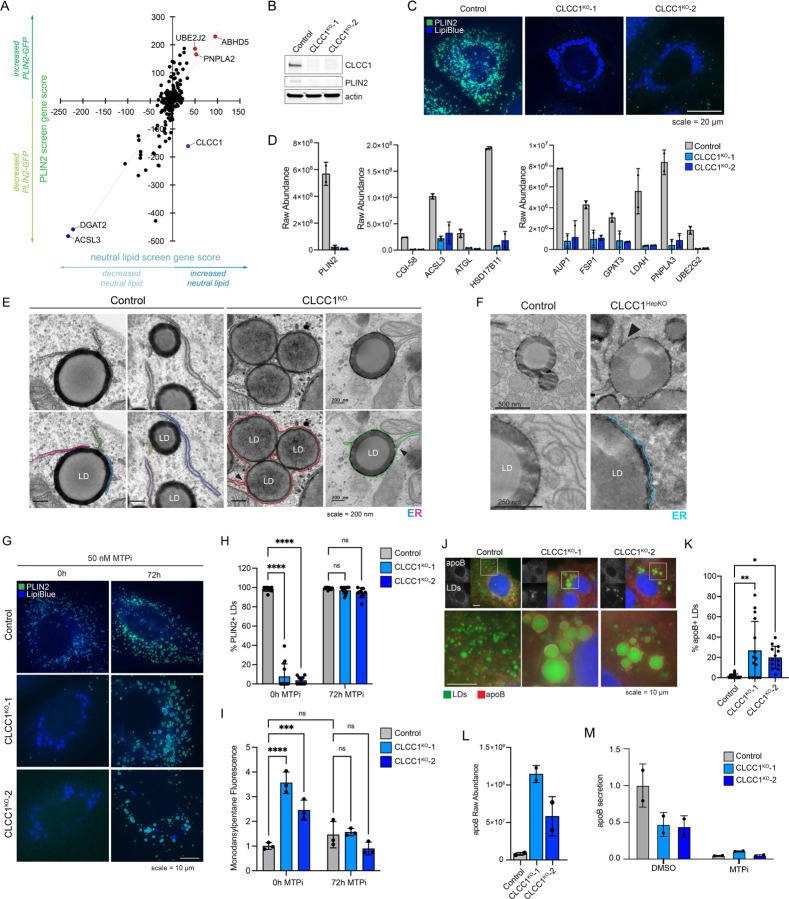
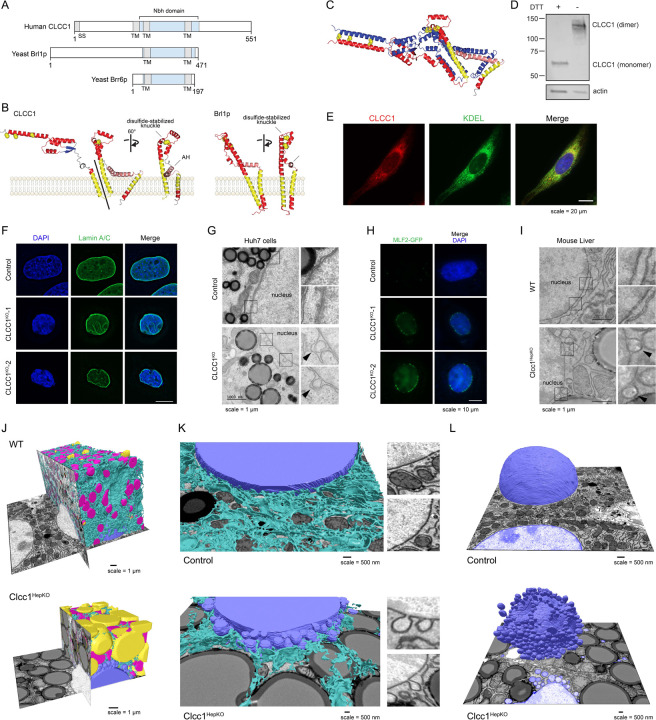
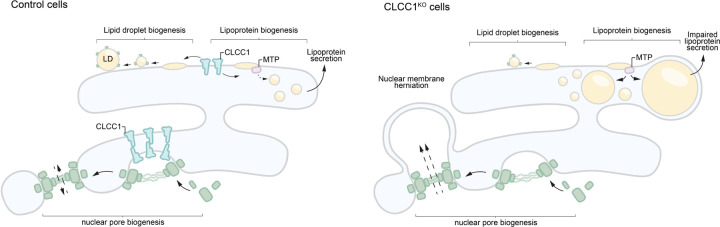
Imbalances in lipid storage and secretion lead to the accumulation of hepatocyte lipid droplets (LDs) (i.e., hepatic steatosis). Our understanding of the mechanisms that govern the channeling of hepatocyte neutral lipids towards cytosolic LDs or secreted lipoproteins remains incomplete. Here, we performed a series of CRISPR-Cas9 screens under different metabolic states to uncover mechanisms of hepatic neutral lipid flux. Clustering of chemical-genetic interactions identified CLIC-like chloride channel 1 (CLCC1) as a critical regulator of neutral lipid storage and secretion. Loss of CLCC1 resulted in the buildup of large LDs in hepatoma cells and knockout in mice caused liver steatosis. Remarkably, the LDs are in the lumen of the ER and exhibit properties of lipoproteins, indicating a profound shift in neutral lipid flux. Finally, remote homology searches identified a domain in CLCC1 that is homologous to yeast Brl1p and Brr6p, factors that promote the fusion of the inner and outer nuclear envelopes during nuclear pore complex assembly. Loss of CLCC1 lead to extensive nuclear membrane herniations, consistent with impaired nuclear pore complex assembly. Thus, we identify CLCC1 as the human Brl1p/Brr6p homolog and propose that CLCC1-mediated membrane remodeling promotes hepatic neutral lipid flux and nuclear pore complex assembly.


Conflict of interest statement

COMPETING INTERESTS J.A.O. is a member of the scientific advisory board for Vicinitas Therapeutics.

Figures

Extended Data Figure 1.
Extended Data Figure 1.. Analysis of lipid storage CRISPR-Cas9 screens.
A) Quantification of the amount of neutral lipid from flow cytometry histograms (representative histograms shown in Fig 1A). Data represent mean ± SD across three biological replicates. ****p<0.0001 by one-way ANOVA with Dunnett’s multiple comparisons test. B) Breakdown of the custom lipid metabolism CRISPR-Cas9 library used in batch retest screens. C) Pairwise comparison of gene scores between the genome-wide and batch retest screens. Scores were adjusted as positive or negative based upon the direction of gene effect. D) Significant gene clusters from Figure 1D. Nodes are marked based on directionality of effect (red or blue), gene effect size, and confidence score.
Extended Data Figure 2.
Extended Data Figure 2.. Enriched pathways and metabolic state-specific regulators of lipid storage.
A) Schematic of LD synthesis and breakdown pathways. Genes are annotated with heatmaps corresponding to the gene score across metabolic conditions. Metabolic states follow the order indicated in the legend. B-K) Selected examples of gene clusters exhibiting metabolic state specific effects on neutral lipid storage.
Extended Data Figure 3.
Extended Data Figure 3.. Genetic association of CLCC1 variants with altered serum lipids.
Common variant gene-level associations for CLCC1 from the Common Metabolic Diseases Knowledge Portal. The plot shows phenotypic associations for CLCC1 based upon genetic associations using Multi-marker Analysis of GenoMic Annotation (MAGMA).
Extended Data Figure 4.
Extended Data Figure 4.. Loss of CLCC1 results in the accumulation of neutral lipids.
A) Histogram indicating the distribution of control (null) sgRNAs. Shown below is the relative enrichment of CLCC1 targeting sgRNAs (red lines) under untreated, triacsin C, oleate, and serum starve conditions. The gray line indicates the mean of the control sgRNA distribution. B) Representative flow cytometry histograms of control and CLCC1KO Huh7 cells following treatment with 1 μg/mL triacsin C for 24 h, 100 μM oleate for 24 h, serum starve for 48 h, or basal levels. C) Representative TLC resolving esterified and free BODIPY C12 558/568 in Huh7 cells expressing a safe targeting sgRNA or sgRNAs against CLCC1. Cells were incubated with BODIPY C12 for the indicated times, followed by lipid extraction and TLC. A graph of the quantification of esterified BODIPY C12 levels is shown. BODIPY C12 levels at each time point were quantified relative to time 0 for each cell line. Data represent mean ± SD of three biological replicates. ****p<0.0001 by two-way ANOVA with Dunnett’s multiple comparisons test. D) Representative TLC resolving esterified BODIPY C12 558/568 in Huh7 cells expressing a safe targeting sgRNA or sgRNAs against CLCC1. Cells were incubated with BODIPY C12 for 16 h followed by triacsin C treatment for the indicated times, followed by lipid extraction and TLC. A graph of the quantification of esterified BODIPY C12 levels is shown. BODIPY C12 levels at each time point were quantified relative to time 0 for each cell line. Data represent mean ± SD of three biological replicates. ****p<0.0001 by two-way ANOVA with Dunnett’s multiple comparisons test. E) Quantification of ALT from clinical analyzer. Data represent mean ± SD of > four mice. ****p<0.0001 by one-way ANOVA with Dunnett’s multiple comparisons test.
Extended Data Figure 5.
Extended Data Figure 5.. Loss of CLCC1 results in the accumulation of PLIN2-negative lipid droplets.
A) Immunoblot of PLIN2-GFP levels in control and CLCC1KO cells treated with 1 μM MG132 for 12 h. B) Representative fluorescence microscopy images of PLIN2-GFP Huh7 cells, control and CLCC1KO cells, expressing a control plasmid or an untagged CLCC1 expression plasmid. LDs are stained with LipiBlue (blue). Scale bar represents 10 μm. C) Flow cytometry histograms of PLIN2-GFP fluorescence in control and CLCC1KO PLIN2-GFP Huh7 cells expressing a control plasmid (dashed) or an untagged CLCC1 expression plasmid (solid). D) Representative fluorescence microscopy images of PLIN2-GFP HepG2 cells expressing a safe targeting sgRNA (control) or sgRNAs against CLCC1. LDs were stained with 500 nM Lipi-Blue. Scale bar represents 20 μm. E) Representative fluorescence microscopy images of PLIN2-GFP U2-OS cells expressing a safe targeting sgRNA (control) or sgRNAs against CLCC1. LDs were stained with 500 nM Lipi-Blue. Scale bar represents 20 μm. F) Flow cytometry histograms of PLIN2 and neutral lipid levels (monodansylpentane fluorescence) in control and CLCC1KO HepG2 cells. G) Flow cytometry histograms of PLIN2 and neutral lipid levels (monodansylpentane fluorescence) in control and CLCC1KO HepG2 cells.
Extended Data Figure 6.
Extended Data Figure 6.. Analysis of organelle morphology in CLCC1 knockout cell lines.
A) Representative fluorescence microscopy images of mitochondria, lysosomes, Golgi, and LDs in CLCC1KO cells. Mitochondria was labeled with 500 nM mitotracker green, lysosomes were labeled with 75 nM lysotracker dnd-22, the Golgi apparatus was labeled with rabbit anti-GM130 antibody, and LDs were stained with either 500 nM Lipi-Blue or 1 μg/mL BODIPY 493/503. Scale bar represents 20 μm. B) Fluorescence imaging of ER and LDs in CLCC1KO cells. ER is labeled with a transiently transfected BFP-KDEL construct and LDs were stained with 1 μg/mL BODIPY 493/503. Scale bar represents 5 μm. C) Immunoblot of PLIN2-GFP levels in control and CLCC1KO cells treated with 1 μM MG132 for 12 h and/or 50 nM MTPi for 72 h. D) Immunoblot of MTP levels in control and CLCC1KO cells.
Extended Data Figure 7.
Extended Data Figure 7.. ER stress and general secretion are unchanged in CLCC1 knockout cell lines.
A) Immunoblot of albumin secretion from control and CLCC1KO cells. Conditioned serum-free media was collected and precipitated before immunoblotting. B) Quantification of ASGR-Cluc secretion in CLCC1KO cells across three biological replicates. C) Fold change of selected mRNA transcripts in CLCC1KO cells relative to control cells, measured using RNA sequencing. D) Immunoblot of BiP levels in control and CLCC1KO cells treated with 5 μg/mL tunicamycin or 1 μM thapsigargin for 24 h. E) Representative fluorescence microscopy images of PLIN2 (green) and LDs (blue) in Huh7 cells treated with ER stress inducers thapsigargin and tunicamycin. Scale bar represents 20 μm.
Extended Data Figure 8.
Extended Data Figure 8.. Analysis of ER scramblases and lumenal lipid droplets.
A) Confidence score for CLCC1, TMEM41B, and VMP1 from two genome wide CRISPR screens, the neutral lipid (i.e., BODIPY 493/503) screen in the current manuscript and a previous PLIN2-GFP screen. The sign, positive or negative, indicates the effect of gene depletion on neutral lipids or PLIN2-GFP levels. B) Immunoblot of the indicated proteins in control and CLCC1KO Huh7 cells. C) Immunoblot of TMEM41B in control and TMEM41BKO Huh7 cells. D) Immunoblot of VMP1 in control and VMP1KO Huh7 cells. E) Representative fluorescence microscopy images of PLIN2 (green) and LDs (blue) in control and TMEM41BKO and VMP1KO cells. Scale bar represents 10 μm. F) Representative fluorescence microscopy images of PLIN2 (green) and LDs (blue) in control and TMEM41BKO cells treated with MTP inhibitor (MTPi) for 72 h. Zoom images of the boxed regions are shown on the right. Scale bar represents 10 μm. G) Quantification of LDs and LD PLIN2 staining of control and TMEM41BKO cells incubated in the presence and absence of MTP inhibitor (MTPi) as in panel F.
Extended Data Figure 9.
Extended Data Figure 9.. Analysis of ER scramblases in CLCC1KO cells.
A) Immunoblot of VMP1 overexpression in control and CLCC1KO cells. B) Immunoblot of TMEM41B overexpression in control and CLCC1KO cells. C) Representative fluorescence microscopy images of PLIN2 (green) and LDs (blue) in control and CLCC1KO cells overexpression TMEM41B and VMP1, as indicated. Scale bar represents 20 μm.
Extended Data Figure 10.
Extended Data Figure 10.. Alphafold and multimer structural predictions.
A, B) Alphafold structural predictions of CLCC1 and CLIC1. Images colored by pLDDT (predicted local distance difference test), where blue indicates a confident prediction (light – high, dark – very high), while yellow/orange/red represent predictions of progressively low confidence.
Extended Data Figure 11.
Extended Data Figure 11.. Remote homology analysis linking CLCC1 with Brl1p and Brr6p.
HHpred remote homology searches using default settings: (A) in S. cerevisiae using human CLCC1 as the query protein; (B) in human using S. cerevisiae Brl1p or Brr6p as query proteins.
Extended Data Figure 12.
Extended Data Figure 12.. Structure homology analysis of CLCC1 with Brr6p and Brl1p.
A) Additional visualizations highlighting the N- and C-termini of the predicted disulfide-stabilized CLCC1 dimer structure Q96S66_V1_5 created by the Levy lab (downloaded from 3D-Beacons database). The two protomers are colored as in Fig 4C. B) Colabfold structural prediction of CLCC1 (205–360aa) homo-oligomer (16-subunits). Colors: yellow =TMH, pink = AH, red = other helix, blue spheres = conserved cysteines. C) Colabfold structural prediction of Brr6p (28–197aa) homo-oligomer (16-subunits). Colors as B. D) RoseTTAFold structural prediction of Brr6p/Brl1p heterodimer (38–197aa & 281–438). Colors as B.
Extended Data Figure 13.
Extended Data Figure 13.. Analyses of CLCC1 co-essentiality and localization neighborhood.
A) CLCC1 co-essentiality network using FIREWORKS interactive web tool to reveal gene-gene relationships. B) CLCC1 localization neighborhood using proteomic profiling data of affinity purified organelles.
Extended Data Figure 14.
Extended Data Figure 14.. Analysis of nuclear morphology and NE herniations.
A) Nuclei were visualized using DAPI fluorescence imaging and the area of the nucleus in control and CLCC1KO cells was quantified. B) Transmission EM of negative stained control and CLCC1KO U-2 OS cells. C) Transmission EM of negative stained CLCC1KO Huh7 cells treated in the presence and absence of MTP inhibitor (MTPi) for 72 h. D) Fluorescence imaging of MLF2-GFP (nuclear bleb marker) in CLCC1KO Huh7 cells treated in the presence and absence of MTP inhibitor (MTPi) for 72 h. E) Transmission EM of negative stained control and TMEM41BKO Huh7 cells. F) Fluorescence imaging of MLF2-GFP (nuclear bleb marker) in control and TMEM41BKO Huh7 cells.
Extended Data Figure 15.
Extended Data Figure 15.. Analysis of organelle architecture using FIB-SEM.
A,B) 3D reconstruction of FIB-SEM images and convolutional neural network based automated segmentation of liver volumes derived from liver volumes from WT (A) and Clcc1HepKO (B) mice. ER (Cyan), mitochondria (magenta), LDs (yellow), and nucleus (purple). C) Quantification of organelle volume as a percentage of cellular volume in FIB-SEM reconstructions (A,B) from WT and Clcc1HepKO mice. D) Reconstruction of segmented raw FIB-SEM data for nuclei (blue) from hepatocytes of WT and Clcc1HepKO mice.
Extended Data Figure 16.
Extended Data Figure 16.. Models of CLCC1 actions at the nuclear envelope and in the ER.
Our findings provide strong evidence for a role of CLCC1 in nuclear pore assembly and ER neutral lipid channeling in hepatocytes. Similar to Brl1p and Brr6p in yeast, we propose that CLCC1 acts at the membrane fusion step of nuclear pore complex assembly, which is essential for the insertion of nuclear pores during interphase. Following the insertion of nuclear pore subunits into the inner nuclear membrane, CLCC1 may be recruited to form homo-oligomeric rings that face each other on opposing membranes. Each CLCC1 ring is predicted to bend the membrane towards the other across the lumen, potentially facilitating membrane fusion and perforation. Oligomeric rings formed by Brl1p and its homologs would fulfil the same functions in yeast and organisms in all five eukaryote supergroups. Within the ER, similar structural features of CLCC1 or CLCC1 homo-oligomers promote correct ER neutral lipid flux. In the absence of CLCC1 there is an aberrant increase in neutral lipid flux towards the ER lumen. One possible model is that CLCC1 reduces lumenal LD accumulation by mediating membrane fusion between the inner leaflet of the ER and the lumenal LD. This fusion would form a membrane bridge, allowing neutral lipids to migrate from the lumenal LD into the ER membrane, and emerge in cytosolic LDs. ER scramblases such as TMEM41B could act at this step to ensure that there are sufficient phospholipids for cytosolic emergence. This could represent an LD salvage pathway to provide a homeostatic balance for maintenance of correct amounts of lumenal and cytosolic LDs.
Figure 1.
Figure 1.. Parallel CRISPR-Cas9 screens identify metabolic state-dependent genetic modifiers of lipid storage.
A) Top: Screen conditions were optimized in Huh7 cells treated for 24 h with 1 μg/mL triacsin C or 100 μM oleate and analyzed by fluorescence microscopy of cells labeled with BODIPY 493/503 (LDs) and DAPI (nuclei). Bottom: Flow cytometry BODIPY 493/503 fluorescence histograms of untreated, 1 μg/mL triacsin C- and 100 μM oleate-treated Huh7 cells. B) Schematic of FACS-based CRISPR-Cas9 screen approach to identify genes that regulate neutral lipid abundance, using BODIPY 493/503 as a neutral lipid reporter. C) Volcano plot indicating the gene effects (i.e., phenotype) and gene scores (i.e., confidence) for individual genes from batch retest screens in Huh7 cells. Gene effects and scores are calculated from two biological replicates. Positive (red) and negative (blue) genes of interest are highlighted. D) 265 of the 285 credible hits mapped in STRING confidence (text mining, experiments, physical interactions, genetic interactions, functional pathways) grouped manually by GO functional annotations. E) Schematic of parallel CRISPR screens under eleven different metabolic stress conditions. F) Heatmap of clustered genes based on gene score across all conditions. Boxes 1–4 indicate clusters of core positive regulators and boxes 5–10 indicate clusters of core negative regulators.
Figure 2.
Figure 2.. Loss of CLCC1 results in lipid droplet accumulation and hepatic steatosis.
A) Cluster of top negative regulators of lipid storage from metabolic state-dependent CRISPR-Cas9 screens. B) Representative confocal images of lipid droplets using BODIPY 493/503 in control (expressing safe targeting sgRNA) and CLCC1KO cells under basal conditions or following treatment with 1 μg/mL triacsin C for 24 h, 100 μM oleate for 24 h, or serum starve for 48 h. C) Quantification of the number of LDs from (C). Data represent mean ± SD of > 100 cells across three biological replicates. ****p<0.0001 by one-way ANOVA with Dunnett’s multiple comparisons test. D) Quantification of the area of LDs from (C). Data represent mean ± SD of > 100 cells across three biological replicates. ****p<0.0001 by one-way ANOVA with Dunnett’s multiple comparisons test. E) Representative transmission EM images of negative stained Huh7 cells expressing a safe targeting sgRNA (control) or sgRNAs against CLCC1. F) TLC resolving of TAG, CE, and polar lipids in Huh7 control and CLCC1KO cells. Quantification of TAG (left graph) and CE (right graph) bands normalized to phospholipids. Data represent mean ± SD of three biological replicates. ****p<0.0001 by one-way ANOVA with Dunnett’s multiple comparisons test. G) Immunoblot analysis of three Clcc1 fl/fl mice injected with either AAV-GFP (control) or AAV-Cre (Clcc1HepKO). Samples were analyzed four weeks post-injection. H) Fold change in liver weight normalized to body weight for control and Clcc1HepKO mice. n > 9. I) Body weight of the indicated control and Clcc1HepKO mice. n > 9. J) Representative images of livers of control and CLCC1HepKO m. K,L) Quantification of TAG (K) and CE (L) normalized to PL using TLC. Data represent mean ± SD of six mice. ****p<0.0001 by one-way ANOVA with Dunnett’s multiple comparisons test. M) Representative oil red O stained liver sections from control and Clcc1HepKO mice. N) Representative transmission EM images of negative stained control and Clcc1HepKO m. O) Quantification of AST, LDL and HDL from clinical analyzer. Data represent mean ± SD of > four mice. ****p<0.0001 by one-way ANOVA with Dunnett’s multiple comparisons test.
Figure 3.
Figure 3.. LDs in CLCC1KO cells are trapped within the ER lumen.
A) Pairwise comparison of the BODIPY 493/503 neutral lipid batch retest screen (Fig 1C and Supplementary Table 1) and a prior PLIN2-GFP batch retest screen. B) Immunoblot analysis of PLIN2 levels in control and CLCC1KO cells. C) Representative fluorescence microscopy images of PLIN2 and LDs in CLCC1KO cells. PLIN2 was labeled with rabbit anti-PLIN2 antibody (green) and LDs (blue) were stained with 500 nM Lipi-Blue. Scale bar represents 20 μm. D) Raw abundance values for selected known LD proteins from buoyant fraction proteomics across two technical replicates. E) Transmission EM of negative stained control and CLCC1KO cells. ER is highlighted in color and bifurcations, locations where the ER separates and a bilayer is found to encircle LDs, are denoted with black arrows. Scale bar represents 200 nm. F) Transmission EM of negative stained control and Clcc1HepKO mouse liver. ER is highlighted in color and bifurcations are denoted with black arrows (as in panel E). Scale bar represents 200 nm. G) Representative fluorescence microscopy images of cells treated with the MTP inhibitor 50 nM CP-346086 for 72 h. Cells were fixed, PLIN2 was labeled with rabbit anti-PLIN2 antibody (green), and LDs were stained with 500 nM Lipi-Blue (blue). Scale bar represents 10 μm. H) Quantification of PLIN2-positive LDs in (C) where n > 10 cells. I) Quantification of flow cytometry measuring neutral lipid storage by monodansylpentane (i.e., Autodot) fluorescence. J) Representative fluorescence microscopy images of control and CLCC1KO cells. ApoB was labeled with goat anti-apoB antibody (red) and LDs were stained with 500 nM Lipi-Blue (blue). Scale bar represents 10 μm. K) Quantification of the percentage of apoB-positive LDs in (H) where n > 10 cells. L) Raw abundance values for apoB from buoyant fraction proteomics across two technical replicates. M) Quantification of secreted apoB in medium using ELISA.
Figure 4.
Figure 4.. CLCC1 mediates membrane remodeling and is the human homolog of yeast Brl1p.
A) Domain structure of human CLCC1, yeast Brl1p, and yeast Brr6 indicating transmembrane domains (TM), signal sequence (SS), and the homologous ‘NPC-biogenesis “h”-shaped (Nbh) domain’ in blue. B) Human CLCC1 and yeast Brl1p homologous region alpha-fold structure. Ribbon colors: yellow =TMH, pink = AH, red = other helix; blue = sheet; yellow spheres = conserved cysteines. C) Predicted disulfide-stabilized CLCC1 dimer. Colors: one protomer as in B, one all blue. D) Western blot analysis of CLCC1 in the presence and absence of the reducing agent DTT. E) Fluorescence microscopy images of CLCC1 (red), the ER marker KDEL (green) and nuclei (DAPI, blue) in control and CLCC1KO cells. F) Representative fluorescence microscopy images of nuclei (DAPI, blue) and lamin A/C (green) in control and CLCC1KO cells. G) Transmission EM of negative stained control and CLCC1KO cells. Zoomed regions are included to highlight the NE ultrastructure. H) Representative fluorescence microscopy images of the NE herniation marker MFL2-GFP (green) and DAPI-stained nuclei (blue). Scale bar represents 20 μm. I) Transmission EM of negative stained control and Clcc1HepKO mouse liver. Zoomed regions are included to highlight the NE ultrastructure. J,K) Partial (J,K) reconstruction of segmented raw FIB-SEM data with ER (cyan), mitochondria (magenta), nuclei (blue) and LDs (yellow) from hepatocytes of WT (above) and Clcc1HepKO (below) mice. Insets in panel K show examples of nuclear membrane in the WT and Clcc1HepKO mice. L) Partial reconstruction of segmented raw FIB-SEM data with nuclei (blue), from hepatocytes of WT (above) and Clcc1HepKO (below) mice.
Figure 5.
Figure 5.. CLCC1 mediates membrane remodeling and is the human homolog of yeast Brl1p.
Model depicting the cellular functions of CLCC1 and the impact of CLCC1 depletion. CLCC1 is an ER and NE multi-pass transmembrane protein that promotes nuclear pore complex assembly and is required for the fusion of the inner and outer NE membranes. In the absence of CLCC1, nuclear pore complex assembly is impaired and large nuclear membrane herniations (i.e., blebs) accumulate. CLCC1 also regulates neutral lipid flux between cytoplasmic LDs and lumenal lipoproteins. CLCC1KO cells exhibit reduced neutral lipid channeling into cytoplasmic LDs and instead neutral lipid are channeled into enlarged MTP-dependent lipoproteins that build up in the ER lumen and fail to be properly secreted. (Also see Extended Data Fig 16)

Similar articles

References

    1. Mathiowetz A. J. & Olzmann J. A. Lipid droplets and cellular lipid flux. Nat Cell Biol 26, 331–345 (2024). - PMC - PubMed
    1. Olzmann J. A. & Carvalho P. Dynamics and functions of lipid droplets. Nat Rev Mol Cell Biol 20, 137–155 (2019). - PMC - PubMed
    1. Piccolis M. et al. Probing the global cellular responses to lipotoxicity caused by saturated fatty acids. Mol Cell 74, 32–44.e8 (2019). - PMC - PubMed
    1. Dierge E. et al. Peroxidation of n-3 and n-6 polyunsaturated fatty acids in the acidic tumor environment leads to ferroptosis-mediated anticancer effects. Cell Metab 33, 1701–1715.e5 (2021). - PubMed
    1. Danielli M., Perne L., Jarc Jovičić E. & Petan T. Lipid droplets and polyunsaturated fatty acid trafficking: Balancing life and death. Front. Cell Dev. Biol. 11, 1104725 (2023). - PMC - PubMed

Publication types