[Preprint]. 2024 Jun 6:2024.06.04.597443.
doi: 10.1101/2024.06.04.597443.

Human TSC2 Mutant Cells Exhibit Aberrations in Early Neurodevelopment Accompanied by Changes in the DNA Methylome

Affiliations

Human TSC2 Mutant Cells Exhibit Aberrations in Early Neurodevelopment Accompanied by Changes in the DNA Methylome

Mary-Bronwen L Chalkley et al. bioRxiv. .

Abstract

Tuberous Sclerosis Complex (TSC) is a debilitating developmental disorder characterized by a variety of clinical manifestations. While benign tumors in the heart, lungs, kidney, and brain are all hallmarks of the disease, the most severe symptoms of TSC are often neurological, including seizures, autism, psychiatric disorders, and intellectual disabilities. TSC is caused by loss of function mutations in the TSC1 or TSC2 genes and consequent dysregulation of signaling via mechanistic Target of Rapamycin Complex 1 (mTORC1). While TSC neurological phenotypes are well-documented, it is not yet known how early in neural development TSC1/2-mutant cells diverge from the typical developmental trajectory. Another outstanding question is the contribution of homozygous-mutant cells to disease phenotypes and whether such phenotypes are also seen in the heterozygous-mutant populations that comprise the vast majority of cells in patients. Using TSC patient-derived isogenic induced pluripotent stem cells (iPSCs) with defined genetic changes, we observed aberrant early neurodevelopment in vitro, including misexpression of key proteins associated with lineage commitment and premature electrical activity. These alterations in differentiation were coincident with hundreds of differentially methylated DNA regions, including loci associated with key genes in neurodevelopment. Collectively, these data suggest that mutation or loss of TSC2 affects gene regulation and expression at earlier timepoints than previously appreciated, with implications for whether and how prenatal treatment should be pursued.


Figures
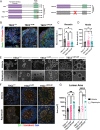
Figure 1:
Figure 1:. Neural Progenitor marker vimentin is decreased, and neural rosette lumens are enlarged, in TSC2 mutant day 9 organoids.
(a) Cartoon depicting the genotypes of the cell lines used in this study. (b) Representative immunofluorescence maximum intensity images of day 9 organoids showing expression of nestin (green), TBR1 (orange), vimentin (red) and Hoechst (blue) to identify neural progenitor cells. Scale bars = 50 µm. (c) Quantification of mean intensity (A.U.) of vimentin. N = 10 organoids across multiple differentiations. +/+ vs. +/LOF * p = 0.0203, +/+ vs. LOF/LOF * p = 0.0229, genotype ** p = 0.0015 [ANOVA, mixed effects]. Error bars = mean with SD. (d) Quantification of mean intensity (A.U.) of nestin. N = 10 organoids across multiple differentiations. No significance [ANOVA, mixed effects]. Error bars = mean with SD. (e) Representative phase DIC microscopy images of day 1 and day 9 organoids treated with vehicle or rapamycin. Scale bar = 200 µm. (f) Representative immunofluorescence maximum intensity images of day 9 organoids treated with vehicle or rapamycin showing expression of ZO-1 (green), CDK5RAP2 (red) and Hoechst (blue) to identify neural rosette lumens. Scale bars = 50 µm. (g) Quantification of area (µm2) of day 9 organoids treated with vehicle or rapamycin. N = 25 organoids across multiple differentiations. Vehicle +/+ vs. LOF/LOF ** p = 0.0057, Vehicle +/LOF vs. LOF/LOF * p = 0.0156, Rapamycin +/+ vs LOF/LOF **** p = <0.0001, Rapamycin +/LOF vs LOF/LOF *** p = 0.0002, genotype **** p = <0.0001 [two way ANOVA]. Log 10 scale. Error bars = mean with SD.
Figure 2:
Figure 2:. TSC2 homozygous mutants have increased abundance of β-III-tubulin / PAX6 co-positive cells.
(a) Representative immunofluorescence maximum intensity images of day 10 monolayer neural cultures showing expression of β-III-tubulin (green), PAX6 (orange), and Hoechst (blue) to identify neural progenitor cells and neurons. β-III-tubulin and PAX6 single channel greyscale images. Scale bars = 100 µm. (b) Quantification of percentage of β-III-tubulin positive soma. N = 3 independent differentiations. Genotype ** p= 0.0025, TSC2 +/+ vs TSC2 +/LOF ** p = 0.0030, TSC2 +/+ vs TSC2 LOF/LOF ** p = 0.0064 [one-way ANOVA with Tukey’s multiple comparisons test]. Error bars = mean with SD. (c) Quantification of percentage of PAX6 positive nuclei. N = 3 independent differentiations. Genotype ** p = 0.0014, TSC2 +/+ vs TSC2 +/LOF ** p = 0.0013, TSC2 +/+ vs TSC2 LOF/LOF ** p = 0.0087 [one-way ANOVA with Tukey’s multiple comparisons test]. Error bars = mean with SD. (d) Representative immunofluorescence images of day 10 monolayer neural cultures showing expression of β-III-tubulin (green), PAX6 (orange), and Hoechst (blue) to showing a cell co-expressing β-III-tubulin and PAX6. i) maximum intensity image. ii) single image of z-slice. Scale bars = 10 µm. (e) Quantification of percentage of β-III-tubulin positive soma that are co-positive with PAX6. N = 3 independent differentiations. Genotype * p = 0.0270, TSC2 +/+ vs TSC2 +/LOF * p = 0.0263 [one way ANOVA with Tukey’s multiple comparisons test]. Error bars = mean with SD.
Figure 3:
Figure 3:. TSC2 mutant neural cells show premature electrical activity.
(a) Cartoon showing experimental set up. Arrow represents day MEA recording was done. Color represents media used. (b) Quantification of number of spikes over time. N = 22 wells over 3 independent differentiations. TSC2 +/+ vs TSC2 +/LOF * p = 0.0148, TSC2 +/LOF vs TSC2 LOF/LOF * p = 0.0488, genotype ** p = 0.0083 [one way ANOVA with Tukey’s multiple comparisons test]. Error bars = mean with SD. (c) Quantification of mean firing rate over time. N = 22 wells over 3 independent differentiations. TSC2 +/+ vs TSC2 +/LOF * p = 0.0146, TSC2 +/LOF vs TSC2 LOF/LOF * p = 0.0483, genotype ** p = 0.0081 [one way ANOVA with Tukey’s multiple comparisons test]. Error bars = mean with SD.
Figure 4:
Figure 4:. TSC2 mutant day 9 organoids have decreased DNMT1 intensity.
(a) Representative immunofluorescence maximum intensity images of day 9 neural organoid cultures showing expression of DNMT3a (green), DNMT1 (orange), and Hoechst (blue). DNMT3a and DNMT1 single channel greyscale images. Scale bars = 100 µm. (b) Quantification of mean intensity (A.U.) of DNMT3a in day 9 organoids. N = 10 organoids across multiple differentiations. No significance [ANOVA, mixed effects]. Error bars = mean with SD. (c) Quantification of mean intensity (A.U.) of DNMT1 in day 9 organoids. N = 10 organoids across multiple differentiations. TSC2 +/+ vs TSC2 LOF/LOF * p = 0.0403 [one way ANOVA, Bartlett’s]. Error bars = mean with SD.
Figure 5:
Figure 5:. DNA methylation changes with TSC2 genotype.
(a) Heatmap of K-means clustering using scale by row feature, input regions were consensus HMR list from all merged samples. Blue indicates hypomethylated and red indicates hypermethylated on scale. (b) Violin plots of average methylation of K-means clustering in a. (c) Gene ontology dot blot from K-means clustering. The n is as follows: iPSCs HMR cluster CC=33932, MF=4110, BP=4003; NPCs HMR cluster CC=1568, MF=1537, BP=1528; TSC2 +/+ HMR cluster CC=0, MF=477, BP=462; TSC2 LOF/LOF HMR cluster CC=816, MF=0, BP=0. (d) Heatmap of motif enrichment for select top most significant motifs from each sample from K-means clustering. Each row is scaled to show the relative enrichment by z-score for the percent fold. (e) Stacked bar plots showing proportion of cluster HMRs that are differentially methylated per cluster. Light blue indicates total HMRs in each cluster, dark blue indicates intersected DMR and HMR. (f) Genomic tracks showing methylation level per CpG with a darker bar indicating higher methylation.
Figure 6:
Figure 6:. Differentially expressed genes correlate with differentially methylated regions in TSC2 mutant NPCs.
(a) Principal component analysis (PCA) of RNA sequencing day 10 NPC samples. (b) Volcano plot of differentially transcribed genes in TSC2 +/+ and TSC2 LOF/LOF. Black dots are genes that are not significant for either fold change or adjusted p-value. Red dots are significantly upregulated in TSC2 +/+ by both fold change and adjusted p-value. Blue dots are significantly upregulated in TSC2 LOF/LOF by both fold change and adjusted p-value. (c) Sankey diagram showing correlation of differentially expressed genes (DEGs) to hypomethylated regions (HMR) and differentially methylated regions (DMR). (d) List of differentially expressed genes (DEGs) associated with differentially methylated regions (DMRs).

Similar articles

References

    1. Crino P.B., Nathanson K.L., and Henske E.P., The tuberous sclerosis complex. N Engl J Med, 2006. 355(13): p. 1345–56. - PubMed
    1. Ess K.C., Tuberous sclerosis complex: a brave new world? Curr Opin Neurol, 2010. 23(2): p. 189–93. - PMC - PubMed
    1. Nabbout R., et al. Epilepsy in tuberous sclerosis complex: Findings from the TOSCA Study. Epilepsia Open, 2019. 4(1): p. 73–84. - PMC - PubMed
    1. Chu-Shore C.J., et al. The natural history of epilepsy in tuberous sclerosis complex. Epilepsia, 2010. 51(7): p. 1236–41. - PMC - PubMed
    1. Cardamone M., et al. Mammalian target of rapamycin inhibitors for intractable epilepsy and subependymal giant cell astrocytomas in tuberous sclerosis complex. J Pediatr, 2014. 164(5): p. 1195–200. - PubMed

Publication types