. 2024 May 31;16(11):2103.
doi: 10.3390/cancers16112103.

Standardized Digital Image Analysis of PD-L1 Expression in Head and Neck Squamous Cell Carcinoma Reveals Intra- and Inter-Sample Heterogeneity with Therapeutic Implications

Affiliations

Standardized Digital Image Analysis of PD-L1 Expression in Head and Neck Squamous Cell Carcinoma Reveals Intra- and Inter-Sample Heterogeneity with Therapeutic Implications

Eric Deuss et al. Cancers (Basel). .

Abstract

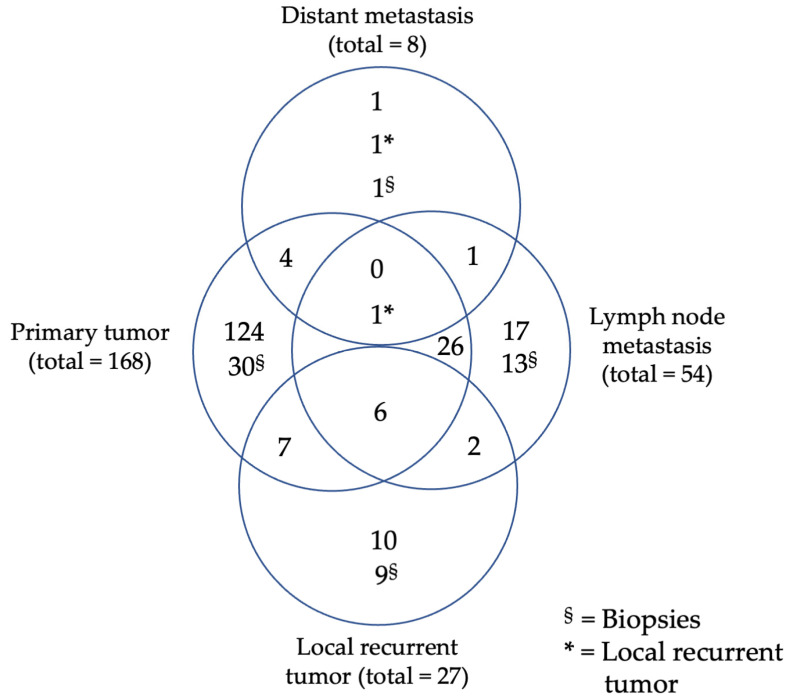
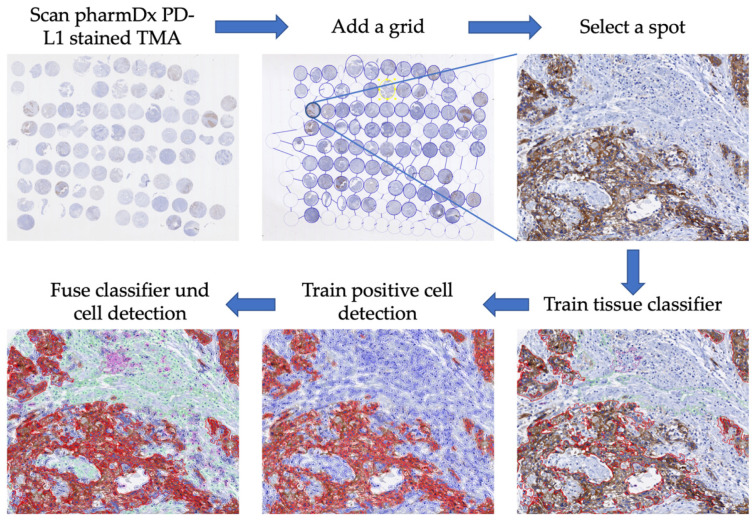
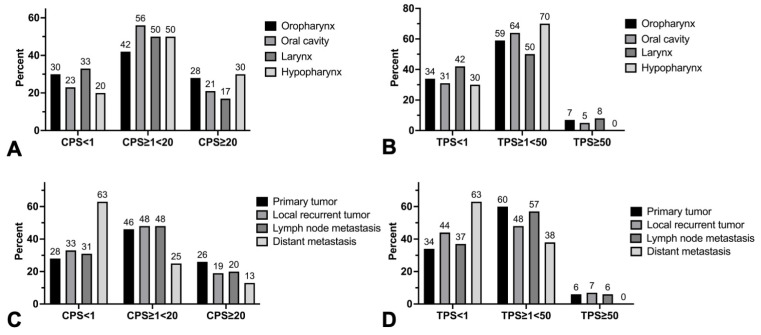
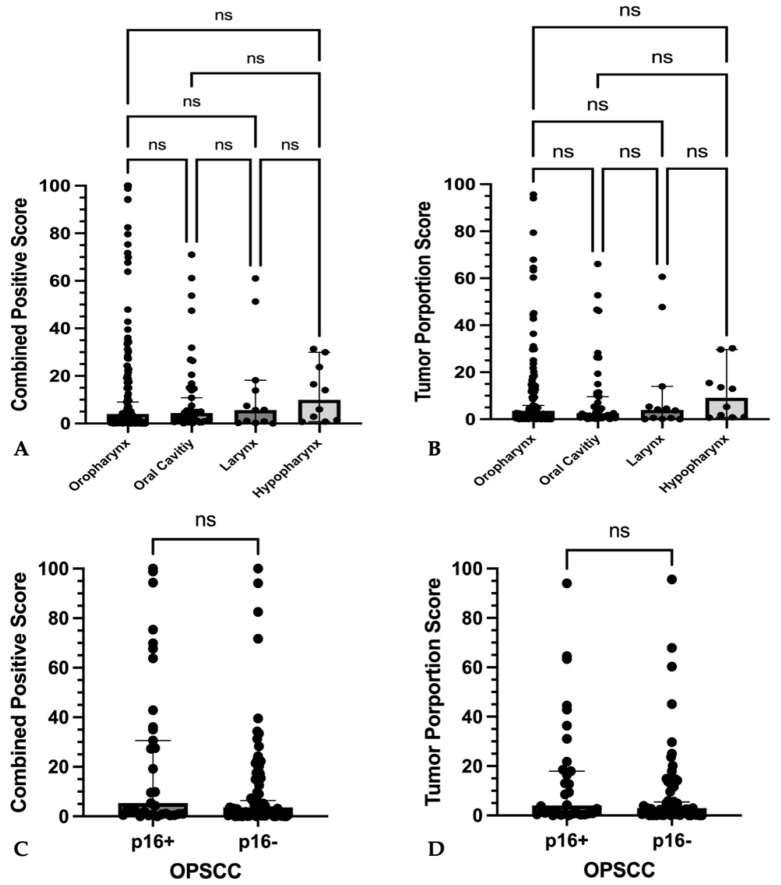
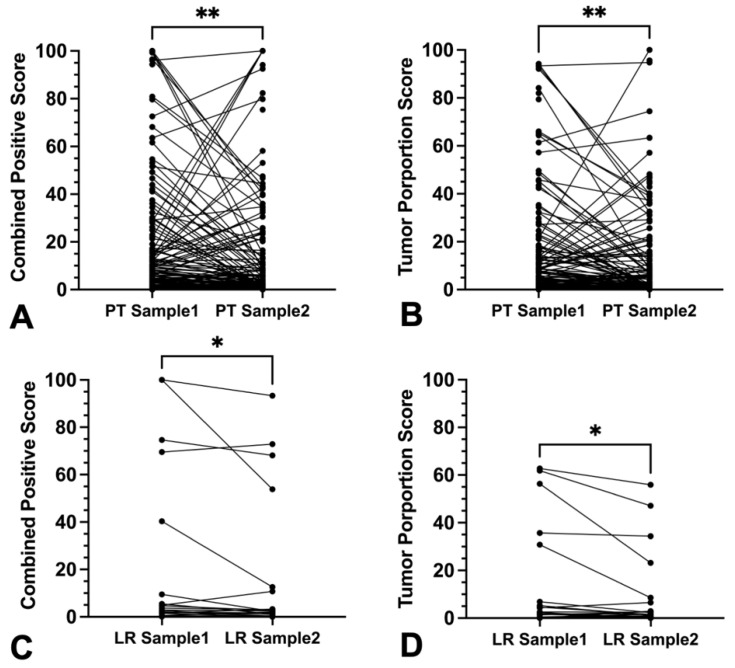
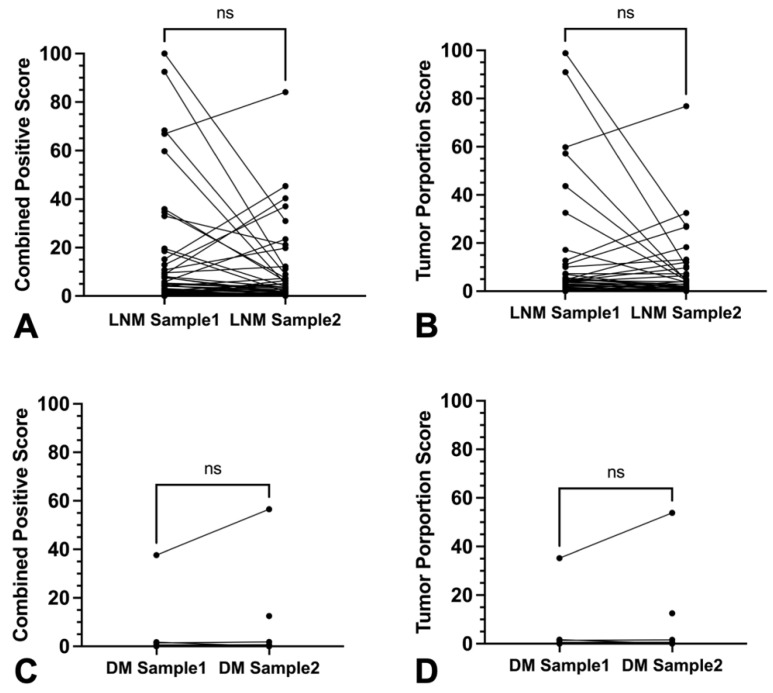
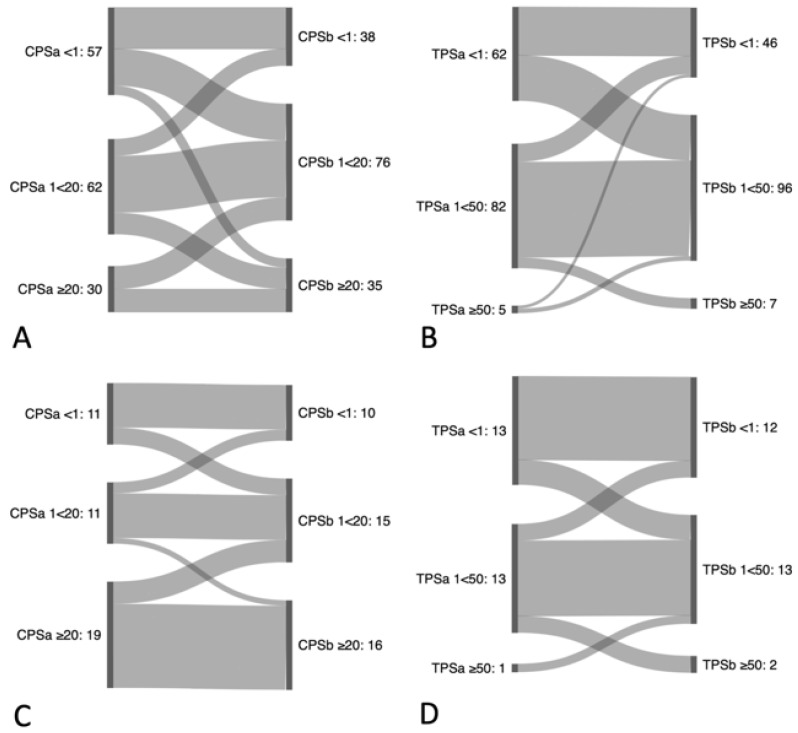
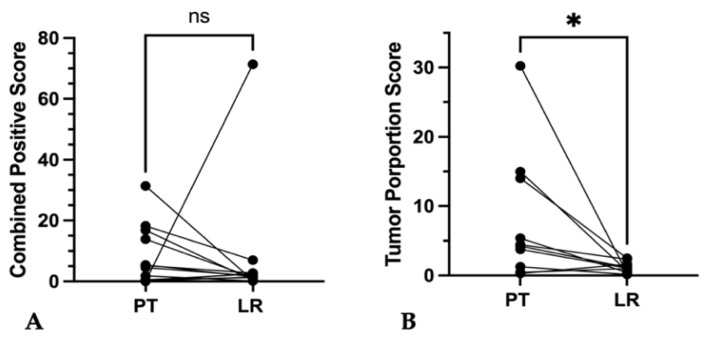
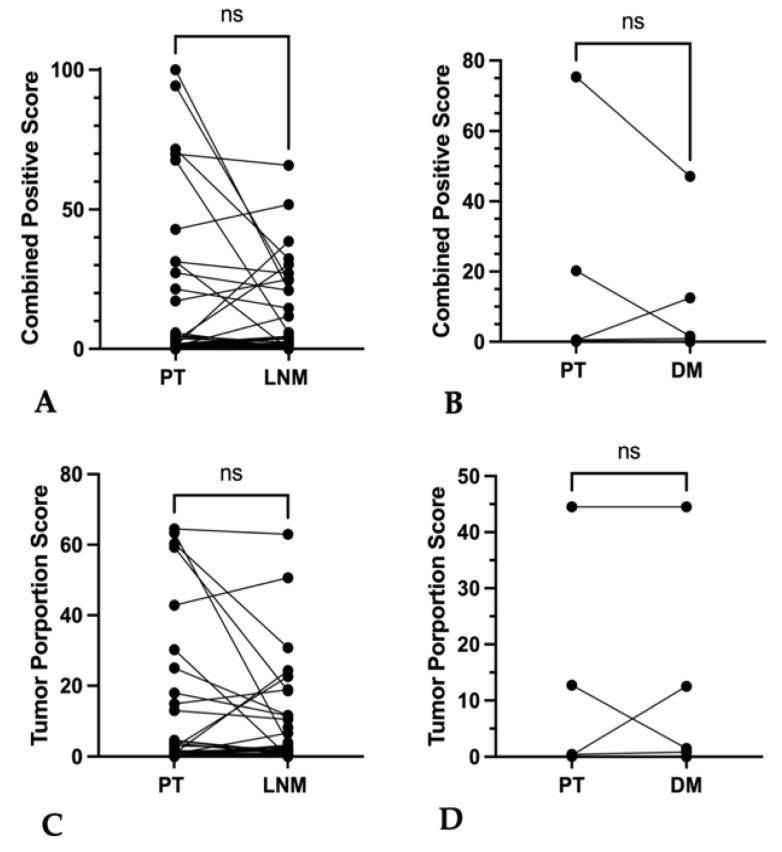
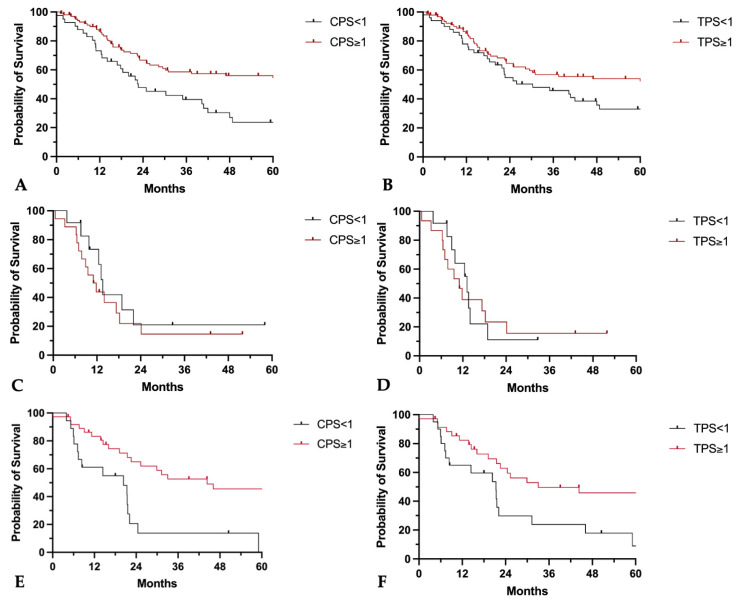
For practical reasons, in many studies PD-L1 expression is measured by combined positive score (CPS) from a single tumor sample. This does not reflect the heterogeneity of PD-L1 expression in head and neck squamous cell carcinoma (HNSCC). We investigated the extent and relevance of PD-L1 expression heterogeneity in HNSCC analyzing primary tumors and recurrences (LRs), as well as metastases. Tumor tissue from 200 HNSCC patients was immunohistochemically stained for PD-L1 and analyzed using image-analysis software QuPath v3.4 with multiple specimens per patient. CPS was ≥20 in 25.6% of primary tumors. Intra-tumoral heterogeneity led to a therapeutically relevant underestimation of PD-L1 expression in 28.7% of patients, when only one specimen per patient was analyzed. Inter-tumoral differences in PD-L1 expression between primary tumors and lymph node metastasis (LNM) or LR occurred in 44.4% and 61.5% (CPS) and in 40.6% and 50% of cases (TPS). Overall survival was increased in patients with CPS ≥ 1 vs. CPS < 1 in primary tumors and LNM (hazard ratio: 0.46 and 0.35; p < 0.005); CPS in LR was not prognostic. Our analysis shows clinically relevant intra- and inter-sample heterogeneity of PD-L1 expression in HNSCC. To account for heterogeneity and improve patient selection for immunotherapy, multiple sample analyses should be performed, particularly in patients with CPS/TPS < 1.

Keywords: HPV; biomarker; combined positivity score (CPS); head and neck squamous cell carcinoma (HNSCC); heterogeneity; oropharyngeal squamous cell carcinoma (OPSCC); p16; prognosis; programmed cell death 1 Ligand 1 (PD-L1); tumor proportion score (TPS).


Conflict of interest statement

The authors declare no conflicts of interest.

Figures

Figure 1
Figure 1
Study population, Venn diagram of specimen distribution out of primary tumors, local recurrent tumors, lymph node or distant metastasis.
Figure 2
Figure 2
Procedure for the automated analysis of PD-L1 expression using QuPath v3.4; 1. Scanning of immunohistochemical tissue micro array PD-L1 22C3 pharmDx staining; 2. Importing picture into QuPath and adding a tissue micro array grid; 3. Selecting and focusing on spots; 4. Training tissue classifier (immune cells, stroma, tumor); 5. Training positive cell detection; 6. Fusing results of tissue classifier and positive cell detecting.
Figure 3
Figure 3
(AC) Immunohistochemical PD-L1 staining with 22C3 pharmDx anti-human PD-L1 antibody; (A) no PD-L1 expression; (B) moderate intra-tumoral PD-L1 expression; (C) strong intra-tumoral PD-L1 expression.
Figure 4
Figure 4
Frequencies of CPS categories in head and neck squamous cell primary tumors and metastasis of different locations (AD) Frequency distributions of tricategorical combined positive score (CPS) (<1, ≥1<20, ≥20) and tumor proportion score (TPS) (<1, ≥1<50, ≥50) in percent for (A,B) tumor sites in head and neck squamous cell cancer and (C,D) different kinds of tumors (primary tumor/local recurrent tumor/lymph node or distant metastasis). No statistically significant differences were found in frequencies of CPS and TPS categories among different tumor sites and kind of tumors.
Figure 5
Figure 5
PD-L1 expression among different locations and differences to p16-expression (AD) Graphs show single plotted values with median and 95% confidence interval as whiskers. No significant differences in (A) combined positive score or (B) tumor proportions score between primary tumors of different location could be found. No significant differences of (C) combined positive score and (D) tumor proportion score between p16-positive or p16-negative oropharyngeal squamous cell carcinoma could be found. No statistically significant differences (ns) were found among absolute CPS and TPS values as well as p16-positive and p16-negative OPSCC.
Figure 6
Figure 6
Discordance of CPS and TPS in separate punches from the same primary tumor or local recurrent tumor specimen. (A,B) Plotted values of PD-L1 expression in primary tumor (PT) tissue samples and of (C,D) local recurrent tumors (LR) (A,B) showed significant differences of combined positive score and tumor proportions score ((A) ** p < 0.01; (B) ** p ≤ 0.01); (C,D) showed significant differences of combined positive score and tumor proportions score ((C) * p < 0.05; (D) * p ≤ 0.05).
Figure 7
Figure 7
Discordance of CPS and TPS in separate punches from the same lymph node or distant metastases specimen (AD). (A,B) Plotted values of PD-L1 expression in lymph node metastases (LNM) tissue samples and of (C,D) distant metastases (DM). (AD) showed no significant differences of combined positive score and tumor proportions score ((AD) ns p > 0.05).
Figure 8
Figure 8
Reclassification of CPS and TPS based on analysis of multiple samples. Sankey diagram of (A) combined positive score (CPS) categories (<1; ≥1<20; ≥20) and (B) of tumor proportion score (TPS) categories (<1%; ≥1%<50%; ≥50%) between two different intra-tumoral biopsies of primary tumors, as well as (C) of CPS (<1; ≥1<20; ≥20) and (D) of TPS (<1%; ≥1%<50%; ≥50%) between two different intra-tumoral biopsies of local recurrent tumors.
Figure 9
Figure 9
Inter-tumoral discordance of CPS and TPS between primary tumor and local recurrent tumor of the same patients. (A,B) Graphs show changes in (A) combined positive score (CPS) (ns p > 0.05) and (B) tumor proportion score (TPS) (* p = 0.01) of local recurrent tumors (LRs) compared to paired primary tumors (PTs).
Figure 10
Figure 10
Inter-tumoral discordance of CPS and TPS between primary tumor and lymph node or distant metastases of the same patients. (A,B) Graphs show CPS in paired specimen of (A) primary tumor (PT) and lymph node metastases (LNMs); (B) primary tumor (PT) and distant metastases (DMs) without statistically significant differences (ns p > 0.05); (C,D) Graphs show TPS in paired specimen of (C) primary tumor (PT) and lymph node metastases (LNMs); (D) primary tumor (PT) and distant metastases (DMs) without statistically significant differences (ns p > 0.05).
Figure 11
Figure 11
Prognostic implications of CPS and TPS on patients’ overall survival. (AD) Kaplan–Meier curves of five-year overall survival probability in (A,B) primary tumors, (C,D) local recurrent tumors, and (E,F) lymph node metastases separated for (A,C,E) CPS < 1 or ≥1 and for (B,D,F) TPS < 1 or ≥1.

Similar articles

References

    1. Bray F., Ferlay J., Soerjomataram I., Siegel R.L., Torre L.A., Jemal A. Global cancer statistics 2018: GLOBOCAN estimates of incidence and mortality worldwide for 36 cancers in 185 countries. CA Cancer J. Clin. 2018;68:394–424. doi: 10.3322/caac.21492. - DOI - PubMed
    1. Sung H., Ferlay J., Siegel R.L., Laversanne M., Soerjomataram I., Jemal A., Bray F. Global Cancer Statistics 2020: GLOBOCAN Estimates of Incidence and Mortality Worldwide for 36 Cancers in 185 Countries. CA Cancer J. Clin. 2021;71:209–249. doi: 10.3322/caac.21660. - DOI - PubMed
    1. Lacas B., Carmel A., Landais C., Wong S.J., Licitra L., Tobias J.S., Burtness B., Ghi M.G., Cohen E.E.W., Grau C., et al. Meta-analysis of chemotherapy in head and neck cancer (MACH-NC): An update on 107 randomized trials and 19,805 patients, on behalf of MACH-NC Group. Radiother. Oncol. 2021;156:281–293. doi: 10.1016/j.radonc.2021.01.013. - DOI - PMC - PubMed
    1. Pignon J.P., le Maître A., Maillard E., Bourhis J. Meta-analysis of chemotherapy in head and neck cancer (MACH-NC): An update on 93 randomised trials and 17,346 patients. Radiother. Oncol. 2009;92:4–14. doi: 10.1016/j.radonc.2009.04.014. - DOI - PubMed
    1. Lechner M., Liu J., Masterson L., Fenton T.R. HPV-associated oropharyngeal cancer: Epidemiology, molecular biology and clinical management. Nat. Rev. Clin. Oncol. 2022;19:306–327. doi: 10.1038/s41571-022-00603-7. - DOI - PMC - PubMed

Grants and funding

This research received no external funding.