. 2024 May 29;16(11):1683.
doi: 10.3390/nu16111683.

Atractylodes macrocephala Koidz Alleviates Symptoms in Zymosan-Induced Irritable Bowel Syndrome Mouse Model through TRPV1, NaV1.5, and NaV1.7 Channel Modulation

Affiliations

Atractylodes macrocephala Koidz Alleviates Symptoms in Zymosan-Induced Irritable Bowel Syndrome Mouse Model through TRPV1, NaV1.5, and NaV1.7 Channel Modulation

Na-Ri Choi et al. Nutrients. .

Abstract

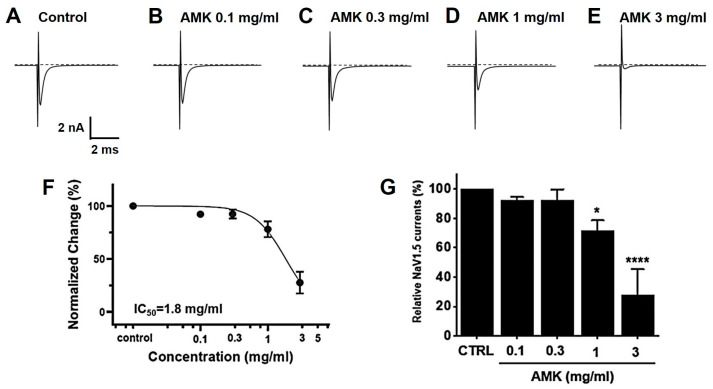
(1) Background: Irritable bowel syndrome (IBS) is a common disease in the gastrointestinal (GI) tract. Atractylodes macrocephala Koidz (AMK) is known as one of the traditional medicines that shows a good efficacy in the GI tract. (2) Methods: We investigated the effect of AMK in a network pharmacology and zymosan-induced IBS animal model. In addition, we performed electrophysiological experiments to confirm the regulatory mechanisms related to IBS. (3) Results: Various characteristics of AMK were investigated using TCMSP data and various analysis systems. AMK restored the macroscopic changes and weight to normal. Colonic mucosa and inflammatory factors were reduced. These effects were similar to those of amitriptyline and sulfasalazine. In addition, transient receptor potential (TRP) V1, voltage-gated Na+ (NaV) 1.5, and NaV1.7 channels were inhibited. (4) Conclusion: These results suggest that AMK may be a promising therapeutic candidate for IBS management through the regulation of ion channels.

Keywords: gastrointestinal disease; ion channel; quality of life; traditional medicine; visceral hypersensitivity.


Conflict of interest statement

The authors declare no conflicts of interest.

Figures

Figure 1
Figure 1
Animal experiment timeline. (A) Timeline for colonic changes. (B) Timeline for Body weight, Food intake and Histology. (C) Timeline for Pain behavior. According to the presented schedule, mice were subjected to various treatments including PBS, AMK extract (250 or 500 mg/kg), AMT (30 mg/kg), and SSZ (30 mg/kg).
Figure 2
Figure 2
Interactions between active compounds from AMK and GI disease-related compounds.
Figure 3
Figure 3
The network of IBS-related genes and AMK targeting genes.
Figure 4
Figure 4
Relevance of AMK compounds and IBS-related genes.
Figure 5
Figure 5
Effects of AMK extract on gut macroscopic changes, body weight, and food intake. Macroscopic evaluations were investigated in (A) colon length, (B) colon weight, and (C) stool score. Examined alterations in (D) body weight and assessed (E) food intake. The results are represented as mean ± SE. # p < 0.05, ## p < 0.01 and ### p < 0.001 denote statistical significance compared to naïve, while * p < 0.05, ** p < 0.01, and *** p < 0.001 indicate statistical significance relative to the control. CTRL: Control.
Figure 6
Figure 6
Effects of AMK extract on tissue changes and TNF-α expression levels. H&E staining reveals (A) histological changes and (B) quantitative results of colon mucosa thickness in diverse treatment groups at a 50× magnification. TNF-α expression on days (C) 4 and (D) 12 was quantified using RT-qPCR analysis. Mean ± SE. # p < 0.05, ### p < 0.001 and #### p < 0.0001 denote statistical significance in comparison to the naïve, while * p < 0.05, ** p < 0.01, *** p < 0.001, and **** p < 0.0001 indicate statistical significance relative to the control. CTRL: Control.
Figure 7
Figure 7
Effects of AMK extract on visceral pain-related behaviors. Pain-related behaviors were checked on days (A) 4 and (B) 11. The results are represented as mean ± SE. ## p < 0.01 denotes statistical significance in comparison to the naïve, while * p < 0.05 and ** p < 0.01 indicate statistical significance relative to the control. CTRL: Control.
Figure 8
Figure 8
Effects of AMK extract on TRPV1 currents. (A) (a) Representative trace for TRPV1 showing the effect of 100, 200, and 500 μg/mL AMK extract. TRPV1 was overexpressed in HEK293T cells. (b) I–V representative curve showing the effect of 100, 200, and 500 μg/mL AMK extract. (B) Statistical analysis of normalized fold changes. After inward ITRPV1 establishment using capsaicin, relative ITRPV1 using 100, 200, and 500 μg/mL AMK extract and the inhibitor BCTC are shown (at +100 mV). The results are represented as mean ± SE. *** p < 0.001 and **** p < 0.0001 indicate statistical significance relative to the naïve group. AMK: Atractylodes macrocephala Koidz.
Figure 9
Figure 9
Effects of AMK extract on TRPV4 currents. (A) (a) Representative trace for TRPV4 showing the effect of 100, 200, and 500 μg/mL AMK extract. TRPV4 was overexpressed in HEK293T cells. (b) I–V representative curve showing the effect of 100, 200, and 500 μg/mL AMK extract. (B) Statistical analysis. After inward ITRPV4 establishment using GSK101A, relative ITRPV4 using 100, 200, and 500 μg/mL AMK extract and the inhibitor RR are shown (at +100 mV). The results are represented as mean ± SE. **** p < 0.0001 indicates statistical significance relative to the naïve.
Figure 10
Figure 10
Effects of AMK extract on TRPA1 currents. (A) (a) Representative trace for TRPA1 showing the effect of 100, 200, and 500 μg/mL AMK extract. (b) I–V representative curve showing the effect of 100, 200, and 500 μg/mL AMK extract. (B) Statistical analysis. After inward ITRPA1 establishment using AITC, relative ITRPA1 using 100, 200, and 500 μg/mL AMK extract and the inhibitor A967079 are shown (at +100 mV). The results are represented as mean ± SE. **** p < 0.0001 indicates statistical significance relative to the naïve.
Figure 11
Figure 11
Effects of AMK extract on NaV1.5 currents. (A) Representative plot showing the NaV1.5 currents in HEK293T cells. (B) Representative plot showing the effects of 0.1 mg/mL AMK extract. (C) Representative plot showing the effects of 0.3 mg/mL AMK extract. (D) Representative plot showing the effects of 1 mg/mL AMK extract. (E) Representative plot showing the effects of 3 mg/mL AMK extract. (F) Inhibition of NaV1.5 by AMK extract. (G) Statistical analysis. IC50 = 1.8 mg/mL. The results are represented as mean ± SE. * p < 0.05 and **** p < 0.0001 indicate statistical significance relative to the control group. CTRL: Control.
Figure 12
Figure 12
Effects of AMK extract on NaV1.7 currents. (A) Representative plot showing the NaV1.7 currents in HEK293T cells. (B) Representative plot showing the effects of 0.1 mg/mL AMK extract. (C) Representative plot showing the effects of 0.3 mg/mL AMK extract. (D) Representative plot showing the effects of 1 mg/mL AMK extract. (E) Representative plot showing the effects of 3 mg/mL AMK extract. (F) Inhibition of NaV1.7 by AMK extract. (G) Statistical analysis. IC50 = 1.3 mg/mL. The results are represented as mean ± SE. *** p < 0.001 and **** p < 0.0001 indicate statistical significance relative to the control group. CTRL: Control.

Similar articles

References

    1. Zhu B., Zhang Q.L., Hua J.W., Cheng W.L., Qin L.P. The traditional uses, phytochemistry, and pharmacology of Atractylodes macrocephala Koidz.: A review. J. Ethnopharmacol. 2018;226:143–167. doi: 10.1016/j.jep.2018.08.023. - DOI - PubMed
    1. Song H.P., Li R.L., Chen X., Wang Y.Y., Cai J.Z., Liu J., Chen W.W. Atractylodes macrocephala Koidz promotes intestinal epithelial restitution via the polyamine—Voltage-gated K+ channel pathway. J. Ethnopharmacol. 2014;152:163–172. doi: 10.1016/j.jep.2013.12.049. - DOI - PubMed
    1. Song H.P., Li R.L., Zhou C., Cai X., Huang H.Y. Atractylodes macrocephala Koidz stimulates intestinal epithelial cell migration through a polyamine dependent mechanism. J. Ethnopharmacol. 2015;159:23–35. doi: 10.1016/j.jep.2014.10.059. - DOI - PubMed
    1. Wang R., Zhou G., Wang M., Peng Y., Li X. The Metabolism of Polysaccharide from Atractylodes macrocephala Koidz and Its Effect on Intestinal Microflora. Evid. Based Complement. Altern. Med. 2014;2014:926381. doi: 10.1155/2014/926381. - DOI - PMC - PubMed
    1. Wang Z., Li R.L., Xu S.F., Chen W.W. Effects of Atractylodes macrocephala monosaccharide composition on cytodifferentiation and villin expression of IEC-6 cells in vitro. J. Chin. Med. Mater. 2010;33:938–944. - PubMed

LinkOut - more resources