Myelin Oligodendrocyte Glycoprotein (MOG)35-55 Mannan Conjugate Induces Human T-Cell Tolerance and Can Be Used as a Personalized Therapy for Multiple Sclerosis
- PMID: 38892275
- PMCID: PMC11172913
- DOI: 10.3390/ijms25116092
Myelin Oligodendrocyte Glycoprotein (MOG)35-55 Mannan Conjugate Induces Human T-Cell Tolerance and Can Be Used as a Personalized Therapy for Multiple Sclerosis
Abstract
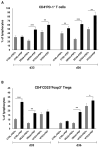
We have previously performed preclinical studies with the oxidized mannan-conjugated peptide MOG35-55 (OM-MOG35-55) in vivo (EAE mouse model) and in vitro (human peripheral blood) and demonstrated that OM-MOG35-55 suppresses antigen-specific T cell responses associated with autoimmune demyelination. Based on these results, we developed different types of dendritic cells (DCs) from the peripheral blood monocytes of patients with multiple sclerosis (MS) or healthy controls presenting OM-MOG35-55 or MOG-35-55 to autologous T cells to investigate the tolerogenic potential of OM-MOG35-55 for its possible use in MS therapy. To this end, monocytes were differentiated into different DC types in the presence of IL-4+GM-CSF ± dexamethasone (DEXA) ± vitamin D3 (VITD3). At the end of their differentiation, the DCs were loaded with peptides and co-cultured with T cells +IL-2 for 4 antigen presentation cycles. The phenotypes of the DC and T cell populations were analyzed using flow cytometry and the secreted cytokines using flow cytometry or ELISA. On day 8, the monocytes had converted into DCs expressing the typical markers of mature or immature phenotypes. Co-culture of T cells with all DC types for 4 antigen presentation cycles resulted in an increase in memory CD4+ T cells compared to memory CD8+ T cells and a suppressive shift in secreted cytokines, mainly due to increased TGF-β1 levels. The best tolerogenic effect was obtained when patient CD4+ T cells were co-cultured with VITD3-DCs presenting OM-MOG35-55, resulting in the highest levels of CD4+PD-1+ T cells and CD4+CD25+Foxp3+ Τ cells. In conclusion, the tolerance induction protocols presented in this work demonstrate that OM-MOG35-55 could form the basis for the development of personalized therapeutic vaccines or immunomodulatory treatments for MS.
Keywords: MOG35–55; cytokines; dendritic cells; human; immunomodulation; mannan; peptides; regulatory T cells; vitamin D.
Conflict of interest statement
The authors declare that they have no conflicts of interest.
Figures


Similar articles
-
Mannan-conjugated myelin peptides prime non-pathogenic Th1 and Th17 cells and ameliorate experimental autoimmune encephalomyelitis.Exp Neurol. 2015 May;267:254-67. doi: 10.1016/j.expneurol.2014.10.019. Epub 2014 Oct 30. Exp Neurol. 2015. PMID: 25447934
-
A GMCSF-Neuroantigen Tolerogenic Vaccine Elicits Systemic Lymphocytosis of CD4+ CD25high FOXP3+ Regulatory T Cells in Myelin-Specific TCR Transgenic Mice Contingent Upon Low-Efficiency T Cell Antigen Receptor Recognition.Front Immunol. 2019 Jan 10;9:3119. doi: 10.3389/fimmu.2018.03119. eCollection 2018. Front Immunol. 2019. PMID: 30687323 Free PMC article.
-
Galectin-1 is essential for the induction of MOG35-55 -based intravenous tolerance in experimental autoimmune encephalomyelitis.Eur J Immunol. 2016 Jul;46(7):1783-96. doi: 10.1002/eji.201546212. Epub 2016 May 25. Eur J Immunol. 2016. PMID: 27151444 Free PMC article.
-
Selective depletion of CD11c+ CD11b+ dendritic cells partially abrogates tolerogenic effects of intravenous MOG in murine EAE.Eur J Immunol. 2016 Oct;46(10):2454-2466. doi: 10.1002/eji.201546274. Eur J Immunol. 2016. PMID: 27338697 Free PMC article.
-
Novel Approaches in the Immunotherapy of Multiple Sclerosis: Cyclization of Myelin Epitope Peptides and Conjugation with Mannan.Brain Sci. 2021 Nov 29;11(12):1583. doi: 10.3390/brainsci11121583. Brain Sci. 2021. PMID: 34942885 Free PMC article. Review.
References
-
- Gakis G., Angelopoulos I., Panagoulias I., Mouzaki A. Current knowledge on multiple sclerosis pathophysiology, disability progression assessment and treatment options, and the role of autologous hematopoietic stem cell transplantation. Autoimmun. Rev. 2023;23:103480. doi: 10.1016/j.autrev.2023.103480. - DOI - PubMed
-
- Seil F.J. Advances in Clinical Immunology, Medical Microbiology, COVID-19, and Big Data 2021. Jenny Stanford Publishing; New York, NY, USA: 2021. Myelin Antigens and Antimyelin Antibodies. Chapter 5. - DOI
-
- Matsoukas J., Apostolopoulos V., Kalbacher H., Papini A.M., Tselios T., Chatzantoni K., Biagioli T., Lolli F., Deraos S., Papathanassopoulos P., et al. Design and synthesis of a novel potent myelin basic protein epitope 87–99 cyclic analogue: Enhanced stability and biological properties of mimics render them a potentially new class of immunomodulators. J. Med. Chem. 2005;48:1470–1480. doi: 10.1021/jm040849g. - DOI - PubMed
-
- Lourbopoulos A., Deraos G., Matsoukas M.T., Touloumi O., Giannakopoulou A., Kalbacher H., Grigoriadis N., Apostolopoulos V., Matsoukas J. Cyclic MOG35–55 ameliorates clinical and neuropathological features of experimental autoimmune encephalomyelitis. Bioorg. Med. Chem. 2017;25:4163–4174. doi: 10.1016/j.bmc.2017.06.005. - DOI - PubMed
-
- Lourbopoulos A., Matsoukas M.T., Katsara M., Deraos G., Giannakopoulou A., Lagoudaki R., Grigoriadis N., Matsoukas J., Apostolopoulos V. Cyclization of PLP139–151 peptide reduces its encephalitogenic potential in experimental autoimmune encephalomyelitis. Bioorg. Med. Chem. 2018;26:2221–2228. doi: 10.1016/j.bmc.2017.12.024. - DOI - PubMed
MeSH terms
Substances
Grants and funding
LinkOut - more resources
Full Text Sources
Medical
Research Materials

