. 2024 Jul 3;146(26):17964-17973.
doi: 10.1021/jacs.4c03916. Epub 2024 Jun 18.

Deconvoluting Monomer- and Dimer-Specific Distance Distributions between Spin Labels in a Monomer/Dimer Mixture Using T1-Edited DEER EPR Spectroscopy

Affiliations

Deconvoluting Monomer- and Dimer-Specific Distance Distributions between Spin Labels in a Monomer/Dimer Mixture Using T1-Edited DEER EPR Spectroscopy

Thomas Schmidt et al. J Am Chem Soc. .

Abstract

Double electron-electron resonance (DEER) EPR is a powerful tool in structural biology, providing distances between pairs of spin labels. When the sample consists of a mixture of oligomeric species (e.g., monomer and dimer), the question arises as to how to assign the peaks in the DEER-derived probability distance distribution to the individual species. Here, we propose incorporating an EPR longitudinal electron relaxation (T1) inversion recovery experiment within a DEER pulse sequence to resolve this problem. The apparent T1 between dipolar coupled electron spins measured from the inversion recovery time (τinv) dependence of the peak intensities in the T1-edited DEER-derived probability P(r) distance distribution will be affected by the number of nitroxide labels attached to the biomolecule of interest, for example, two for a monomer and four for a dimer. We show that global fitting of all the T1-edited DEER echo curves, recorded over a range of τinv values, permits the deconvolution of distances between spin labels originating from monomeric (longer T1) and dimeric (shorter T1) species. This is especially useful when the trapping of spin labels in different conformational states during freezing gives rise to complex P(r) distance distributions. The utility of this approach is demonstrated for two systems, the β1 adrenergic receptor and a construct of the huntingtin exon-1 protein fused to the immunoglobulin domain of protein G, both of which exist in a monomer-dimer equilibrium.


Conflict of interest statement

The authors declare no competing financial interest.

Figures
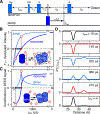
Figure 1.
Figure 1.
T1-Edited DEER. (A) Pulse sequence. τinv is the inversion recovery delay following the application of the initial π observer pulse; 2τ1 and 2τ2 are the first and second echo period durations, respectively; and tmax is the maximum acquisition time. All pulses are applied along x unless indicated. Phase cycling: ϕ=x,-x; receiver =x,-x. (B) Simulated τinv dependence of PMr,τinv and PDr,τinv (with both traces normalized from −1 to +1), for T1M=600μs and T1D=200μs. (C) Simulated τinv dependence of the fractional contribution of monomer and dimer to the DEER signal with pM=0.85 (see eqs 4–6). (D) Simulated P*r,τinv distribution as a function of τinv. (The integrated absolute intensity is set to 1 in each trace.) The corresponding simulated DEER echo curves are shown in Figure S2.
Figure 2.
Figure 2.
Schematic of the global fitting procedure used to simultaneously fit a series of T1-edited DEER echo curves obtained over a range of inversion recovery times τinv to a common set of Gaussians for monomer and dimer species. The superscripts M and D refer to the monomer and dimer, respectively. λ and α are the modulation depth and background decay exponent, respectively; fj are the fractional contributions of each Gaussian where j extends from 1 to (n-1) Gaussians (since the sum of all Gaussians adds up to 1); ri and σi are the mean distance and width (at half-maximum) of each Gaussian i, respectively. The other symbols are defined in eqs 1 and 2. P(r) pairwise distance distributions were obtained from the DEER echo curves using a sum of Gaussians to directly fit the experimental DEER data (including background correction with a best-fit exponential decay) using the program DD/GLADDvu., Global fitting entails fitting all DEER echo curves obtained over a range of τinv values simultaneously with a set of global parameters common to all the curves using the fitting routines from the program DD/GLADDvu, imported into a home-written Python program.,,
Figure 3.
Figure 3.
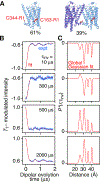
Quantitative global analysis of Q-band T1-edited DEER data obtained for β1AR(C163-R1/C344-R1) in the presence of cholate. (A) Ribbon diagrams of the crystal structure of the β1AR monomer (left) and a model of the β1AR dimer based on the crystal structure of the related β1AR dimer. The red balls indicate the location of the two nitroxide spin labels with C163-R1 trapped in three distinct states. (B) Experimental (blue) and calculated (red) T1-edited DEER echo curves at several τinv values. All the T1-edited DEER echo curves were fit globally to a sum of 4 Gaussians comprising three intrasubunit distances (that are the same in the monomer and dimer) and one intersubunit distance. (C) Corresponding P*r,τinv distributions. (The integrated absolute intensity is set to 1 in each trace.) The data were recorded at 50 K on 60μMβ1AR (reconstituted in DDM micelles) in the presence of ~31 mM sodium cholate. The complete set of DEER echo curves and corresponding P*r,τinv distributions are provided in Figure S6. Panel A was adapted from Kubatova et al. published in Proc. Natl. Acad. Sci. U.S.A. while the authors were U.S. Government employees at the National Institutes of Health.
Figure 4.
Figure 4.
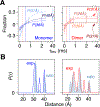
P(r) distributions for monomeric and dimeric β1AR(C163-R1/C344-R1) derived from T1-edited DEER data. (A) τinv dependence of the fractional contributions of monomer (right) and dimer (left) distance peaks. (B) Calculated PM(r) and PD(r) distributions, with predicted P(r) distributions modeled from atomic coordinates using the CalcPr helper function library, in Xplor-NIH depicted in light shaded blue. The Xplor-NIH nitroxide spin label conformational library was derived from data obtained with water-soluble proteins. We note that the predicted P(r) distributions obtained with Xplor-NIH are in significantly better agreement with the experimental T1-edited DEER-derived P(r) distributions than the predicted P(r) distributions obtained using a number of other programs, including MMM, chiLife, and MtsslWizzard (Figure S7).
Figure 5.
Figure 5.
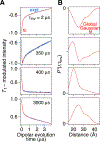
Quantitative global analysis of Q-band T1-edited DEER data obtained for GB1-httNTQ7 (Nterm-RNHS, S15C-R1). (A) Experimental (blue) and calculated (red) T1-edited DEER echo curves for 600μM GB1-httNTQ7 (Nterm-RNHS, S15C-R1) at several τinv values. All the data were fit globally to a sum of 4-Gaussians, two for the monomer and two for the dimer. (B) Corresponding P*r,τinv distributions. (The integrated absolute intensity is set to 1 in each trace.) The complete set of DEER echo curves and corresponding P*r,τinv distributions are provided in Figure S8.
Figure 6.
Figure 6.
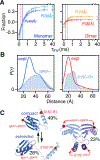
Calculated P(r) distributions for monomeric and dimeric GB1-httNTQ7 (Nterm-RNHS, S15C-R1) derived from T1-edited DEER. (A) τinv dependence of the fractional contributions of monomer (right) and dimer (left) distance peaks. (B) Calculated PM(r) (left) and PD(r) (right) distributions. For comparison, the left panel also includes the predicted P(r) (shaded light blue) for an intrinsically disordered monomer calculated using the self-avoiding walk model (SAW-v) while the right panel includes the DEER-derived P(r) obtained for 60μMGB1-httNTQ7 (Nterm-RNHS, S15C-R1) (shaded light blue) using Tikhonov regularization in the program DeerLab. (C) Diagrammatic ribbon drawings of the species present: the monomer exists in both extended (49%) and compact (28%) states (right), while the occupancy of the dimeric state is 23% (left). In the dimer, residues 3–17 of httNTQ7 form an antiparallel coiled-coil; this region is shown as a transparent helix in the monomer since monomeric httNTQ7 is intrinsically disordered. Note that in the dimer, the relative positions of the GB1 domains to one another as well as to the httNT coiled-coil are not determined by the data, and therefore the GB1 domains are shown as transparent ribbons. The coordinates of the GB1 domain are from ref. .

Similar articles

References

    1. Schiemann O; Prisner TF Long-Range Distance Determinations in Biomacromolecules by EPR Spectroscopy. Q. Rev. Biophys 2007, 40, 1–53 - PubMed
    1. Jeschke G Deer Distance Measurements on Proteins. Annu. Rev. Phys. Chem 2012, 63, 419–446. - PubMed
    1. Bode BE; Margraf D; Plackmeyer J; Durner G; Prisner TF; Schiemann O Counting the Monomers in Nanometer-Sized Oligomers by Pulsed Electron-Electron Double Resonance. J. Am. Chem. Soc 2007, 129, 6736–6745. - PubMed
    1. Jeschke G; Sajid M; Schulte M; Godt A Three-Spin Correlations in Double Electron-Electron Resonance. Phys. Chem. Chem. Phys 2009, 11, 6580–6591. - PubMed
    1. Schmidt T; Ghirlando R; Baber J; Clore GM Quantitative Resolution of Monomer-Dimer Populations by Inversion Modulated DEER EPR Spectroscopy. ChemPhysqhem 2016, 17, 2987–2991. - PMC - PubMed

LinkOut - more resources