. 2024 Jun 17;18(1):65.
doi: 10.1186/s40246-024-00633-5.

Comprehensive bioinformatics analysis of human cytomegalovirus pathway genes in pan-cancer

Affiliations

Comprehensive bioinformatics analysis of human cytomegalovirus pathway genes in pan-cancer

Tengyue Yan et al. Hum Genomics. .

Abstract

Background: Human cytomegalovirus (HCMV) is a herpesvirus that can infect various cell types and modulate host gene expression and immune response. It has been associated with the pathogenesis of various cancers, but its molecular mechanisms remain elusive.

Methods: We comprehensively analyzed the expression of HCMV pathway genes across 26 cancer types using the Cancer Genome Atlas (TCGA) and The Genotype-Tissue Expression (GTEx) databases. We also used bioinformatics tools to study immune invasion and tumor microenvironment in pan-cancer. Cox regression and machine learning were used to analyze prognostic genes and their relationship with drug sensitivity.

Results: We found that HCMV pathway genes are widely expressed in various cancers. Immune infiltration and the tumor microenvironment revealed that HCMV is involved in complex immune processes. We obtained prognostic genes for 25 cancers and significantly found 23 key genes in the HCMV pathway, which are significantly enriched in cellular chemotaxis and synaptic function and may be involved in disease progression. Notably, CaM family genes were up-regulated and AC family genes were down-regulated in most tumors. These hub genes correlate with sensitivity or resistance to various drugs, suggesting their potential as therapeutic targets.

Conclusions: Our study has revealed the role of the HCMV pathway in various cancers and provided insights into its molecular mechanism and therapeutic significance. It is worth noting that the key genes of the HCMV pathway may open up new doors for cancer prevention and treatment.

Keywords: Bioinformatics; Human cytomegalovirus pathway; Immune infiltration; Pan-cancer; Tumor mutation burden.


Conflict of interest statement

All the authors declared that they had no competing interests.

Figures

Fig. 1
Fig. 1
Overview of Sample Composition and Gene Expression Differences in Various Cancers.(A) The distribution of normal and tumor tissue samples across different cancer types: The horizontal axis represents different types of cancer, and samples are distinguished by color: blue for normal tissue and red for tumor tissue. For each cancer type, the counts of normal samples are indicated at the top, while those of tumor samples are indicated at the bottom. (B) The differences between normal and tumor samples across various cancers: Normal and tumor samples are depicted in blue and red, respectively. The horizontal axis represents different types of cancer, while the vertical axis indicates the level of gene expression. The symbols “*”, “**”, “***”, “****” and “ns” correspond to p < 0.05, p < 0.01, p < 0.001, p < 0.0001, and non-significance, respectively. The lack of any markers signifies the absence of normal controls for that type of cancer (MESO, UVM)
Fig. 2
Fig. 2
The differential gene expression across various cancer types (from left to right ACC, BLCA, BRCA, CHOL, DLBC, ESCA, GBM, HNSC, KICH, KIRC, KIRP, LAML, LGG, LIHC, LUAD, LUSC, OV, PAAD, PRAD, SKCM, STAD, TGCT, THCA, THYM, UCEC, UCS). The y axis shows the fold changes in gene expression. Gene expression levels relative to different color blocks are displayed in varying colors, with red representing up-regulated genes and blue representing down-regulated genes
Fig. 3
Fig. 3
Immune cell infiltration in various types of cancer: The squares on the left represent different cancer types, the middle squares represent salience scores, and the squares on the right represent distinct immune cell populations. The symbols “*”, “**”, “***”, “****” and “ns” correspond to p < 0.05, p < 0.01, p < 0.001, p < 0.0001, and non-significance
Fig. 4
Fig. 4
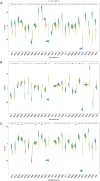
Assessing the tumor microenvironment via ESTIMATE algorithm: The horizontal axis represents different cancer types, and the vertical axis represents the scores. Normal samples are represented in blue, while tumor samples are indicated in yellow. The symbols “*”, “**”, “***”, “****” and “ns” correspond to p < 0.05, p < 0.01, p < 0.001, p < 0.0001, and non-significance. (A) Distribution of stromal scores across various cancers assessed by ESTIMATE approach. (B) Distribution of immune scores across multiple cancer types calculated by ESTIMATE algorithm. (C) Estimate scores reflecting tumor purity determined by ESTIMATE method
Fig. 5
Fig. 5
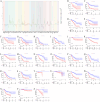
Identification and validation of prognostic gene signatures for cancers. (A) Forest plots of partial prognostic genes for each cancer: Different colors represent different cancer types, the horizontal axis represents different genes, the vertical axis represents the hazard ratio (HR) (dashed line represents HR = 1) and the line segments in the figure represent confidence intervals (CI). Kaplan-Meier curves compared the prognostic situations of prognostic genes in (B) ACC, (C) BLCA, (D) BRCA, (E) CHOL, (F) DLBC, (G) ESCA, (H) GBM, (I) HNSC, (J) KICH, (K) KIRC, (L) KIRP, (M) LAML, (N) LGG, (O) LIHC, (P) LUAD, (Q) LUSC, (R) OV, (S) PAAD, (T) PRAD, (U) SKCM, (V) STAD, (W) THCA, (X) THYM, (Y) UCEC, (Z) UCS. Red lines represented high-risk group, blue represented low-risk group
Fig. 6
Fig. 6
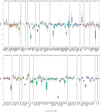
Validation of pan-cancer prognostic genes in CCLE: Validation of pan-cancer prognostic genes in CCLE: Each panel represents a different cancer type, with the x-axis denoting different genes, and the y-axis representing The Chronos dependency score. The size of the points within the boxplot corresponds to the gene’s expression level in cells (log2(TPM + 1))
Fig. 7
Fig. 7
Mutations of different cancer prognostic genes. Prognostic gene mutation details in (A) ACC, (B) BLCA, (C) BRCA, (D) CHOL, (E) DLBC, (F) ESCA, (G) GBM, (H) HNSC, (I) KICH, (J) KIRC, (K) KIRP, (L) LAML, (M) LGG, (N) LIHC, (O) LUAD, (P) LUSC, (Q) OV, (R) PAAD, (S) PRAD, (T) SKCM, (U) STAD, (V) THCA, (W) THYM, (X) UCEC, (Y) UCS: The horizontal axis represents genes, and the vertical axis represents mutation rates
Fig. 8
Fig. 8
Integrated Analyses of HCMV Pathway and Hub Genes. (A, B) Two significant subnetworks of PPI network. (C) GO enrichment analysis of Hub genes: The horizontal axis represents the potential functions enriched, while the vertical axis indicates the number of enrichments (from left to right, they are Biological Process (BP) in purple, Cellular Component (CC) in orange, and Molecular Function (MF) in green). (D) Pathway localization of hub genes in HCMV pathway
Fig. 9
Fig. 9
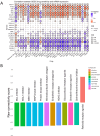
Integration of GDSC Analysis and CMap Validation Reveals Potential Drug Targets Associated with Hub Genes. (A) Gene expression-drug sensitivity correlations: Red indicates positive correlation and blue indicates negative correlation. Bubble size positively corresponds to FDR significance, with black outline highlighting correlations meeting FDR < = 0.05 threshold. (B) CMap validation identifies potential drug targets: The columns of various colors represent the actions of different compounds, with corresponding labels denoting the potential targets of action. The vertical axis depicts the connectivity score

Similar articles

References

    1. Sung H, Global Cancer Statistics. 2020: GLOBOCAN Estimates of Incidence and Mortality Worldwide for 36 Cancers in 185 Countries. CA: a cancer journal for clinicians. 2021;71(3):209-249.10.3322/caac.21660. - PubMed
    1. Ugai T, et al. Is early-onset cancer an emerging global epidemic? Current evidence and future implications. Nat Reviews Clin Oncol. 2022;19(10):656–73. doi: 10.1038/s41571-022-00672-8. - DOI - PMC - PubMed
    1. Angelova M, et al. Human cytomegalovirus infection dysregulates the canonical Wnt/β-catenin signaling pathway. PLoS Pathog. 2012;8(10):e1002959. doi: 10.1371/journal.ppat.1002959. - DOI - PMC - PubMed
    1. Yu Z, et al. Apoptosis disorder, a Key Pathogenesis of HCMV-Related diseases. Int J Mol Sci. 2021;22(8). 10.3390/ijms22084106. - PMC - PubMed
    1. Long X et al. Insight for Immunotherapy of HCMV Infection. International journal of biological sciences. 2021;17(11):2899-2911.10.7150/ijbs.58127. - PMC - PubMed

Publication types

MeSH terms

LinkOut - more resources