. 2024 Sep:194:112483.
doi: 10.1016/j.exger.2024.112483. Epub 2024 Jun 18.

Autophagy markers LC3 and p62 in aging lumbar motor neurons

Affiliations

Autophagy markers LC3 and p62 in aging lumbar motor neurons

Sepideh Jahanian et al. Exp Gerontol. 2024 Sep.

Abstract

Autophagy is a ubiquitous process through which damaged cytoplasmic structures are recycled and degraded within cells. Aging can affect autophagy regulation in different steps leading to the accumulation of damaged organelles and proteins, which can contribute to cell dysfunction and death. Motor neuron (MN) loss and sarcopenia are prominent features of neuromuscular aging. Previous studies on phrenic MNs showed increased levels of the autophagy proteins LC3 and p62 in 24 month compared to 6 month old mice, consistent with the onset of diaphragm muscle sarcopenia. In the present study, we hypothesized that aging leads to increased expression of the autophagy markers LC3 and p62 in single lumbar MNs. Expression of LC3 and p62 in lumbar MNs (spinal levels L1-L6) was assessed using immunofluorescence and confocal imaging of male and female mice at 6, 18 and 24 months of age, reflecting 100 %, 90 % and 75 % survival, respectively. A mixed linear model with animal as a random effect was used to compare relative LC3 and p62 expression in choline acetyl transferase-positive MNs across age groups. Expression of LC3 and p62 decreased in the white matter of the lumbar spinal cord with aging, with ~29 % decrease in LC3 and ~ 7 % decrease in p62 expression at 24 months of age compared to 6 months of age. There was no change in LC3 or p62 expression in the gray matter with age. LC3 expression in MNs relative to white matter increased significantly with age, with 150 % increase at 24 months of age compared to 6 months of age. Similarly, p62 expression in MNs relative to white matter increased significantly with age, with ~14 % increase at 24 months of age compared to 6 months of age. No effect of sex or MN pool was observed in LC3 and p62 expression in MNs. Overall, these data suggest autophagy impairment during elongation (increased LC3) and degradation (increased p62) phases with aging in lumbar MNs.

Keywords: Aging; Autophagy; Motor neuron; Neuromuscular dysfunction; Spinal cord.


Conflict of interest statement

Declaration of competing interest This work was funded by NIH grant R01 AG057052 and the Mayo Clinic.

Figures

Fig. 1.
Fig. 1.
Autophagy consists of three main phases. During initiation, damaged organelles trigger activation of Beclin-1. The elongation phase involves conversion of LC3I to LC3II through lipidation with the aid of ATG3, ATG7 and the ATG5/12/16 complex recruitment. Disturbance during the elongation phase can lead to LC3 accumulation. During this phase, p62 binds to both ubiquitinated proteins and LC3 on the autophagosomal membrane, acting as a bridge that facilitates the engulfment of cargo by autophagosomes. Ultimately, after the autophagosome-lysosome fusion, the autophagosome containing the engulfed cargo gets sequestered within the lysosome during the degradation phase. Elevated p62 levels are seen with degradation phase impairment as receptor protein p62 plays an important role in autophagosome formation and its degradation via lysosome. Figure created with Biorender.com.
Fig. 2.
Fig. 2.
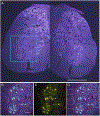
Lumbar spinal cord images obtained by confocal microscopy used to measure LC3 and p62 expression in motor neurons. (A) Stitched, multicolor, low magnification image was used to identify the spinal cord segment level by comparing to a mouse standard atlas (Sengul et al., 2012). This section was identified as L5. High magnification images of the ventral horn (inset, box outlined in blue) were used for fluorescence intensity measurements. (B, C) Maximum intensity projection images for LC3 (magenta), p62 (cyan) and motor neurons (ChAT+, yellow) corresponding to the inset in A. (D) Immunofluorescence intensity was measured for both LC3 and p62 in ChAT-positive motor neurons, gray matter (right squares), and white matter (left squares). Bar, 500 μm in A and 100 μm in B.
Fig. 3.
Fig. 3.
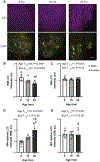
A) Representative images of LC3 and ChAT immunofluorescence in 6, 18, and 24 month old (mo) mice. Maximum intensity projection images for LC3 (magenta, upper panels) and motor neurons (ChAT+, yellow, lower panels). Immunofluorescence intensity was measured for LC3 in ChAT-positive motor neurons, gray and white matter (GM and WM, respectively) as in Fig. 2. (B–E) Bar graphs show mean ± 95 % CI of individual measurements of LC3 expression averaged per animal and normalized to the 6 mo female for each slide for B) WM, C) GM, D) MNs relative to the WM, and E) MNs relative to the GM. Intensity units are arbitrary (au). WM LC3 intensity decreased at 18 and 24 mo compared to 6 mo mice, and further decreased at 24 mo compared to 18 mo. This is while GM and MN LC3 relative to GM remained unchanged. LC3 expression in MNs relative to WM increased significantly at 24 mo compared to 6 and 18 mo. Statistics shown are from mixed linear model of individual MN measurements with age, sex, and their interactions as fixed effects and animal as random effect. *, significantly different than 6 mo. #, significantly different than 18 mo. Bar, 100 μm.
Fig. 4.
Fig. 4.
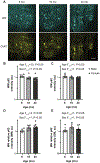
A) Representative image of p62 and ChAT immunofluorescence in 6, 18, and 24 month old (mo) mice. Maximum intensity projection images for p62 (cyan, upper panels) and motor neurons (ChAT+, yellow, lower panels). Immunofluorescence intensity was measured for p62 in ChAT-positive motor neurons, gray and white matter (GM and WM, respectively) as in Fig. 2. (B–E) Bar graphs show mean ± 95 % CI of individual measurements of p62 expression per animal normalized to the 6 mo female for each slide for B) WM, C) GM, D) MNs relative to the WM and E) MNs relative to the GM. WM p62 intensity decreased at 18 and 24 mo compared to 6 mo mice. This is while GM and MN p62 relative to GM remained unchanged. p62 expression in MNs relative to WM increased significantly at 24 mo compared to 6 mo. Intensity units are arbitrary (au). Statistics shown are from mixed linear model of individual MN measurements with age, sex, and their interactions as fixed effects and animal as random effect. *, significantly different than 6 mo. #, significantly different than 18 mo. Bar, 100 μm.
Fig. 5.
Fig. 5.
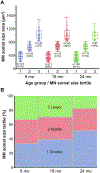
A) Distribution of MN somal size across age groups. MNs were classified into tertiles by somal cross-sectional area in the 6 mo group, and these criteria were applied to the older 18 and 24 mo groups and tertiles. The numbers of MNs in each tertile and age group are included below each box plot. B) Mosaic plot shows MN somal size tertiles in different age groups. Wider mosaic area in the 18 mo age group indicates greater number of MNs were present in this group. The number of MNs in the larger tertiles decreases with age, Chi-square p < 0.0001.
Fig. 6.
Fig. 6.
Correlation between LC3B and p62 relative fluorescence intensity in individual motor neurons in the lumbar spinal cord of mice shown in different groups based on motor neuron soma size tertiles. Each point represents an individual motor neuron and colors represent age groups. Shaded areas show bivariate normal density ellipses (50 % of distribution) for each age group. Across all tertiles, there was an upward and leftward shift with aging, reflecting the age-related increase in relative LC3 and p62 expression. This shift is consistent across all MN somal size tertiles. *, shows the center of each ellipse.

Similar articles

Cited by

References

    1. Bjørkøy G, Lamark T, Pankiv S, Øvervatn A, Brech A, Johansen T, 2009. Monitoring autophagic degradation of p62/SQSTM1. Methods Enzymol. 452, 181–197. - PubMed
    1. Brann DW, Dhandapani K, Wakade C, Mahesh VB, Khan MM, 2007. Neurotrophic and neuroprotective actions of estrogen: basic mechanisms and clinical implications. Steroids 72, 381–405. - PMC - PubMed
    1. Burke RE, Levine DN, Tsairis P, Zajac III FE, 1973. Physiological types and histochemical profiles in motor units of the cat gastrocnemius. J. Physiol 234, 723–748. - PMC - PubMed
    1. Caccia MR, Harris JB, Johnson MA, 1979. Morphology and physiology of skeletal muscle in aging rodents. Muscle Nerve 2, 202–212. - PubMed
    1. Carnio S, LoVerso F, Baraibar MA, Longa E, Khan MM, Maffei M, Sandri M, 2014. Autophagy impairment in muscle induces neuromuscular junction degeneration and precocious aging. Cell Rep. 8, 1509–1521. - PMC - PubMed

LinkOut - more resources