

Genomic imputation of ancient Asian populations contrasts local adaptation in pre- and post-agricultural Japan
- PMID: 38883821
- PMCID: PMC11176660
- DOI: 10.1016/j.isci.2024.110050
Genomic imputation of ancient Asian populations contrasts local adaptation in pre- and post-agricultural Japan
Abstract
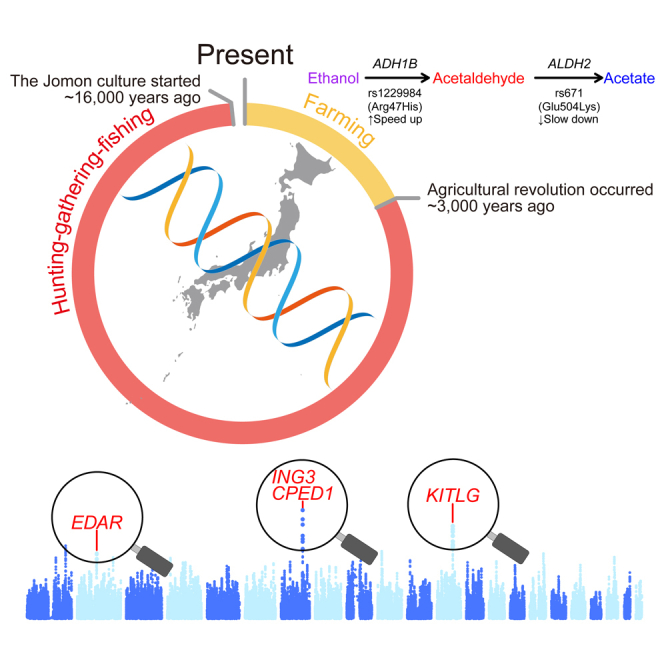
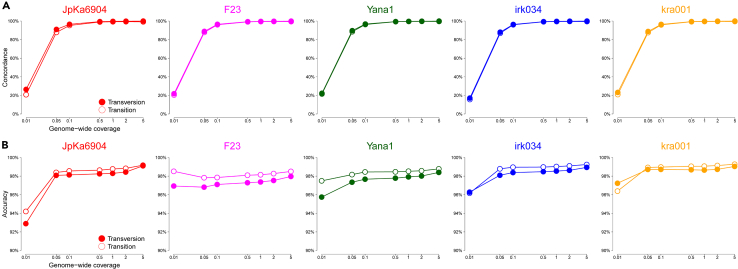
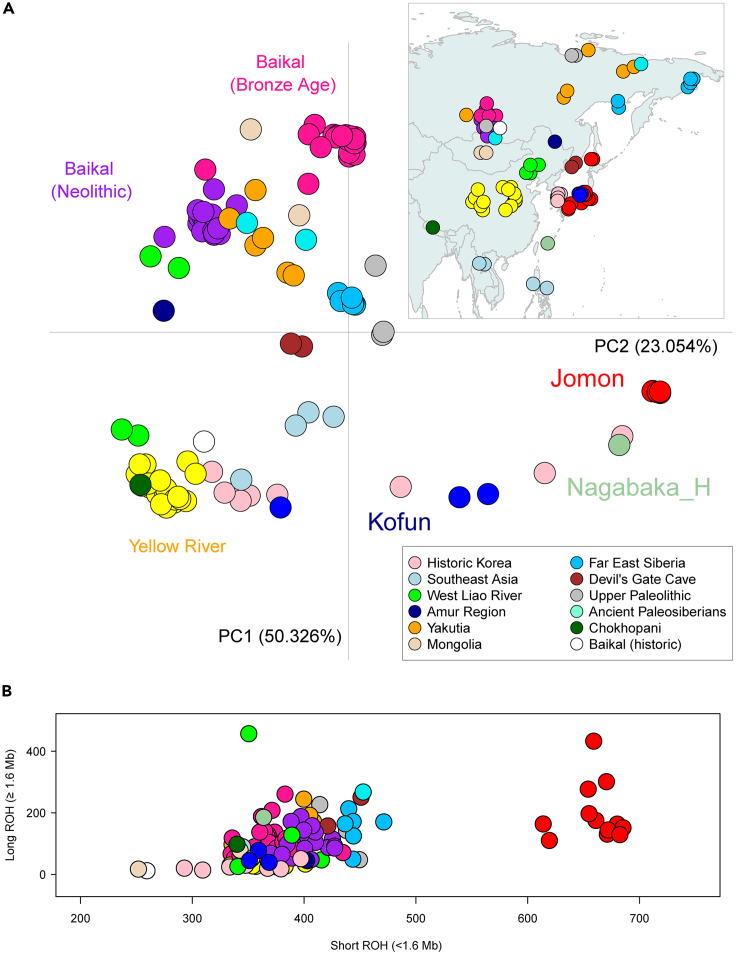
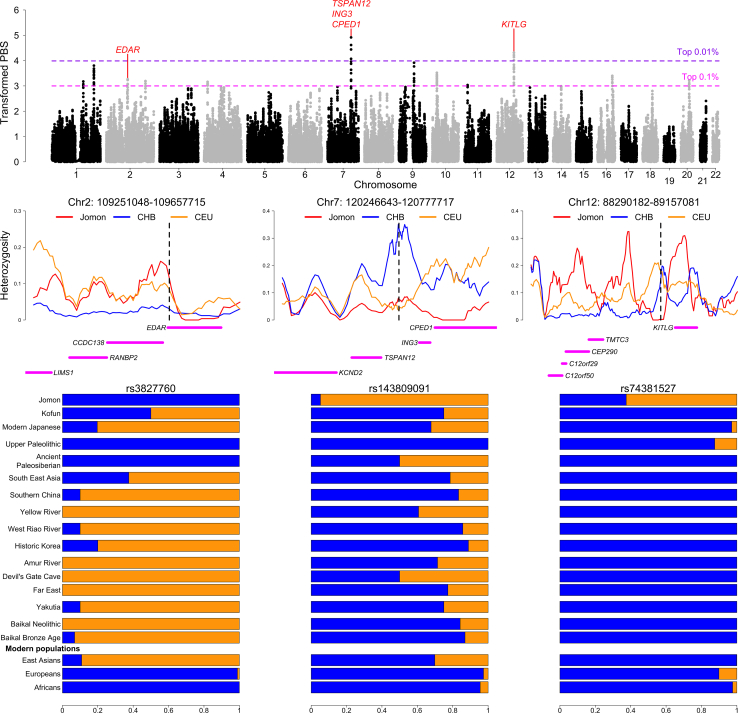
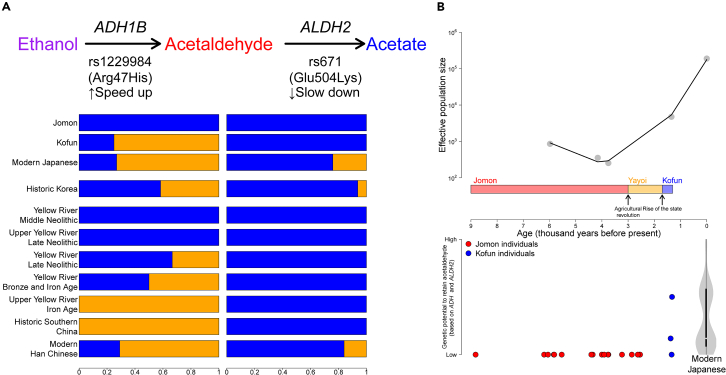
Early modern humans lived as hunter-gatherers for millennia before agriculture, yet the genetic adaptations of these populations remain a mystery. Here, we investigate selection in the ancient hunter-gatherer-fisher Jomon and contrast pre- and post-agricultural adaptation in the Japanese archipelago. Building on the successful validation of imputation with ancient Asian genomes, we identify selection signatures in the Jomon, particularly robust signals from KITLG variants, which may have influenced dark pigmentation evolution. The Jomon lacks well-known adaptive variants (EDAR, ADH1B, and ALDH2), marking their emergence after the advent of farming in the archipelago. Notably, the EDAR and ADH1B variants were prevalent in the archipelago 1,300 years ago, whereas the ALDH2 variant could have emerged later due to its absence in other ancient genomes. Overall, our study underpins local adaptation unique to the Jomon population, which in turn sheds light on post-farming selection that continues to shape contemporary Asian populations.
Keywords: Anthropology; Genomics.
© 2024 The Author(s).
Conflict of interest statement
The authors declare no competing interests.
Figures
Similar articles
-
Ancient genomics reveals tripartite origins of Japanese populations.Sci Adv. 2021 Sep 17;7(38):eabh2419. doi: 10.1126/sciadv.abh2419. Epub 2021 Sep 17. Sci Adv. 2021. PMID: 34533991 Free PMC article.
-
The characteristic mid-shaft cross-sectional shape of the ulna in Jomon hunter-gatherers.Am J Phys Anthropol. 2017 Nov;164(3):598-608. doi: 10.1002/ajpa.23300. Epub 2017 Aug 21. Am J Phys Anthropol. 2017. PMID: 28832931
-
Morphological features of the fibula in Jomon hunter-gatherers from the shell mounds of the Pacific coastal area.Am J Phys Anthropol. 2016 Aug;160(4):708-18. doi: 10.1002/ajpa.23000. Epub 2016 May 3. Am J Phys Anthropol. 2016. PMID: 27143195
-
The demographic and adaptive history of central African hunter-gatherers and farmers.Curr Opin Genet Dev. 2018 Dec;53:90-97. doi: 10.1016/j.gde.2018.07.008. Epub 2018 Aug 10. Curr Opin Genet Dev. 2018. PMID: 30103089 Review.
-
Hunter-gatherer genomics: evolutionary insights and ethical considerations.Curr Opin Genet Dev. 2016 Dec;41:1-7. doi: 10.1016/j.gde.2016.06.015. Epub 2016 Jul 9. Curr Opin Genet Dev. 2016. PMID: 27400119 Free PMC article. Review.
Cited by
-
Genetic legacy of ancient hunter-gatherer Jomon in Japanese populations.Nat Commun. 2024 Nov 12;15(1):9780. doi: 10.1038/s41467-024-54052-0. Nat Commun. 2024. PMID: 39532881 Free PMC article.
References
-
- Price T.D., Bar-Yosef O. The Origins of Agriculture: New Data, New Ideas: An Introduction to Supplement 4. Curr. Anthropol. 2011;52:S163–S174.
-
- Barker G. Oxford University Press on Demand; 2009. The Agricultural Revolution in Prehistory: Why Did Foragers Become Farmers?
-
- Diamond J., Bellwood P. Farmers and their languages: the first expansions. Science. 2003;300:597–603. - PubMed
-
- Bocquet-Appel J.-P., Bar-Yosef O. Springer Science & Business Media; 2008. The Neolithic Demographic Transition and its Consequences.
-
- Richards M.P. A brief review of the archaeological evidence for Palaeolithic and Neolithic subsistence. Eur. J. Clin. Nutr. 2002;56:16. p following 1262. - PubMed
LinkOut - more resources
Full Text Sources
Miscellaneous
