[Preprint]. 2024 Jun 6:rs.3.rs-4467983.
doi: 10.21203/rs.3.rs-4467983/v1.

Key features of the innate immune response is mediated by the immunoproteasome in microglia

Affiliations

Key features of the innate immune response is mediated by the immunoproteasome in microglia

Salman Izadjoo et al. Res Sq. .

Abstract

Microglia are the resident immune cells of the central nervous system (CNS). We and others have shown that the inflammatory response of microglia is partially regulated by the immunoproteasome, an inducible form of the proteasome responsible for the generation of major histocompatibility complex (MHC) class I epitopes. While the role of the proteasome in the adaptive immune system is well established, emerging evidence suggests the immunoproteasome may have discrete functions in the innate immune response. Here, we show that inhibiting the immunoproteasome reduces the IFNγ-dependent induction of complement activator C1q, suppresses phagocytosis, and alters the cytokine expression profile in a microglial cell line and microglia derived from human inducible pluripotent stem cells. Moreover, we show that the immunoproteasome regulates the degradation of IκBα, a modulator of NF-κB signaling. Finally, we demonstrate that NADH prevents induction of the immunoproteasome, representing a potential pathway to suppress immunoproteasome-dependent immune responses.

Keywords: Complement; Cytokines; Immunoproteasome; Innate immunity; Microglia; NFκ-B; ONX-0914; Phagocytosis.


Conflict of interest statement

Neither I nor my family members have a financial interest in any commercial product, service, or organization providing financial support for this research.

Figures

Figure 1
Figure 1. Immunoproteasome inhibition reduces IFNγ-dependent complement gene activation.
Wild-type or β5i knockout BV-2 cells were treated with IFNγ in the absence and presence of immunoproteasome inhibitor, ONX-0914 and levels of C1q genes were analyzed. A. Gene expression analysis revealed a significant difference of C1qa gene expression between treatment groups ([F(5, 20) =9.21], p<.001, n=5). Post hoc analysis revealed that IFNγ resulted in a significant increase of C1qa compared to all other groups (control, p<.001; ONX-0914, p=.001; ONX+IFNγ, p<.01; KO control, p<.001; K.O. IFNγ, p<.001). C1qa levels were not increased by IFNγ, in β5i KO cells (p=.996, n=3). B. Gene expression analysis revealed a significant difference of C1qb gene expression between treatment groups ([F(5, 20) =10.56], p<.001, n=5). Post hoc analysis revealed that IFNγ resulted in a significant increase of C1qb (control, p<.001; KO control, p<.001; KO IFNγ, p<.05. C1qb levels were not increased by IFNγ, in β5i KO cells (p=.974, n=3). C. Gene expression analysis revealed a significant difference of C1qc gene expression between treatment groups ([F(5, 24) =10.56], p<.001, n=6). Post hoc analysis revealed that IFNγ resulted in a significant increase of C1qc (control, p<.001; ONX+IFNγ, p=.012; KO control, p<.001; K.O. IFNγ, p<.01. C1qc levels were not increased by IFNγ, in β5i KO cells (p>.999, n=3). D. Western blot analysis confirms that IFNγ treatment increases C1q protein levels in WT BV2 cells but not in β5i KO BV-2 cells. E. Analysis of C3 gene expression revealed a significant difference between groups (F(3,12)=15.76, p<.001, n=4). Post hoc analysis revealed that ONX-0914 treatment reduced C3 levels compared to control and IFNγ treatments (p<.01 and p≤.001, respectively). Further, ONX-0914 co-treatment with IFNγ reduced C3 levels compared to IFNγ alone, (p=.002). F. Gene expression analysis of C1qa, C1qb and C1qc in iPSC-derived microglia were determined by qRT-PRC (control n=4, SMA n=4; * p<0.05, ** p=0.01, *** p<0.001, **** P<.0001).
Figure 2
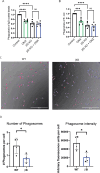
Figure 2. Phagocytosis is impaired by immunoproteasome inhibition.
WT and β5i KO BV-2 cells were treated for 24 hours with ONX-0914 prior to measuring phagocytosis by flow cytometry. To adjust for background, control cells that were not exposed to fluorescent beads were used for each experiment A. Phagocytosis of IgG-coated latex beads was significantly different between groups ([F(3,10)=7.68, p=.005). Post hoc analysis revealed that treatment with ONX-0914 resulted in significantly decreased phagocytosis compared to control (p=.032). B. Phagocytosis of eGFP-expressing E. coli was measured after a 30 minute incubation by quantifying the percentage of cells that were GFP positive. Flow cytometry analysis revealed a significant difference between treatment groups ([F(3,18)=39.23], p<.001). Treatment with ONX-0914 resulted in significantly decreased phagocytosis compared to control (p<.001). C. Example images of pHrodo IgG mediated phagocytosis uptake at end of 2-hour imaging in WT (left) and β5i KO BV-2 cells (right). Red fluorescence signifies pHrodo bead uptake. Blue fluorescence signifies Hoechst staining of cell nuclei. Scale bar is 500μm. D. Number of phagosomes per cell and mean phagosome signal intensity was significantly decreased in β5i KO BV-2 cells compared to WT. Reported as mean value per experiment. Error bars demonstrate SEM. Phagosome count per cell statistical analysis was performed with unpaired t-test, *p<0.0289. Mean phagosome fluorescence intensity analysis was performed with unpaired t-test, *p<0.0132.
Figure 3
Figure 3. Immunoproteasomes mediate IFNγ-dependent cytokine production.
BV-2 cells were treated for 24 hours, and cytokine levels were measured using a Proteome Profiler assay. A and B. Statistical analysis revealed that ONX-0914 treatment abrogated the IFNγ-dependent increase of Ip-10 ([F(3,11)=104.4], p<.001). Post hoc analysis revealed that IFNγ increased Ip-10 levels compared to control (p<.001), ONX-0914 (p<.001), and ONX-0914+IFNγ co-treatment (p<.001). In addition, there was a significant difference of Mig protein levels between treatment groups ([F(3,11)=18.61], p<.001). Post hoc analysis revealed that IFNγ treatment resulted in higher Mig protein levels than all other groups (Ctrl,ontrol p<.001; ONX-0914, p<.001; ONX-0914+IFNγ, p=.003). MCP-1 levels were significantly different between groups ([F(3,8)=5.591], p=.02). IFNγ treatment increased MCP-1 levels compared to control (p=.035) which was reduced by ONX-0914 co-treatment (p=.029). Rantes protein levels were also different between treatment groups ([F(3,12)=24.18], p<.001). Post hoc analysis revealed that Rantes cytokine levels were significantly higher in the IFNγ treatment group compared to all other groups (Control, p<.001; ONX-0914, p<.001; ONX-0914, +IFNγ, p<.0001).. C. BV-2 β5i KO cells were treated with IFNγ for 24 hours, and cytokine levels were measured using a Proteome Profiler assay. Ip-10, Mig, Rantes, and MCP-1 chemokine induction wasere abrogated in BV-2 β5i KO cells exposed to IFNγ, similar to ONX-0914 treatment.
Figure 4
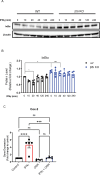
Figure 4. Altered degradation of IκBαin the absence of immunoproteasome activity.
IκBα levels were measured in WT and β5i KO BV-2 cells in the absence and presence of IFNγ. A. Representative Western blot of IκBα in WT BV-2 and β5i KO BV-2 βcells over a 240 minute time course following IFNγ exposure. B. Quantification of the data represented in A. (n=4, *p<0.05, ns=no significance) . There was a significant difference between groups ([F(3,28)=12.75], p<.001). Post hoc analysis revealed that IFNγ treatment significantly reduced IκBα levels compared to control (p<0.05) after 20 minutes. IκBα levels were unchanged in BV-2 β5i KO cells treated with IFNγ. C. Gene expression analysis of cox2C by qRT-PCR (n=5, ***p<0.001, ****p<0.0001, ns=no significance).
Figure 5
Figure 5. NADH blocks formation of the immunoproteasome.
BV-2 cells were pre-treated with NADH for 24 hours, then treated with IFNγ for an additional 24 hours. Relative amounts of immunoproteasome protein levels were quantified. A. Western blot analysis revealed a significant difference between treatment groups ([F(3, 16) =19.04], p<.001, n=4). Post hoc analysis revealed that IFNγ increasesd total β5i protein levels compared to all groups (Control, p=.006; NAD, p<.001; NADH+IFNγ, p<.0001). Further, IFNγ did not significantly increase β5i protein levels in cells pre-treated with NADH (p=.997). B. Assembled immunoproteasomes (20i represents purified positive control) were measured using native gel electrophoresis. Analysis revealed that there was a significant difference between treatment groups ([F(3, 11) =9.845], p=.002, n=4). Post hoc analysis revealed that IFNγ increased the amount of assembled immunoproteasomes compared to all treatment groups (Control, p=.003; NADH, p=.004; NAD+IFNγ, p=.009). Interestingly, when cells are pre-treated with NADH, immunoproteasomes are not increased in response to IFNγ (p=.996). C. To determine if NADH treatment would successfully reduce complement activation in BV-2 cells, we pre-treated with NADH, then measured gene expression of complement activator C1qa. An ANOVA revealed a significant treatment effect ([F(3,12)=48.22, p<.001). Post hoc analysis revealed a significant increase of C1qa gene expression in response to IFNγ treatment (p<.001), an effect that was reduced by NADH pre-treatment (p=.049).

Similar articles

References

    1. Kofler J. & Wiley C. A. Microglia: key innate immune cells of the brain. Toxicol Pathol 39, 103–114 (2011). 10.1177/0192623310387619 - DOI - PubMed
    1. Veerhuis R., Nielsen H. M. & Tenner A. J. Complement in the brain. Molecular immunology 48, 1592–1603 (2011). 10.1016/j.molimm.2011.04.003 - DOI - PMC - PubMed
    1. Tanaka S. et al. Activation of microglia induces symptoms of Parkinson’s disease in wild-type, but not in IL-1 knockout mice. Journal of neuroinflammation 10, 143 (2013). 10.1186/1742-2094-10-143 - DOI - PMC - PubMed
    1. Ciechanover A. The ubiquitin-proteasome proteolytic pathway. Cell 79, 13–21 (1994). - PubMed
    1. Stohwasser R. et al. Biochemical analysis of proteasomes from mouse microglia: induction of immunoproteasomes by interferon-gamma and lipopolysaccharide. Glia 29, 355–365 (2000). - PubMed

Publication types