. 2024 Jun 14;15(1):5093.
doi: 10.1038/s41467-024-49369-9.

No evidence for ongoing replication on ART in SIV-infected macaques

Affiliations

No evidence for ongoing replication on ART in SIV-infected macaques

Taina T Immonen et al. Nat Commun. .

Abstract

The capacity of HIV-1 to replicate during optimal antiretroviral therapy (ART) is challenging to assess directly. To gain greater sensitivity to detect evolution on ART, we used a nonhuman primate (NHP) model providing precise control over the level of pre-ART evolution and more comprehensive analyses than are possible with clinical samples. We infected 21 rhesus macaques (RMs) with the barcoded virus SIVmac239M and initiated ART early to minimize baseline genetic diversity. RMs were treated for 285-1200 days. We used several tests of molecular evolution to compare 1352 near-full-length (nFL) SIV DNA single genome sequences from PBMCs, lymph nodes, and spleen obtained near the time of ART initiation and those present after long-term ART, none of which showed significant changes to the SIV DNA population during ART in any animal. To investigate the possibility of ongoing replication in unsampled putative tissue sanctuaries during ART, we discontinued treatment in four animals and confirmed that none of the 336 nFL SIV RNA sequences obtained from rebound plasma viremia showed evidence of evolution. The rigorous nature of our analyses reinforced the emerging consensus of a lack of appreciable ongoing replication on effective ART and validates the relevance of this NHP model for cure studies.


Conflict of interest statement

The authors declare no competing interests.

Figures

Fig. 1
Fig. 1. Plasma viral load curves and sampling dates from 3 study cohorts.
Colored horizontal bars indicate the timeframe of ART treatment in each cohort. Dashed and solid arrows indicate when baseline and long-term ART SIV DNA samples were collected for each cohort, respectively. PVL has a 15 copy/mL limit of detection. Source data are provided as a Source Data file.
Fig. 2
Fig. 2. No evidence for evolution in cohort 1 animals initiating ART at 27 dpi.
The scatter plot at each time point shows the distribution of p-distances from the SIVmac239 founder with black lines corresponding to the linear regression slopes (mutations per site per day) and the grey bands to the 95% confidence intervals around the slope (A). The evolutionary rates during ART are not significantly different from zero in any animal (two-sided t-test). The phylogenetic trees show intermixing of nFL SIV DNA sequences obtained from PBMCs at 45 dpi (blue) and 285–345 dpi (red) in each animal (B). Asterisks indicate sequences with short indels. Source data are provided as a Source Data file.
Fig. 3
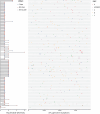
Fig. 3. Phylogenetic tree and highlighter alignment show lack of evolution in cohort 2 animals starting ART at 10 dpi.
The neighbor-joining tree combining all nFL SIV DNA sequences obtained from PBMCs for all ten RMs has a star-like structure with few shared mutations between sequences. Single nucleotide polymorphisms (SNP) from the SIVmac239 founder sequence [red for adenine (A), blue for cytosine (C), orange for guanine (G), and green for thymine (T), including potential APOBEC-mediated mutations (purple)] are indicated in the highlighter plot. Asterisks indicate sequences with short indels.
Fig. 4
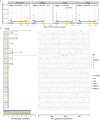
Fig. 4. No evidence for evolution in cohort 3 animals initiating ART at 10 dpi.
The scatter plot shows the distribution of p-distances from SIVmac239 at each time point, with black lines corresponding to the linear regression slopes (mutations per site per day) and the grey bands to the 95% confidence intervals around the slopes (A). The evolutionary rates during ART are not significantly different from zero in any animal (two-sided t-test). The phylogenetic tree for animal H798 shows no evidence of viral evolution during ART (B). Clades of potential viral clones (identical sequences with the same genetic barcode) are indicated by hashtag. Red taxa lines indicate APOBEC-induced mutations. Single nucleotide polymorphisms (SNP) from the SIVmac239 founder sequence [red for adenine (A), blue for cytosine (C), orange for guanine (G), and green for thymine (T), including potential APOBEC-mediated mutations (purple)] are indicated in the highlighter plot. Asterisks indicate sequences with short indels. Source data are provided as a Source Data file.
Fig. 5
Fig. 5. Reactivation of barcoded lineages based on relative abundance in pre-ART plasma.
The grey points depict the relative frequencies (log10) of the rank-ordered barcodes detected in pre-ART plasma. Vertical grey lines highlight which barcodes from the pre-ART distribution were detected following treatment interruption by next-generation barcode sequencing, with their relative frequencies (log10) in rebound plasma viremia indicated by white or colored symbols. Square symbols correspond to barcodes that were detected in at least one on-ART SIV DNA sample, and circles correspond to barcodes that were only detected in pre-ART and off-ART plasma. Individual barcodes that were also found in nFL SIV RNA sequences obtained during ATI are color-coded accordingly. Source data are provided as a Source Data file.
Fig. 6
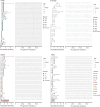
Fig. 6. No evidence for rebound from a replicating population for cohort 3 animals.
The color coding of each taxa in the phylogenetic tree indicates the genetic barcode of each nFL SIV RNA sequence obtained from rebound plasma viremia during ATI. Single nucleotide polymorphisms (SNP) from the SIVmac239 founder sequence [red for adenine (A), blue for cytosine (C), orange for guanine (G), and green for thymine (T), including potential APOBEC-mediated mutations (purple)] are indicated in the highlighter plot. Asterisks indicate sequences with short indels.

Similar articles

References

    1. Maldarelli F, et al. ART suppresses plasma HIV-1 RNA to a stable set point predicted by pretherapy viremia. PLoS Pathog. 2007;3:e46. doi: 10.1371/journal.ppat.0030046. - DOI - PMC - PubMed
    1. Volberding PA, Deeks SG. Antiretroviral therapy and management of HIV infection. Lancet. 2010;376:49–62. doi: 10.1016/S0140-6736(10)60676-9. - DOI - PubMed
    1. Besson GJ, et al. HIV-1 DNA decay dynamics in blood during more than a decade of suppressive antiretroviral therapy. Clin. Infect. Dis. 2014;59:1312–1321. doi: 10.1093/cid/ciu585. - DOI - PMC - PubMed
    1. Finzi D, et al. Latent infection of CD4 T cells provides a mechanism for lifelong persistence of HIV-1, even in patients on effective combination therapy. Nat. Med. 1999;5:512–517. doi: 10.1038/8394. - DOI - PubMed
    1. Finzi D, et al. Identification of a reservoir for HIV-1 in patients on highly active antiretroviral therapy. Science. 1997;278:1295–1300. doi: 10.1126/science.278.5341.1295. - DOI - PubMed

MeSH terms

Substances

LinkOut - more resources