

Identification and validation of a novel Parkinson-Glioma feature gene signature in glioma and Parkinson's disease
- PMID: 38872623
- PMCID: PMC11170708
- DOI: 10.3389/fnagi.2024.1352681
Identification and validation of a novel Parkinson-Glioma feature gene signature in glioma and Parkinson's disease
Abstract
Introduction: The prognosis for glioma is generally poor, and the 5-year survival rate for patients with this disease has not shown significant improvement over the past few decades. Parkinson's disease (PD) is a prevalent movement disorder, ranking as the second most common neurodegenerative disease after Alzheimer's disease. Although Parkinson's disease and glioma are distinct diseases, they may share certain underlying biological pathways that contribute to their development.
Objective: This study aims to investigate the involvement of genes associated with Parkinson's disease in the development and prognosis of glioma.
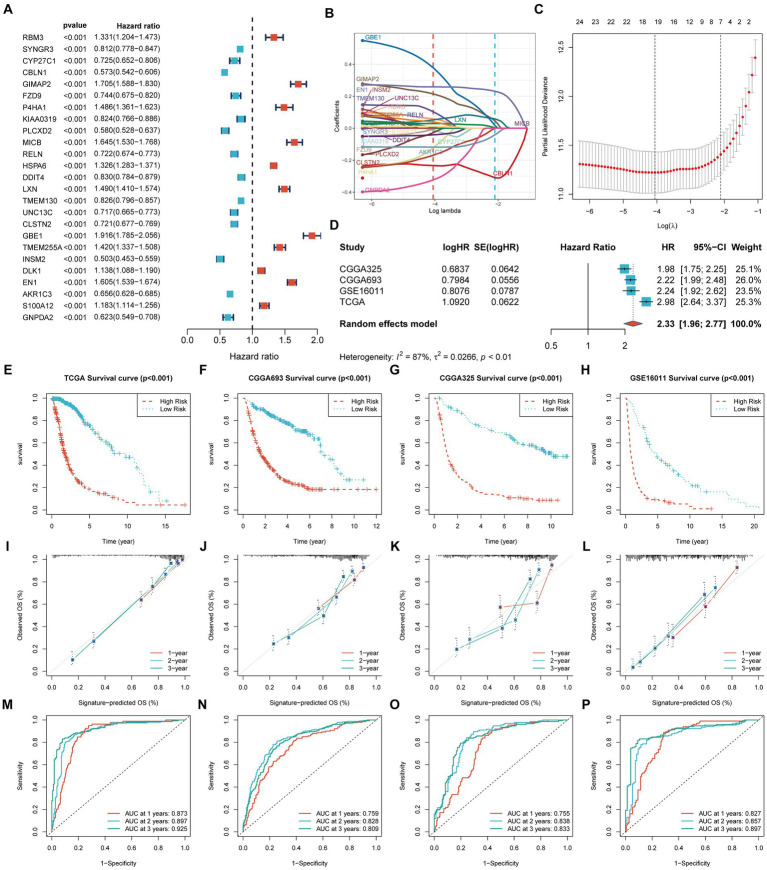
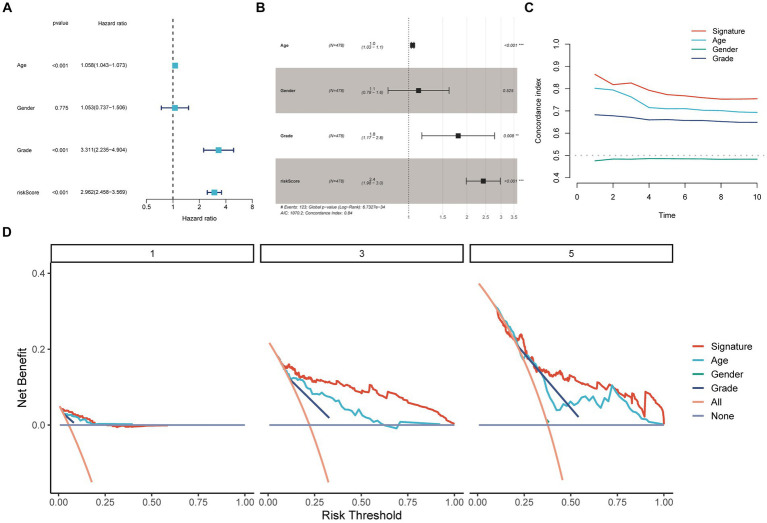
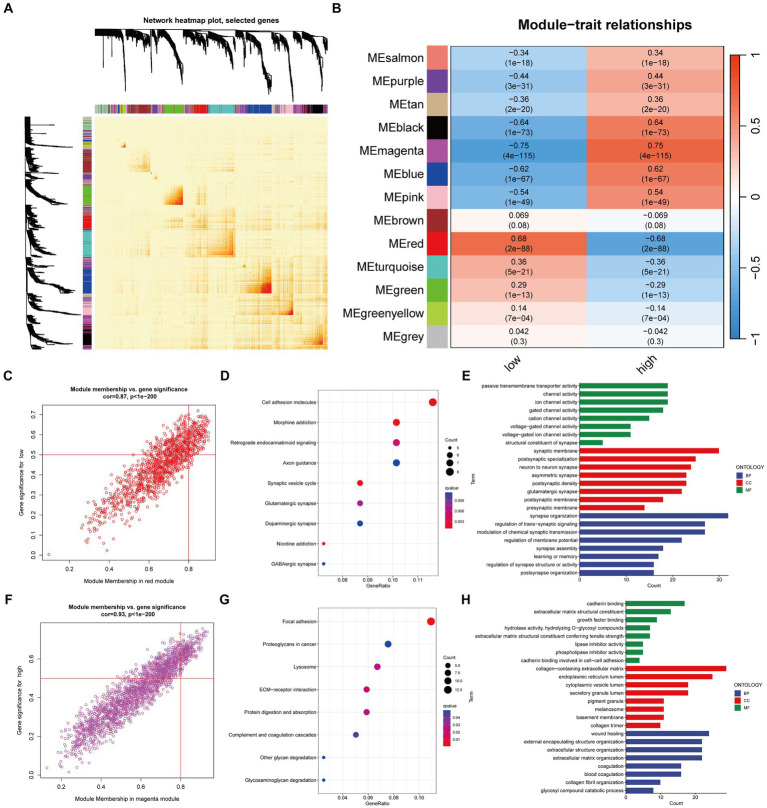
Methods: We obtained datasets from the TCGA, CGGA, and GEO databases, which included RNA sequencing data and clinical information of glioma and Parkinson's patients. Eight machine learning algorithms were used to identify Parkinson-Glioma feature genes (PGFGs). PGFGs associated with glioma prognosis were identified through univariate Cox analysis. A risk signature was constructed based on PGFGs using Cox regression analysis and the Least Absolute Shrinkage and Selection Operator (LASSO) method. We subsequently validated its predictive ability using various methods, including ROC curves, calibration curves, KM survival analysis, C-index, DCA, independent prognostic analysis, and stratified analysis. To validate the reproducibility of the results, similar work was performed on three external test datasets. Additionally, a meta-analysis was employed to observe the heterogeneity and consistency of the signature across different datasets. We also compared the differences in genomic variations, functional enrichment, immune infiltration, and drug sensitivity analysis based on risk scores. This exploration aimed to uncover potential mechanisms of glioma occurrence and prognosis.
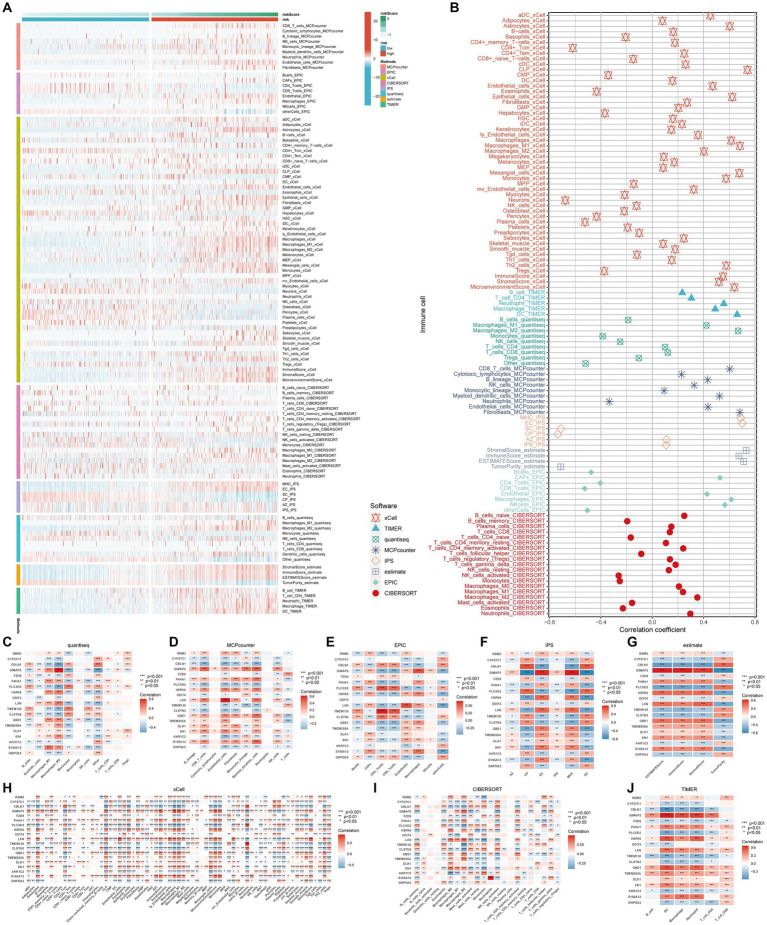
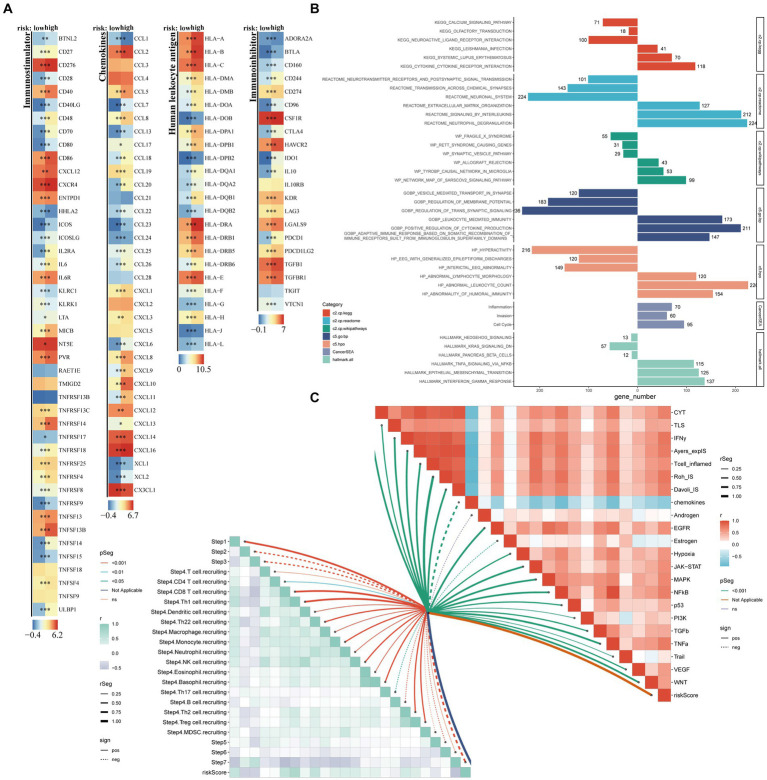
Results: We identified 30 PGFGs, of which 25 were found to be significantly associated with glioma survival. The prognostic signature, consisting of 19 genes, demonstrated excellent predictive performance for 1-, 2-, and 3-year overall survival (OS) of glioma. The signature emerged as an independent prognostic factor for glioma overall survival (OS), surpassing the predictive performance of traditional clinical variables. Notably, we observed differences in the tumor microenvironment (TME), levels of immune cell infiltration, immune gene expression, and drug resistance analysis among distinct risk groups. These findings may have significant implications for the clinical treatment of glioma patients.
Conclusion: The expression of genes related to Parkinson's disease is closely associated with the immune status and prognosis of glioma patients, potentially regulating glioma pathogenesis through multiple mechanisms. The interaction between genes associated with Parkinson's disease and the immune system during glioma development provides novel insights into the molecular mechanisms and targeted therapies for glioma.
Keywords: Parkinson’s disease; gene signature; glioma; machine learning algorithms; prognosis.
Copyright © 2024 Zhang, Wang, Su, Yang, Wang and Li.
Conflict of interest statement
The authors declare that the research was conducted in the absence of any commercial or financial relationships that could be construed as a potential conflict of interest.
Figures


Similar articles
-
Illustrating the biological functions and diagnostic value of transmembrane protein family members in glioma.Front Oncol. 2023 Mar 31;13:1145676. doi: 10.3389/fonc.2023.1145676. eCollection 2023. Front Oncol. 2023. PMID: 37064154 Free PMC article.
-
Identification and validation of neurotrophic factor-related gene signatures in glioblastoma and Parkinson's disease.Front Immunol. 2023 Feb 7;14:1090040. doi: 10.3389/fimmu.2023.1090040. eCollection 2023. Front Immunol. 2023. PMID: 36825022 Free PMC article.
-
Characterizing the key genes of COVID-19 that regulate tumor immune microenvironment and prognosis in hepatocellular carcinoma.Funct Integr Genomics. 2023 Aug 4;23(3):262. doi: 10.1007/s10142-023-01184-z. Funct Integr Genomics. 2023. PMID: 37540264
-
Antidiabetic drugs in Parkinson's disease.Clin Park Relat Disord. 2024 Jul 18;11:100265. doi: 10.1016/j.prdoa.2024.100265. eCollection 2024. Clin Park Relat Disord. 2024. PMID: 39149559 Free PMC article. Review.
-
5.2 Future Parkinson's disease therapies with the potential for Parkinson's disease care.In: Odin P, Chaudhuri KR, Aquilonious SM, Mundt-Petersen U, editors. Where are We? Continuous Dopaminergic Stimulation for Parkinson's Disease [Internet]. Berkshire (UK): Empowering Strategic Performance Ltd; 2023 Jan 1. In: Odin P, Chaudhuri KR, Aquilonious SM, Mundt-Petersen U, editors. Where are We? Continuous Dopaminergic Stimulation for Parkinson's Disease [Internet]. Berkshire (UK): Empowering Strategic Performance Ltd; 2023 Jan 1. PMID: 39208184 Free Books & Documents. Review. No abstract available.
References
Grants and funding
LinkOut - more resources
Full Text Sources
Miscellaneous