. 2024 Aug;76(4):807-822.
doi: 10.1007/s43440-024-00605-5. Epub 2024 Jun 11.

Effects of carvedilol on human prostate tissue contractility and stromal cell growth pointing to potential clinical implications

Affiliations

Effects of carvedilol on human prostate tissue contractility and stromal cell growth pointing to potential clinical implications

Sheng Hu et al. Pharmacol Rep. 2024 Aug.

Abstract

Background: Apart from antagonizing ß-adrenoceptors, carvedilol antagonizes vascular α1-adrenoceptors and activates G protein-independent signaling. Even though it is a commonly used antihypertensive and α1-adrenoceptors are essential for the treatment of voiding symptoms in benign prostatic hyperplasia, its actions in the human prostate are still unknown. Here, we examined carvedilol effects on contractions of human prostate tissues, and on stromal cell growth.

Methods: Contractions of prostate tissues from radical prostatectomy were induced by electric field stimulation (EFS) or α1-agonists. Growth-related functions were examined in cultured stromal cells.

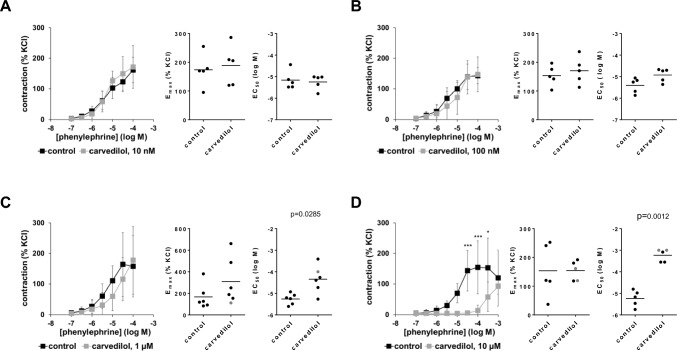
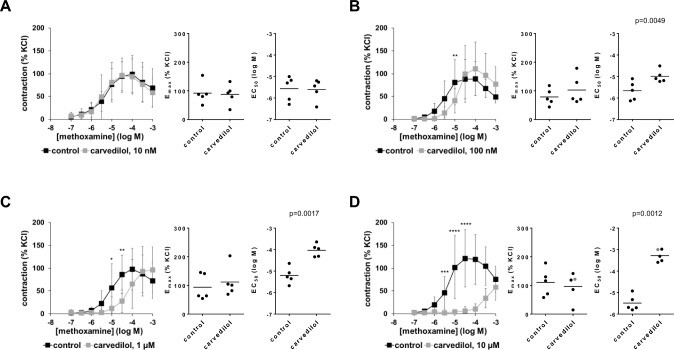
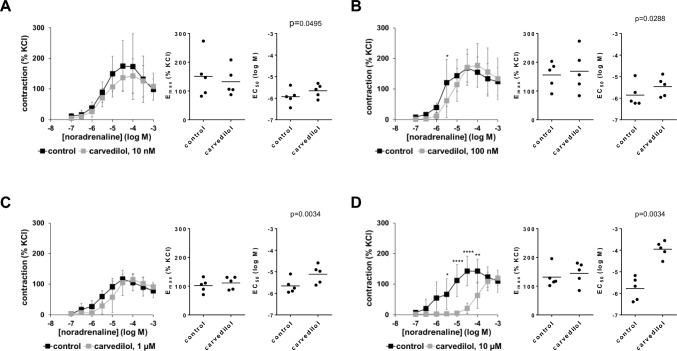
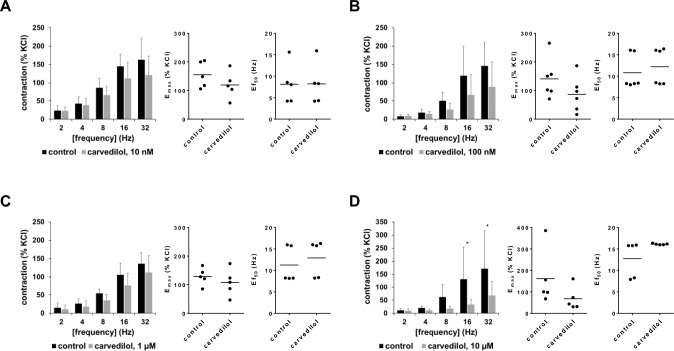
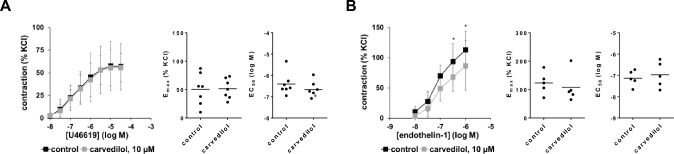
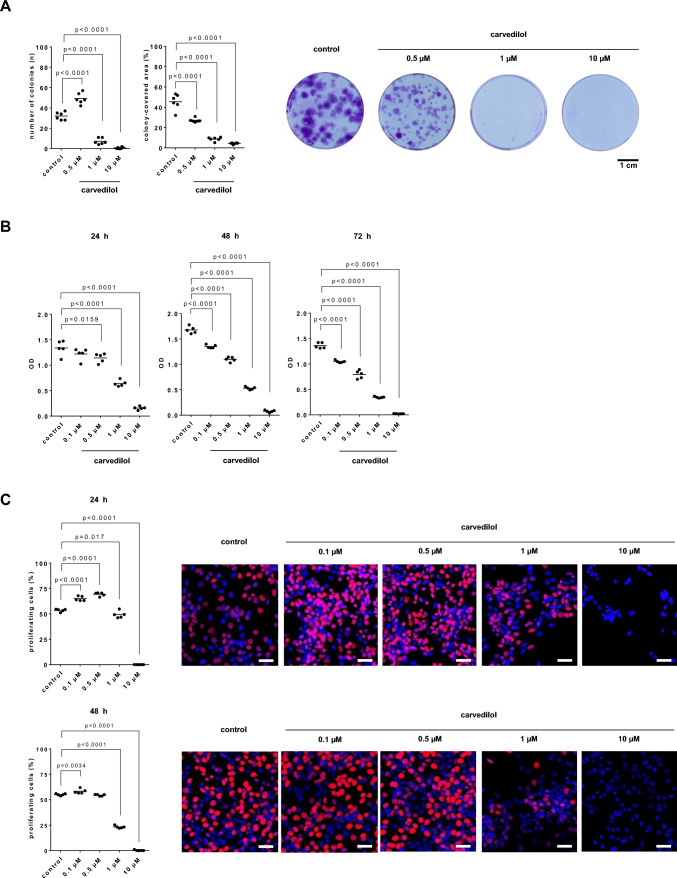
Results: Concentration-response curves for phenylephrine, methoxamine and noradrenaline were right shifted by carvedilol (0.1-10 µM), around half a magnitude with 100 nM, half to one magnitude with 1 µM, and two magnitudes with 10 µM. Right shifts were reflected by increased EC50 values for agonists, with unchanged Emax values. EFS-induced contractions were reduced by 21-54% with 0.01-1 µM carvedilol, and by 94% by 10 µM. Colony numbers of stromal cells were increased by 500 nM, but reduced by 1-10 µM carvedilol, while all concentrations reduced colony size. Decreases in viability were time-dependent with 0.1-0.3 µM, but complete with 10 µM. Proliferation was slightly increased by 0.1-0.5 µM, but reduced with 1-10 µM.

Conclusions: Carvedilol antagonizes α1-adrenoceptors in the human prostate, starting with concentrations in ranges of known plasma levels. In vitro, effect sizes resemble those of α1-blockers used for the treatment of voiding symptoms, which requires concentrations beyond plasma levels. Bidirectional and dynamic effects on the growth of stromal cells may be attributed to "biased agonism".

Keywords: Alpha1-blocker; Benign prostatic hyperplasia (BPH); Carvedilol; Lower urinary tract symptoms (LUTS); Prostate smooth muscle contraction; Voiding symptoms.


Conflict of interest statement

The authors have no conflicts of interest to declare that are relevant to the content of this article.

Figures

Fig. 1
Fig. 1
Effects of carvedilol on phenylephrine-induced contractions of human prostate tissues. Contractions were induced by phenylephrine, 30 min after the addition of 10 nM carvedilol (A), 100 nM carvedilol (B), 1 µM carvedilol (C) or 10 µM carvedilol (D), or of an equivalent amount of dimethylsulfoxide (DMSO, controls). Data from 5 independent experiments (A,B,D), and 6 independent experiments (C), where tissues from 5 (A,B,D) or 6 patients (C) were split to both groups of a panel (i.e. carvedilol and control), resulting in paired samples. Data are shown as means ± standard deviation from all experiments in concentration–response curves (two-way ANOVA), and all single Emax and EC50 values from all experiments (calculated by curve fitting) (paired Student’s t-tests) in scatter plots. *p < 0.05, **p < 0.01, ***p < 0.001, ****p < 0.0001 between control and carvedilol. Values based on approximation due to ambiguous values after curve fitting are marked in gray
Fig. 2
Fig. 2
Effects of carvedilol on methoxamine-induced contractions of human prostate tissues. Contractions were induced by methoxamine, 30 min after the addition of 10 nM carvedilol (A), 100 nM carvedilol (B), 1 µM carvedilol (C) or 10 µM carvedilol (D), or of an equivalent amount of dimethylsulfoxide (DMSO, controls). Data from 5 independent experiments in each panel, where tissues from 5 patients were split to both groups of a panel (i.e. carvedilol and control), resulting in paired samples. Data are are shown as means ± standard deviation from all experiments in concentration–response curves (two-way ANOVA), and all single Emax and EC50 values from all experiments (calculated by curve fitting) (paired Student’s t-tests) in scatter plots. *p < 0.05, **p < 0.01, ***p < 0.001, ****p < 0.0001 between control and carvedilol. Values based on approximation due to ambiguous values after curve fitting are marked in gray
Fig. 3
Fig. 3
Effects of carvedilol on noradrenaline-induced contractions of human prostate tissues. Contractions were induced by noradrenaline, 30 min after the addition of 10 nM carvedilol (A), 100 nM carvedilol (B), 1 µM carvedilol (C) or 10 µM carvedilol (D), or of an equivalent amount of dimethylsulfoxide (DMSO, controls). Data from 5 independent experiments in each panel, where tissues from 5 patients were split to both groups of a panel (i.e. carvedilol and control), resulting in paired samples. Data are shown as means ± standard deviation from all experiments in concentration–response curves (two-way ANOVA), and all single Emax and EC50 values from all experiments (calculated by curve fitting) (paired Student’s t-tests) in scatter plots. *p < 0.05, **p < 0.01, ***p < 0.001, ****p < 0.0001 between control and carvedilol
Fig. 4
Fig. 4
Apparent pA2 values of carvedilol. Apparent pA2 values were calculated for series with 100 nM, 1 µM and 10 µM carvedilol, applied to phenylephrine, methoxamine and noradrenaline. The calculation was based on experiments shown in Figs. 1, 2 and 3
Fig. 5
Fig. 5
Effects of carvedilol on EFS-induced contractions of human prostate tissues. Contractions were induced by electric field stimulation (EFS), 30 min after the addition of 10 nM carvedilol (A), 100 nM carvedilol (B), 1 µM carvedilol (C) or 10 µM carvedilol (D), or of an equivalent amount of dimethylsulfoxide (DMSO, controls). Data from 5 independent experiments in (A,B,D), and 6 independent experiments (B), where tissues from 5 (A,C,D) or 6 patients (B) were split to both groups of a panel (i.e. carvedilol and control), resulting in paired samples. Data are shown as means ± standard deviation from all experiments in frequency response curves (mixed ANOVA), and all single Emax and Ef50 values from all experiments (calculated by curve fitting) in scatter plots. Emax and Ef50 values (not significant) were analyzed by paired Student’s t-test. *p < 0.05, **p < 0.01, ***p < 0.001, ****p < 0.0001 between control and carvedilol
Fig. 6
Fig. 6
Effects of carvedilol on non-adrenergic contractions of human prostate tissues. Contractions were induced by the thromboxane A2 analog U46619 (A) or by endothelin-1 (B), 30 min after the addition of 10 µM carvedilol or of an equivalent amount of dimethylsulfoxide (DMSO, controls). Data from 7 independent experiments with U46619 and 5 independent experiments with endothelin-1, where tissues from 7 (A) or 5 patients (B) were split to both groups of a panel (i.e. carvedilol and control), resulting in paired samples. Data are shown as means ± SD from all experiments in concentration–response curves (two-way ANOVA), and all single Emax and EC50 values from all experiments (calculated by curve fitting). Emax and Ef50 values (not significant) were analyzed by paired Student’s t-test. *p < 0.05, **p < 0.01, ***p < 0.001, ****p < 0.0001 between control and carvedilol
Fig. 7
Fig. 7
Effects of carvedilol on colony formation, viability and proliferation of WPMY-1 cells. Cell growth was determined by colony formation assays (scale bar: 1 cm), 13 d after addition of carvedilol or dimethylsulfoxide (DMSO) to controls (A). Viability was determined by cell counting kit-8 (CCK-8) assays, 24–72 h after the addition of carvedilol or DMSO to controls (B). Proliferation was determined by EdU assays, 24 h or 48 h after the addition of carvedilol or DMSO to controls (C). Values from totals of 5 independent experiments per series for CCK-8 and EdU, and 6 experiments for colony formation assay (one-way ANOVA with Dunnett’s test), and representative images from colony formation assays (whole wells, colonies stained darked blue) and EdU stainings (whole microscopic fields, scale bars 20 µm, nuclei of proliferating cells stained red or pink, nuclei of non-proliferating cells stained blue)

Similar articles

References

    1. Gravas S, Gacci M, Gratzke C, Herrmann TRW, Karavitakis M, Kyriazis I, et al. Summary paper on the 2023 European Association of Urology Guidelines on the management of non-neurogenic male lower urinary tract symptoms. Eur Urol. 2023;84(2):207–22. 10.1016/j.eururo.2023.04.008. 10.1016/j.eururo.2023.04.008 - DOI - PubMed
    1. Hennenberg M, Michel MC. Adrenoceptors in the lower urinary tract. Handb Exp Pharmacol. 2023. 10.1007/164_2023_678. 10.1007/164_2023_678 - DOI - PubMed
    1. Lepor H. Pathophysiology, epidemiology, and natural history of benign prostatic hyperplasia. Rev Urol. 2004;6(Suppl 9):S3–10. - PMC - PubMed
    1. Ali M, Landeira M, Covernton PJO, Choudhury N, Jaggi A, Fatoye F, et al. The use of mono- and combination drug therapy in men and women with lower urinary tract symptoms (LUTS) in the UK: a retrospective observational study. BMC Urol. 2021;21(1):119. 10.1186/s12894-021-00881-w. 10.1186/s12894-021-00881-w - DOI - PMC - PubMed
    1. Cindolo L, Pirozzi L, Fanizza C, Romero M, Tubaro A, Autorino R, et al. Drug adherence and clinical outcomes for patients under pharmacological therapy for lower urinary tract symptoms related to benign prostatic hyperplasia: population-based cohort study. Eur Urol. 2015;68(3):418–25. 10.1016/j.eururo.2014.11.006. 10.1016/j.eururo.2014.11.006 - DOI - PubMed

MeSH terms

LinkOut - more resources