[Preprint]. 2024 May 31:2024.05.27.595830.
doi: 10.1101/2024.05.27.595830.

Multi-omics profiling of mouse polycystic kidney disease progression at a single cell resolution

Affiliations

Multi-omics profiling of mouse polycystic kidney disease progression at a single cell resolution

Yoshiharu Muto et al. bioRxiv. .

Update in

Abstract

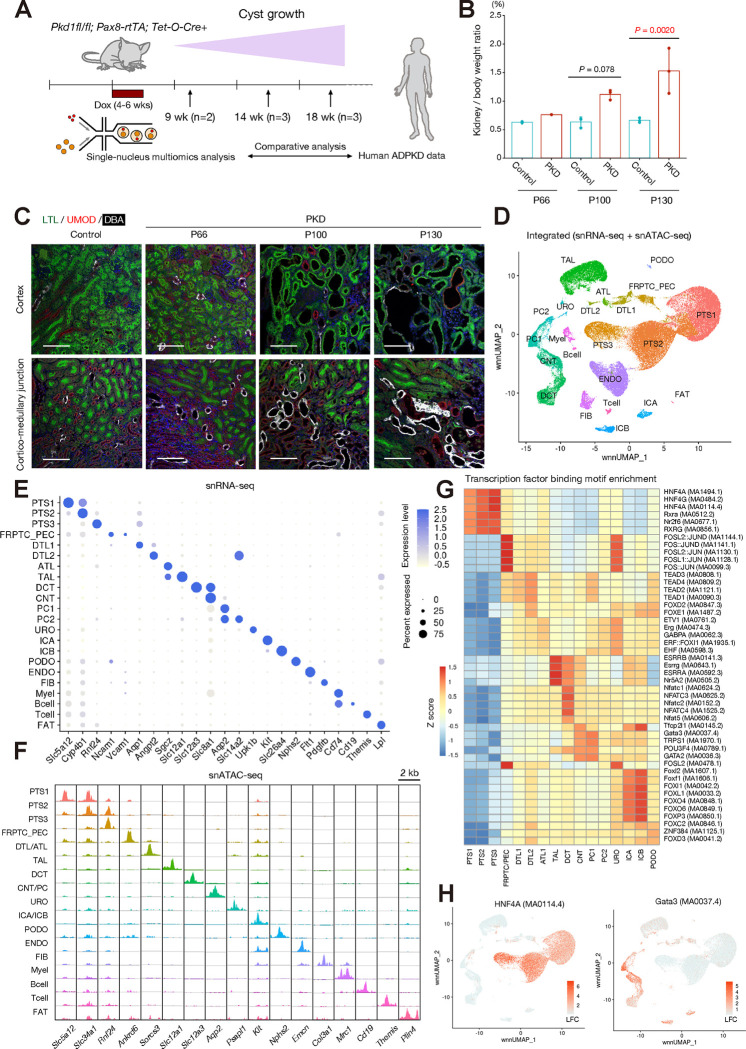
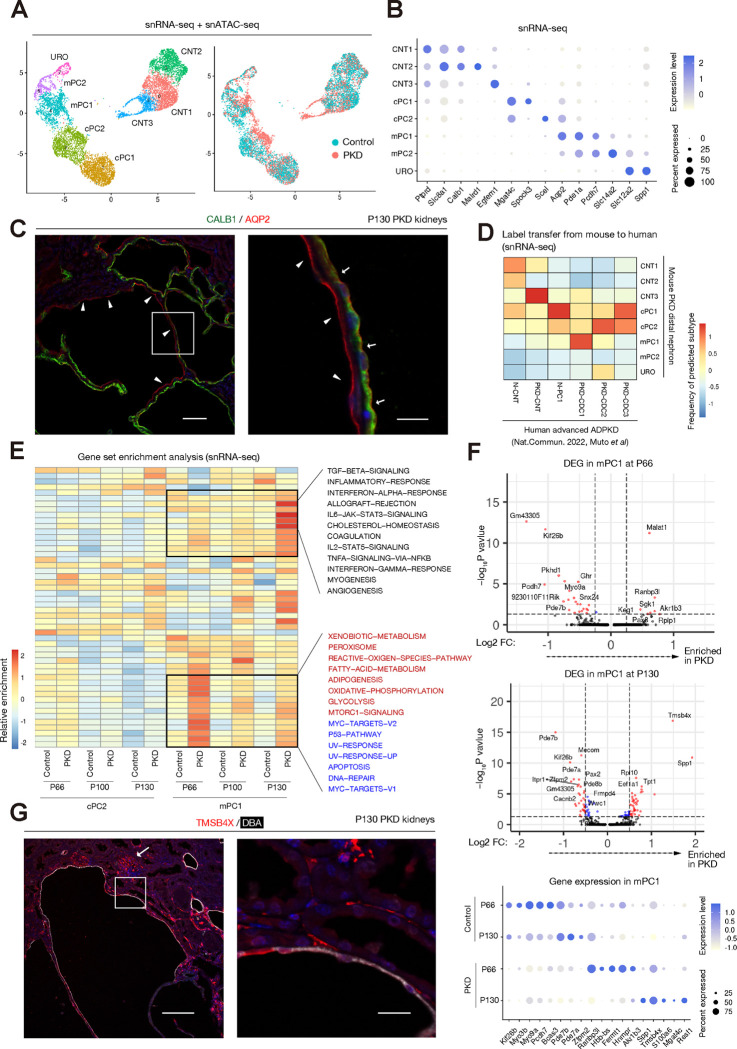
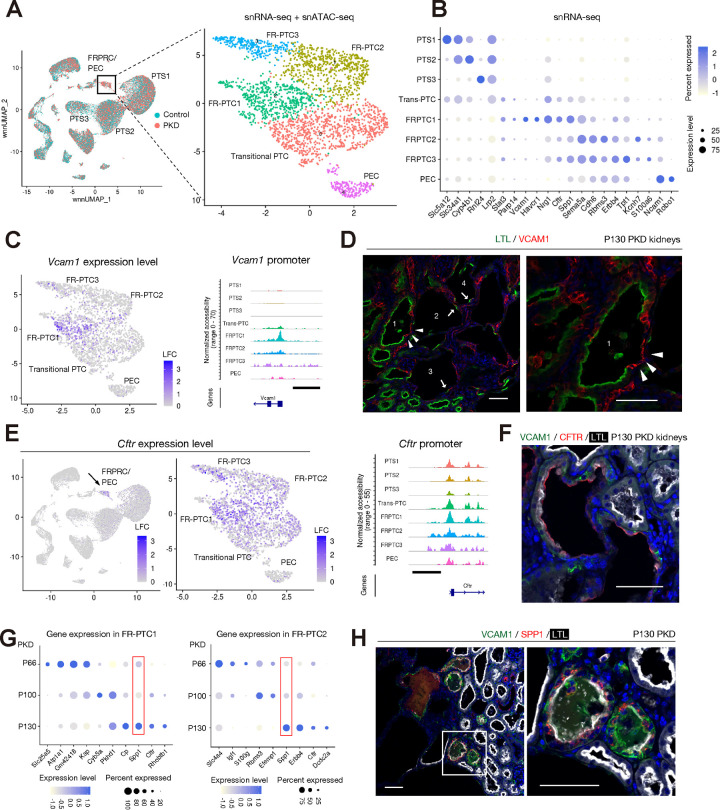
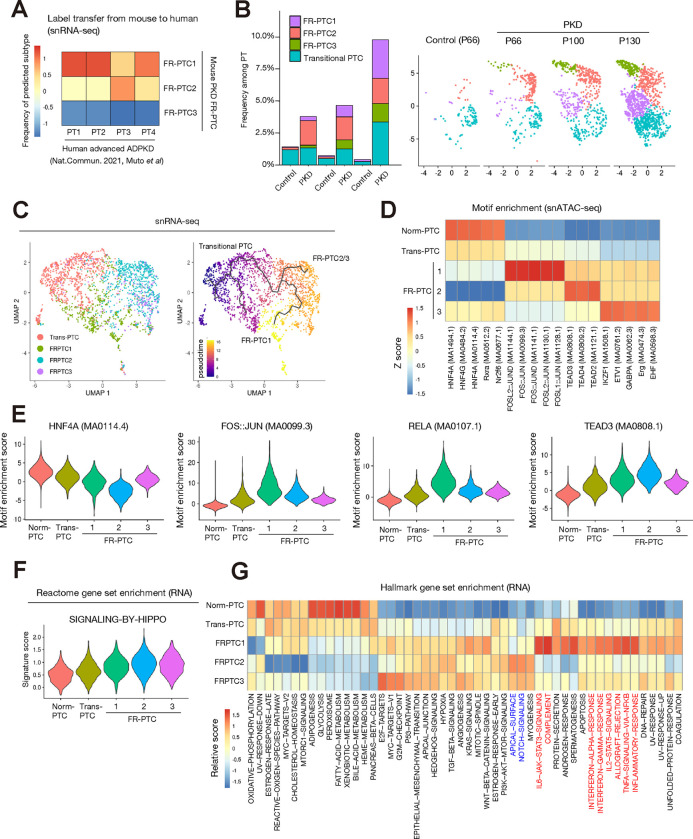
Autosomal dominant polycystic kidney disease (ADPKD) is the most common hereditary kidney disease and causes significant morbidity, ultimately leading to end-stage kidney disease. PKD pathogenesis is characterized by complex and dynamic alterations in multiple cell types during disease progression, hampering a deeper understanding of disease mechanism and the development of therapeutic approaches. Here, we generate a single nucleus multimodal atlas of an orthologous mouse PKD model at early, mid and late timepoints, consisting of 125,434 single-nucleus transcriptomic and epigenetic multiomes. We catalogue differentially expressed genes and activated epigenetic regions in each cell type during PKD progression, characterizing cell-type-specific responses to Pkd1 deletion. We describe heterogeneous, atypical collecting duct cells as well as proximal tubular cells that constitute cyst epithelia in PKD. The transcriptional regulation of the cyst lining cell marker GPRC5A is conserved between mouse and human PKD cystic epithelia, suggesting shared gene regulatory pathways. Our single nucleus multiomic analysis of mouse PKD provides a foundation to understand the earliest changes molecular deregulation in a mouse model of PKD at a single-cell resolution.


Conflict of interest statement

Competing Interest Statement: B.D.H. is a consultant for Janssen Research & Development, LLC, Pfizer and Chinook Therapeutics, holds equity in Chinook Therapeutics and grant funding from Chinook Therapeutics and Janssen Research & Development, LLC. O.M.W has received grants from AstraZeneca unrelated to the current work. The remaining authors declare no competing interests.

Figures

Figure 1.
Figure 1.. Single nucleus multiomics profiling for mouse PKD kidneys
(A) Overview of experimental strategy. Single nucleus multiomics atlas was generated from PKD model mouse kidneys and littermate control kidneys along a time course (three time points; postnatal day 66 (P66), 100 (P100) or 130 (P130) after Pkd1 deletion (n = 2–3 pairs for each time point). (B) The kidney to body weight ratio of the PKD and control mice that we have analyzed by multiomics analysis. Bar graphs represent the mean and error bars are the s.d. One-way ANOVA with post hoc Turkey test. (C) Representative immunofluorescence images of lotus tetragonolobus lectin (LTL, green), uromodulin (UMOD, red) and lectin Dolichos biflorus agglutinin (DBA, white) in the cortex (upper) or corticomedullary junction (lower) in the kidneys (control [P100], PKD [P66, P100 and P130]). Scale bar indicates 100 μm. (D) UMAP plot of the integrated single nucleus multiomics dataset with weighted nearest neighbor (wnn) clustering. Clusters were annotated by lineage marker gene expression. PTS1/S2/S3, proximal tubule S1/S2/S3 segments; FRPTC_PEC, failed-repair proximal tubular cells and parietal epithelial cells; DTL1/DTL2/ATL, descending thin limb 1/2 and ascending thin limb of Henle’s loop; TAL, thick ascending limb of Henle’s loop; DCT, distal convoluted tubule; CNT, connecting tubule; PC1/2, principle cells 1/2; URO, uroepithelial cells; ICA, Type A intercalated cells; ICB, Type B intercalated cells; PODO, podocytes; ENDO, endothelial cells; FIB, fibroblasts; Myel, myeoloid cells; FAT, adipocyte. (E) Dot plot showing gene expression patterns of cluster-enriched markers for the integrated dataset. The diameter of the dot corresponds to the proportion of cells expressing the indicated gene and the density of the dot corresponds to average expression relative to all cell types. (F) Fragment coverage (frequency of Tn5 insertion) around the differentially accessible regions (DAR) around each cell type at lineage marker gene transcription start sites. Scale bar indicates 2 kbp. (G) Heatmap showing averaged enrichment for the most enriched transcription factor binding motifs in each cell type. (H) UMAP plot showing chromVAR motif enrichment scores in the dataset for HNF4A (MA0114.4, left) and GATA3 (MA0037.4, right). The color scale represents a normalized log-fold-change (LFC).
Figure 2.
Figure 2.. Heterogeneity of collecting duct principal cells in mouse PKD
(A) Sub-clustering of distal nephron clusters (CNT, PC1, PC2 and URO) on the UMAP plot. cPC, cortical principal cells; mPC, medullary principal cells. (B) Dot plot showing expressions of the genes enriched in each of the subtypes. The diameter of the dot corresponds to the proportion of cells expressing the indicated gene and the density of the dot corresponds to average expression. (C) Representative immunofluorescence images of CALB1 (green) and AQP2 (red) in the PKD kidneys at P130. Arrowheads indicate AQP2+ cyst lining. Arrows mark AQP2+/CALB1+ cyst lining. Scale bar indicates 100 μm (left) or 12.5 μm (right). (D) Distal nephron subtypes in the human advanced ADPKD data are label-transferred from those in the mouse PKD data, and the frequencies of predicted mouse subtypes in each human subtype are shown on the heatmap. (E) Heatmap showing enrichment of gene expressions of the hallmark gene sets among cPC2 and mPC1 clusters at each time point. The pathways associated DNA damage response are in blue characters and those associated with metabolic regulation are in red characters (F) Volcano plot showing differentially expressed genes in mPC1 of PKD mice compared to that of control at P66 (upper) or P130 (middle). The x-axis represents the log fold change, and the y-axis represents the p value with corresponding expressions. Dot plot showing differential gene expressions in mPC1 between PKD and control at P66 (upper) or P130 (middle). Dot plot (low) showing expressions of the representative genes in mPC1 at P66 and P130. The diameter of the dot corresponds to the proportion of cells expressing the indicated gene and the density of the dot corresponds to average expression. (G) Representative immunofluorescence images of DBA (green) and TMSB4X (red) in the PKD kidneys at P130. An arrow indicates a glomerulus. Scale bar indicates 100 μm (left) or 15 μm (right).
Figure 3.
Figure 3.. Heterogeneity of failed-repair proximal tubular cells in mouse PKD
(A) Sub-clustering of FRPTC_PEC cluster on the UMAP plot. (B) Dot plot showing expressions of the genes enriched in each of the subtypes. The diameter of the dot corresponds to the proportion of cells expressing the indicated gene and the density of the dot corresponds to average expression. (C) UMAP plot showing a gene expression level of Vcam1 (left) and coverage plot showing accessible regions around Vcam1 promoter in each subtype was also shown (right). The color scale represents a normalized log-fold-change (LFC, left). The scale bar indicates 2 kbp (right). (D) Representative immunofluorescence images of LTL (green) and VCAM1 (red) in the PKD kidneys at P130. Arrowheads indicate VCAM1+ FR-PTCs replacing LTL+ PTC in the cyst1. Arrows mark LTL+ cyst lining in the cysts2–4, which have acquired LTL-VCAM1-epithelial lining. Scale bar indicates 50 μm. (E) UMAP plot showing a gene expression level of Cftr (left) and coverage plot showing accessible regions around Cftr promoter in each subtype (right). The color scale represents a normalized LFC. The scale bar indicates 2 kbp (right). (F) Representative immunofluorescence image of VCAM1 (green), CFTR (red) and LTL (white) in the PKD kidneys at P130. Scale bar indicates 50 μm. (G) Dot plot showing expressions of the differentially expressed genes at different time points in FRPTC1 (left) or FRPTC2 (right). The diameter of the dot corresponds to the proportion of cells expressing the indicated gene and the density of the dot corresponds to average expression. (H) Representative immunofluorescence images of VCAM1 (green), SPP1 (red) and LTL (white) in the PKD kidneys at P130. Scale bar indicates 50 μm.
Figure 4.
Figure 4.. Differentially activated molecular signaling pathways among PT subtypes in PKD
(A) Proximal tubular cell subtypes of human advanced ADPKD data are label-transferred from FR-PTC subtypes in mouse PKD data, and the frequencies of predicted mouse subtypes in each human subtype are shown on the heatmap. (B) Frequency of each PT subtype among whole PTC for each time point in PKD or control data (left). UMAP plot showing FRPTC subtypes at each time point (right). (C) Pseudotemporal trajectories to model differentiation from transitional PT to FR-PTC subtypes, constructed with snRNA-seq. Colored by the subtypes (left) or pseudotime (right). (D) Heatmap showing relative transcription factor binding motif enrichment among PT subtypes in snATAC-seq. Most enriched transcription binding motifs in each subtype are shown. (E) Violin plots displaying relative motif enrichment (chromVAR score) among PTC for HNF4A (MA0114.4), JUN::FOS (MA0099.3), RELA (MA0107.1) or TEAD3 (MA0808.1) (F) Violin plots displaying relative gene set enrichment among PTC for REACTOME-SIGNALING-BY-HIPPO. (G) Heatmap showing relative enrichment of hallmark gene sets among PT subtypes in snRNA-seq. The pathways related to cell polarity and notch signaling were in blue characters, and the inflammatory pathways are in red characters.
Figure 5.
Figure 5.. GPRC5A as a shared cyst lining cell marker for mouse and human PKD
(A, B) UMAP plot showing a gene expression level of Gprc5a in the whole dataset (A) or distal nephron sub-clustering (B). The color scale represents a normalized log-fold-change (LFC). (C) Representative immunofluorescence images of LTL (green), GPRC5A (red) and DBA (white) in the PKD kidneys at P130. Arrowheads indicate GPRC5A+DBA+ cyst lining. Scale bar indicates 50 μm. (D) UMAP plot showing a gene expression level of Gprc5a in the FR-PTC sub-clustering. The color scale represents a normalized LFC. (E, F) Representative immunofluorescence images of VCAM1(green), GPRC5A (red) and LTL (white) in the PKD kidneys at P130. Arrowheads indicate cyst lining with GPRC5A mutually exclusive with LTL (E) or colocalized with VCAM1 (F). The arrows indicate VCAM1+ atrophic tubules. Scale bar indicates 50 μm. (G, H) Representative immunofluorescence images of LTL (green), GPRC5A (red) and DBA (white) in the Pkd1RC/RC mouse cystic kidneys at 11 months of age (G) or Six2-Cre; Pkd1F/F cystic kidneys at P7 (H). Scale bar indicates 50 μm (G) or 100, 10 μm (H). (I) Cis-coaccessibility network (CCAN, gray arcs) of a conserved cis-regulatory region (CRE) 5’ distal to Gprc5a promoter in the mouse PKD FR-PTC (lower) or human ADPKD (upper) among accessible regions (red boxes) is shown. (J) Coverage plot showing accessibility of conserved CRE 5’ distal to Gprc5a gene among PT subtypes (upper). The conserved CRE has several TEAD family binding motifs both in human and mice. (K) Quantitative PCR for GPRC5A expression in primary human PTC with siRNA knockdown of LATS1 and LATS2 (upper). n = 3 biological replicates with two-sided Student’s t-test. LATS1/2 knockdown inhibits Hippo pathway, activating TEAD and subsequently up-regulating GPRC5A expression (lower). Bar graphs represent the mean and error bars are the s.d. Student’s t-test. Schematic was created with BioRender.

Similar articles

References

    1. Torres V. E., Harris P. C., Pirson Y., Autosomal dominant polycystic kidney disease. Lancet 369, 1287–1301 (2007). - PubMed
    1. Fedeles S. V., Gallagher A.-R., Somlo S., Polycystin-1: a master regulator of intersecting cystic pathways. Trends Mol Med 20, 251–260 (2014). - PMC - PubMed
    1. Menezes L. F., Germino G. G., The pathobiology of polycystic kidney disease from a metabolic viewpoint. Nat Rev Nephrol 15, 735–749 (2019). - PubMed
    1. Torres V. E., et al., Tolvaptan in patients with autosomal dominant polycystic kidney disease. N Engl J Med 367, 2407–2418 (2012). - PMC - PubMed
    1. Wu H., Kirita Y., Donnelly E. L., Humphreys B. D., Advantages of Single-Nucleus over Single-Cell RNA Sequencing of Adult Kidney: Rare Cell Types and Novel Cell States Revealed in Fibrosis. J. Am. Soc. Nephrol. 30, 23–32 (2019). - PMC - PubMed

Publication types