A spatiotemporal map of co-receptor signaling networks underlying B cell activation
- PMID: 38850533
- PMCID: PMC11256977
- DOI: 10.1016/j.celrep.2024.114332
A spatiotemporal map of co-receptor signaling networks underlying B cell activation
Abstract
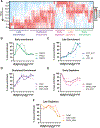
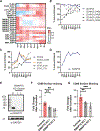
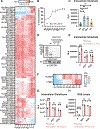
The B cell receptor (BCR) signals together with a multi-component co-receptor complex to initiate B cell activation in response to antigen binding. Here, we take advantage of peroxidase-catalyzed proximity labeling combined with quantitative mass spectrometry to track co-receptor signaling dynamics in Raji cells from 10 s to 2 h after BCR stimulation. This approach enables tracking of 2,814 proximity-labeled proteins and 1,394 phosphosites and provides an unbiased and quantitative molecular map of proteins recruited to the vicinity of CD19, the signaling subunit of the co-receptor complex. We detail the recruitment kinetics of signaling effectors to CD19 and identify previously uncharacterized mediators of B cell activation. We show that the glutamate transporter SLC1A1 is responsible for mediating rapid metabolic reprogramming and for maintaining redox homeostasis during B cell activation. This study provides a comprehensive map of BCR signaling and a rich resource for uncovering the complex signaling networks that regulate activation.
Keywords: B cell signaling; CP: Immunology; co-receptor; phosphoproteomics; proteomics; proximity labeling.
Copyright © 2024 The Authors. Published by Elsevier Inc. All rights reserved.
Conflict of interest statement
Declaration of interests A.C.K. is a co-founder and consultant for biotechnology companies Tectonic Therapeutic Inc. and Seismic Therapeutic Inc., as well as for the Institute for Protein Innovation, a non-profit research institute. S.C.B. is on the scientific advisory board for and receives funding from Erasca, Inc. for an unrelated project; is an advisor to MPM Capital; and is a consultant for IFM, Scorpion Therapeutics, Odyssey Therapeutics, Droia Ventures, and Ayala Pharmaceuticals for unrelated projects.
Figures


Update of
-
A Spatiotemporal Map of Co-Receptor Signaling Networks Underlying B Cell Activation.bioRxiv [Preprint]. 2023 Mar 21:2023.03.17.533227. doi: 10.1101/2023.03.17.533227. bioRxiv. 2023. Update in: Cell Rep. 2024 Jun 25;43(6):114332. doi: 10.1016/j.celrep.2024.114332 PMID: 36993395 Free PMC article. Updated. Preprint.
Similar articles
-
Erratum: Eyestalk Ablation to Increase Ovarian Maturation in Mud Crabs.J Vis Exp. 2023 May 26;(195). doi: 10.3791/6561. J Vis Exp. 2023. PMID: 37235796
-
A Spatiotemporal Map of Co-Receptor Signaling Networks Underlying B Cell Activation.bioRxiv [Preprint]. 2023 Mar 21:2023.03.17.533227. doi: 10.1101/2023.03.17.533227. bioRxiv. 2023. Update in: Cell Rep. 2024 Jun 25;43(6):114332. doi: 10.1016/j.celrep.2024.114332 PMID: 36993395 Free PMC article. Updated. Preprint.
-
TAPP1 and TAPP2 are targets of phosphatidylinositol 3-kinase signaling in B cells: sustained plasma membrane recruitment triggered by the B-cell antigen receptor.Mol Cell Biol. 2002 Aug;22(15):5479-91. doi: 10.1128/MCB.22.15.5479-5491.2002. Mol Cell Biol. 2002. PMID: 12101241 Free PMC article.
-
Depressing time: Waiting, melancholia, and the psychoanalytic practice of care.In: Kirtsoglou E, Simpson B, editors. The Time of Anthropology: Studies of Contemporary Chronopolitics. Abingdon: Routledge; 2020. Chapter 5. In: Kirtsoglou E, Simpson B, editors. The Time of Anthropology: Studies of Contemporary Chronopolitics. Abingdon: Routledge; 2020. Chapter 5. PMID: 36137063 Free Books & Documents. Review.
-
Antibody tests for identification of current and past infection with SARS-CoV-2.Cochrane Database Syst Rev. 2022 Nov 17;11(11):CD013652. doi: 10.1002/14651858.CD013652.pub2. Cochrane Database Syst Rev. 2022. PMID: 36394900 Free PMC article. Review.
Cited by
-
Structural basis of the excitatory amino acid transporter 3 substrate recognition.bioRxiv [Preprint]. 2024 Sep 8:2024.09.05.611541. doi: 10.1101/2024.09.05.611541. bioRxiv. 2024. PMID: 39282329 Free PMC article. Preprint.
-
Both sides now: evolutionary traits of antigens and B cells in tolerance and activation.Front Immunol. 2024 Aug 9;15:1456220. doi: 10.3389/fimmu.2024.1456220. eCollection 2024. Front Immunol. 2024. PMID: 39185403 Free PMC article. Review.
-
B cell receptor-induced protein dynamics and the emerging role of SUMOylation revealed by proximity proteomics.J Cell Sci. 2023 Aug 1;136(15):jcs261119. doi: 10.1242/jcs.261119. Epub 2023 Aug 8. J Cell Sci. 2023. PMID: 37417469 Free PMC article.
References
-
- Kristyanto H, Blomberg NJ, Slot LM, van der Voort EIH, Kerkman PF, Bakker A, Burgers LE, ten Brinck RM, van der Helm-van Mil AHM, Spits H, et al. (2020). Persistently activated, proliferative memory autoreactive B cells promote inflammation in rheumatoid arthritis. Sci. Transl. Med. 12, eaaz5327. 10.1126/scitranslmed.aaz5327. - DOI - PMC - PubMed
MeSH terms
Substances
Grants and funding
LinkOut - more resources
Full Text Sources
Miscellaneous

