

Genome-wide association study and expression of candidate genes for Fe and Zn concentration in sorghum grains
- PMID: 38830906
- PMCID: PMC11148041
- DOI: 10.1038/s41598-024-63308-0
Genome-wide association study and expression of candidate genes for Fe and Zn concentration in sorghum grains
Abstract
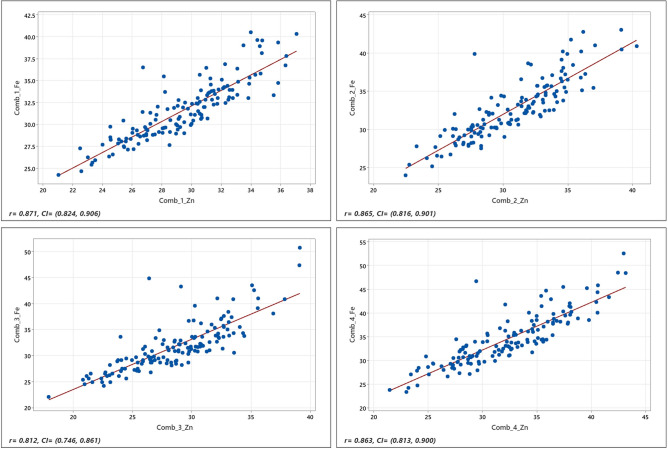
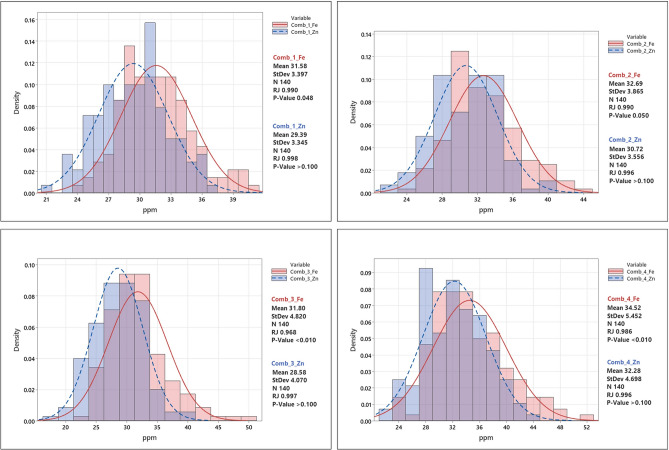
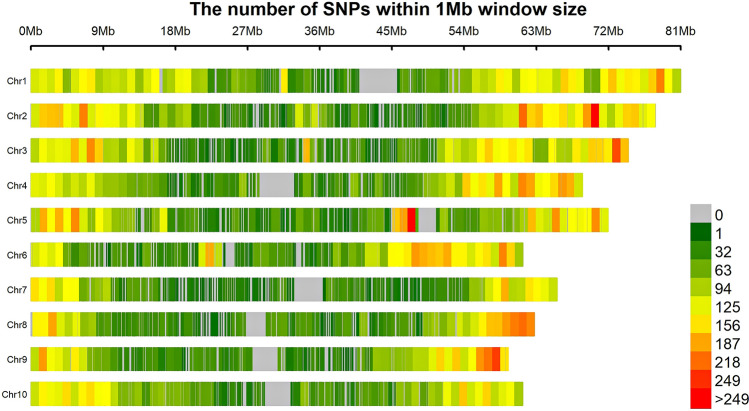
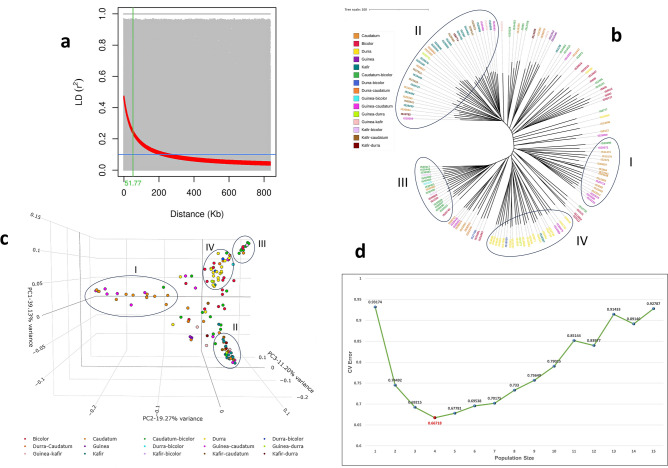
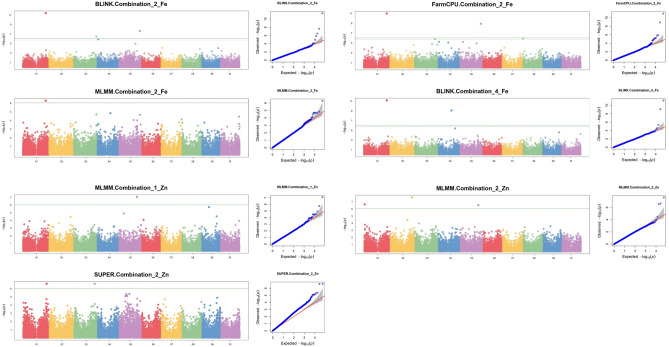
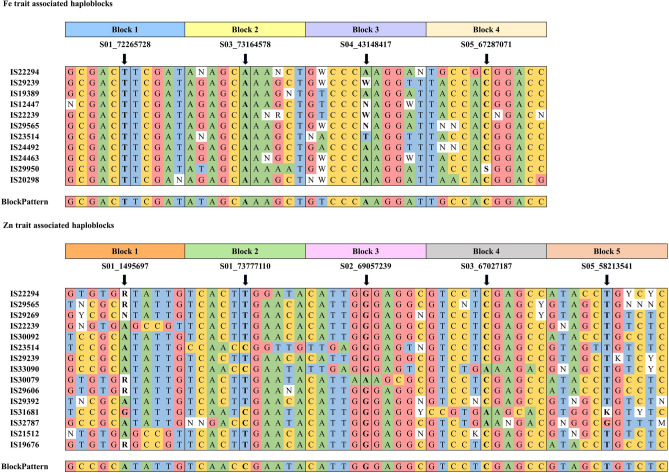
Sorghum germplasm showed grain Fe and Zn genetic variability, but a few varieties were biofortified with these minerals. This work contributes to narrowing this gap. Fe and Zn concentrations along with 55,068 high-quality GBS SNP data from 140 sorghum accessions were used in this study. Both micronutrients exhibited good variability with respective ranges of 22.09-52.55 ppm and 17.92-43.16 ppm. Significant marker-trait associations were identified on chromosomes 1, 3, and 5. Two major effect SNPs (S01_72265728 and S05_58213541) explained 35% and 32% of Fe and Zn phenotypic variance, respectively. The SNP S01_72265728 was identified in the cytochrome P450 gene and showed a positive effect on Fe accumulation in the kernel, while S05_58213541 was intergenic near Sobic.005G134800 (zinc-binding ribosomal protein) and showed negative effect on Zn. Tissue-specific in silico expression analysis resulted in higher levels of Sobic.003G350800 gene product in several tissues such as leaf, root, flower, panicle, and stem. Sobic.005G188300 and Sobic.001G463800 were expressed moderately at grain maturity and anthesis in leaf, root, panicle, and seed tissues. The candidate genes expressed in leaves, stems, and grains will be targeted to improve grain and stover quality. The haplotypes identified will be useful in forward genetics breeding.
© 2024. The Author(s).
Conflict of interest statement
The authors declare no competing interests.
Figures

Similar articles
-
Pilot-scale genome-wide association mapping in diverse sorghum germplasms identified novel genetic loci linked to major agronomic, root and stomatal traits.Sci Rep. 2023 Dec 8;13(1):21917. doi: 10.1038/s41598-023-48758-2. Sci Rep. 2023. PMID: 38081914 Free PMC article.
-
Genome-wide association study uncovers genomic regions associated with grain iron, zinc and protein content in pearl millet.Sci Rep. 2020 Nov 10;10(1):19473. doi: 10.1038/s41598-020-76230-y. Sci Rep. 2020. PMID: 33173120 Free PMC article.
-
Genome-wide association analysis reveals seed protein loci as determinants of variations in grain mold resistance in sorghum.Theor Appl Genet. 2021 Apr;134(4):1167-1184. doi: 10.1007/s00122-020-03762-2. Epub 2021 Jan 16. Theor Appl Genet. 2021. PMID: 33452894
-
Genetic Architecture of Grain Yield-Related Traits in Sorghum and Maize.Int J Mol Sci. 2022 Feb 22;23(5):2405. doi: 10.3390/ijms23052405. Int J Mol Sci. 2022. PMID: 35269548 Free PMC article. Review.
-
Improving Zinc and Iron Biofortification in Wheat through Genomics Approaches.Mol Biol Rep. 2022 Aug;49(8):8007-8023. doi: 10.1007/s11033-022-07326-z. Epub 2022 Jun 3. Mol Biol Rep. 2022. PMID: 35661970 Free PMC article. Review.
Cited by
-
Genomic resources, opportunities, and prospects for accelerated improvement of millets.Theor Appl Genet. 2024 Nov 20;137(12):273. doi: 10.1007/s00122-024-04777-9. Theor Appl Genet. 2024. PMID: 39565376 Free PMC article. Review.
References
-
- FAO. World Food and Agriculture—Statistical Yearbook 2021. Rome (2021). 10.4060/cb4477en.
-
- WHO. Malnutrition. https://www.who.int/news-room/fact-sheets/detail/malnutrition (2021a). Accessed 4 Sept 2023.
-
- WHO. Children: improving survival and well-being. https://www.who.int/news-room/fact-sheets/detail/children-reducing-morta... (2020). Accessed 21 Aug 2023.
-
- WHO. World Health Statistics 2022: Monitoring Health for the SDGs, Sustainable Development Goals. Geneva: World Health Organization; 2022. Licence: CC BY-NC-SA 3.0 IGO. ISBN 978-92-4-005114-0 (2022).
-
- WHO. World Health Statistics 2023: Monitoring Health for the SDGs, Sustainable Development Goals. Geneva: World Health Organization; 2023. Licence: CC BY-NC-SA 3.0 IGO (2023a).
MeSH terms
Substances
LinkOut - more resources
Full Text Sources
Medical
Miscellaneous
