. 2024 Jun 3;20(6):e1011308.
doi: 10.1371/journal.pgen.1011308. eCollection 2024 Jun.

Myeloid Targeted Human MLL-ENL and MLL-AF9 Induces cdk9 and bcl2 Expression in Zebrafish Embryos

Affiliations

Myeloid Targeted Human MLL-ENL and MLL-AF9 Induces cdk9 and bcl2 Expression in Zebrafish Embryos

Alex J Belt et al. PLoS Genet. .

Abstract

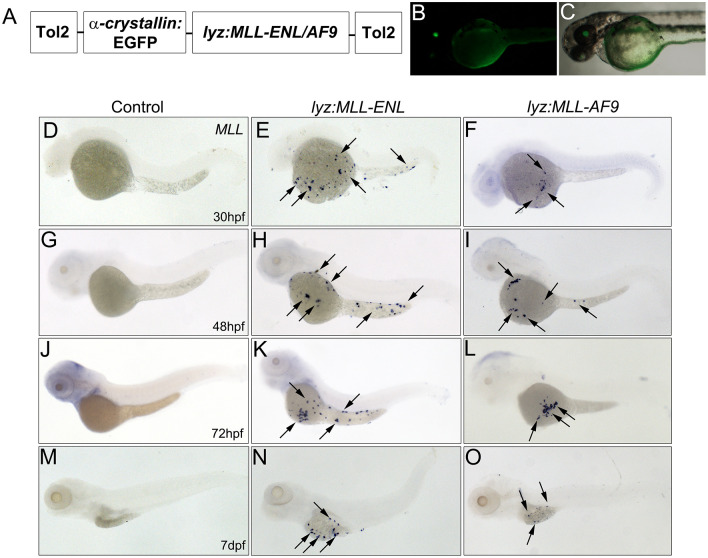
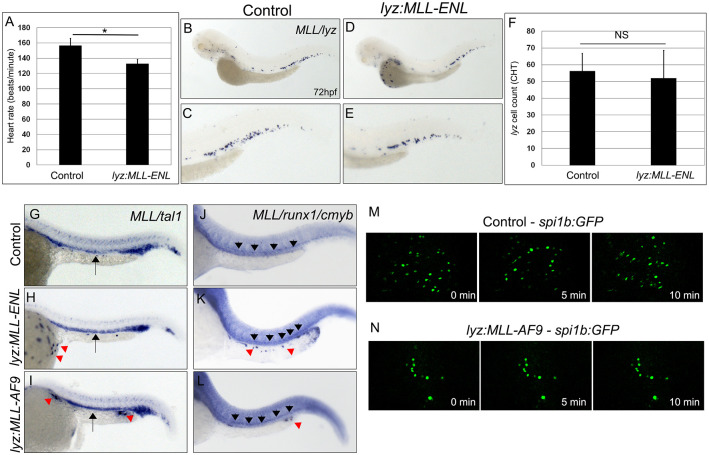
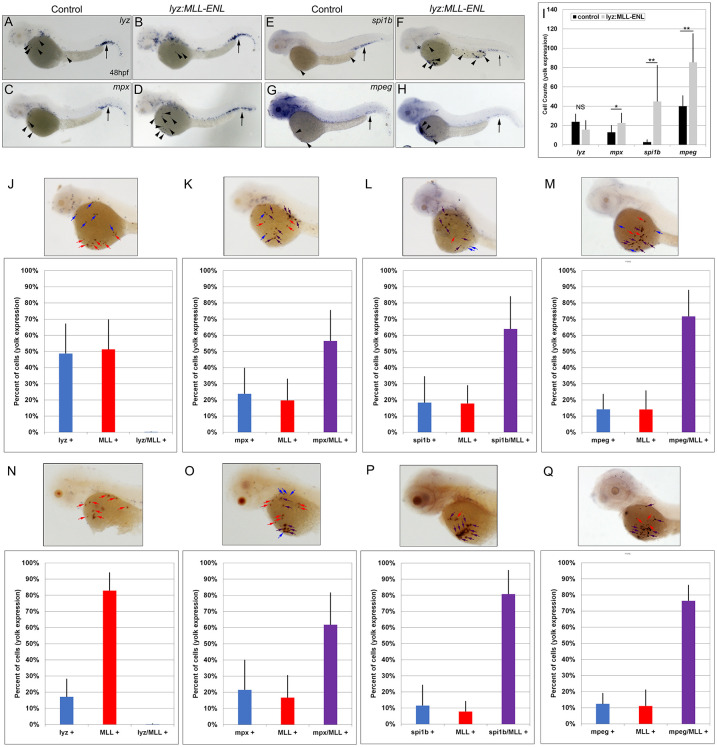
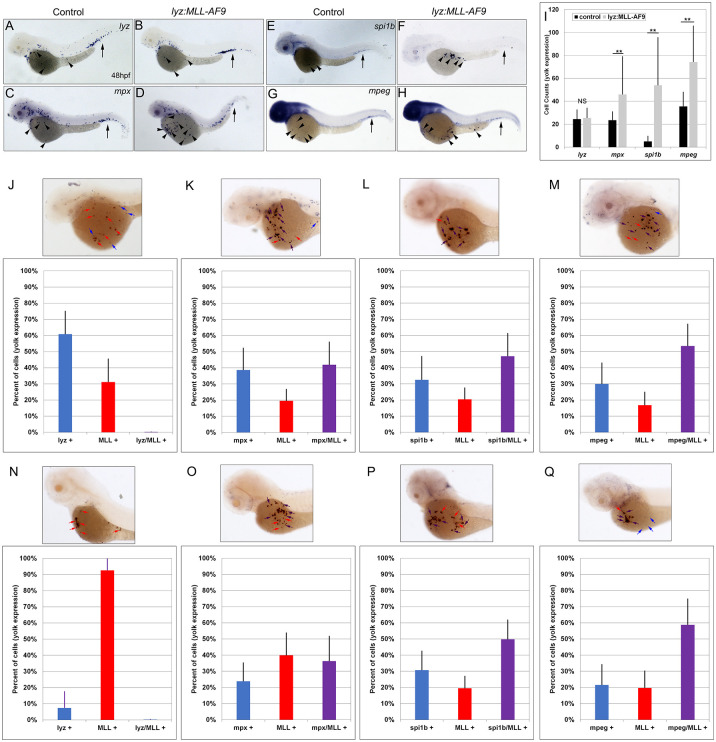
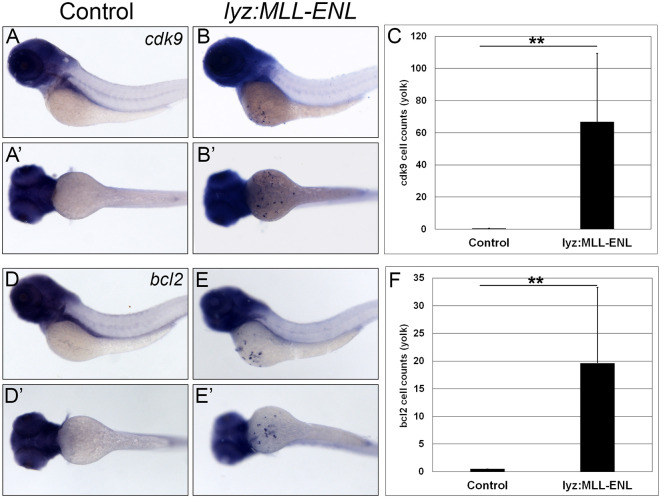
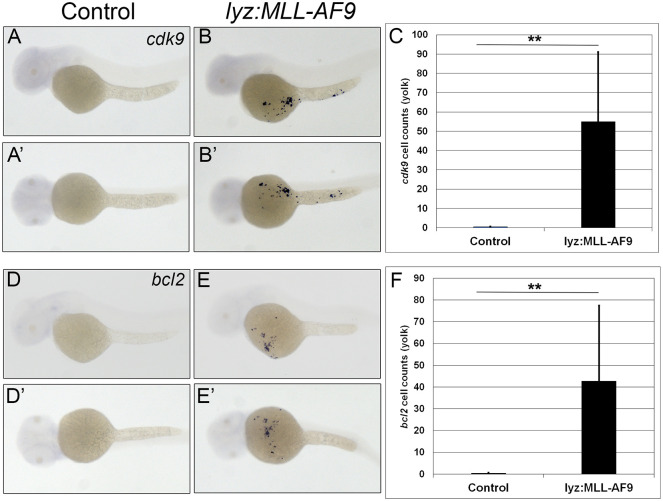
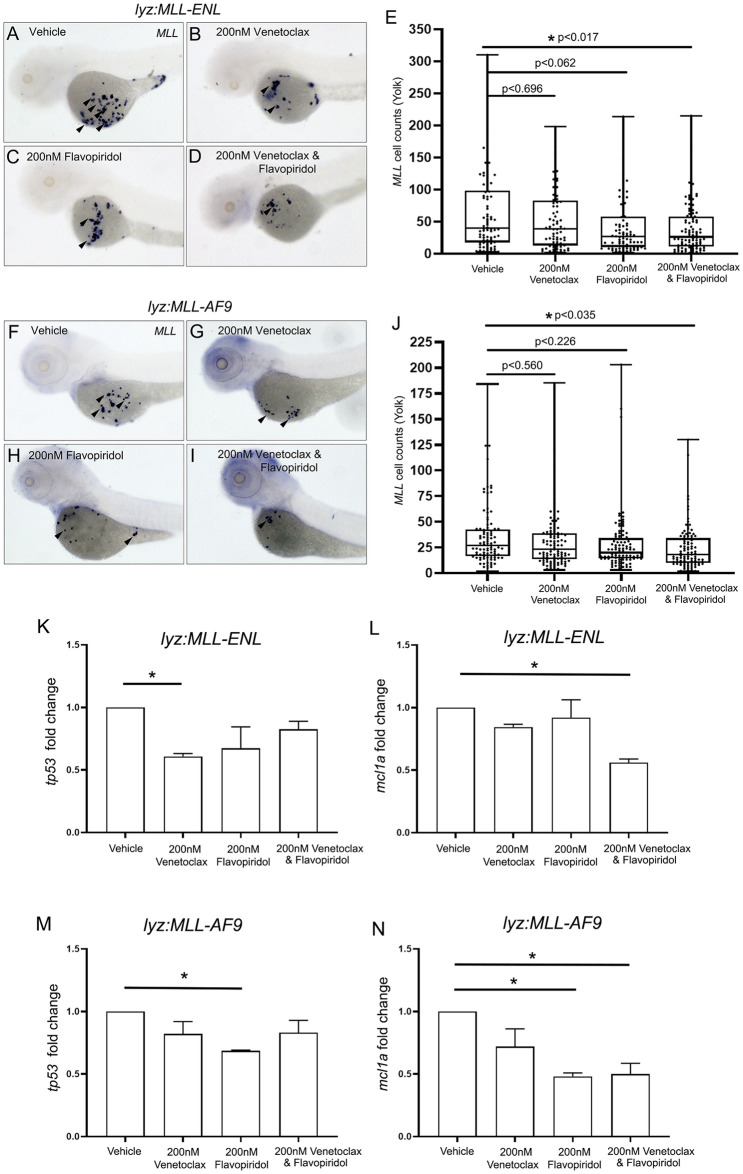
Acute myeloid leukemia (AML) accounts for greater than twenty thousand new cases of leukemia annually in the United States. The average five-year survival rate is approximately 30%, pointing to the need for developing novel model systems for drug discovery. In particular, patients with chromosomal rearrangements in the mixed lineage leukemia (MLL) gene have higher relapse rates with poor outcomes. In this study we investigated the expression of human MLL-ENL and MLL-AF9 in the myeloid lineage of zebrafish embryos. We observed an expansion of MLL positive cells and determined these cells colocalized with the myeloid markers spi1b, mpx, and mpeg. In addition, expression of MLL-ENL and MLL-AF9 induced the expression of endogenous bcl2 and cdk9, genes that are often dysregulated in MLL-r-AML. Co-treatment of lyz: MLL-ENL or lyz:MLL-AF9 expressing embryos with the BCL2 inhibitor, Venetoclax, and the CDK9 inhibitor, Flavopiridol, significantly reduced the number of MLL positive cells compared to embryos treated with vehicle or either drug alone. In addition, cotreatment with Venetoclax and Flavopiridol significantly reduced the expression of endogenous mcl1a compared to vehicle, consistent with AML. This new model of MLL-r-AML provides a novel tool to understand the molecular mechanisms underlying disease progression and a platform for drug discovery.


Conflict of interest statement

The authors have declared that no competing interests.

Figures

Fig 1
Fig 1. MLL is expressed on the yolk of lyz:MLL-ENL and lyz:MLL-AF9 injected embryos.
Diagram of the lyz:MLL-ENL/AF9 construct used in the study (A). The α-crystallin promoter drives expression of EGFP in the lens of lyz:MLL-ENL/AF9 injected embryos (B,C). MLL expression (all panels) was identified on the yolk of lyz:MLL-ENL and lyz:MLL-AF9 embryos (arrows) but was absent from controls at 30 hpf (D-F), 48 hpf (G-I), 72 hpf (J-L) and 7 dpf (M-O).
Fig 2
Fig 2. Accumulation of MLL positive cells on the yolk results from migration defects and not cardiovascular or hematopoietic defects.
Average heart rates of control and lyz:MLL-ENL injected embryos at 48 hpf (A, N = 10). MLL (yolk) and lyz expression in control (B,C) and MLL-ENL expressing embryos (D,E). The number of lyz positive cells in the CHT in control and lyz:MLL-ENL injected embryos at 72 hpf (F, N = 12–18). MLL/Tal1 (G-I, arrows–tal1, red arrowheads-MLL, 24 hpf) and MLL/runx1/cmyb (J-L, black arrowheads-runx1/cmyb, red arrowheads-MLL, 36 hpf) expression were analyzed in control (G,J, N = 15–30), lyz:MLL-ENL (H,K, N = 13–30), and lyz:MLL-AF9 (I,L, N = 17–25) embryos. Still images at 0, 5 and 10 minutes from spi1b:GFP timelapse videos for control (M) and lyz:MLL-AF9 (N) embryos. Statistical analysis was conducted using student’s t-test. * p<0.05. Anterior to the left.
Fig 3
Fig 3. MLL expression colocalized with mpx, spi1b, and mpeg expression on the yolk of lyz:MLL-ENL injected embryos at 48 and 72 hpf.
Expression of lyz, mpx, spi1b, and mpeg in control (A,C,E,G) and lyz:MLL-ENL injected (B,D,F,H) embryos at 48 hpf. Black arrows indicate expression in the CHT, arrowheads indicate expression on the yolk (A-H). The number of cells on the yolk expressing lyz, mpx, spi1b, and mpeg was assessed at 48 hpf (I, N = 10–46). MLL colocalization with lyz (0%), mpx (56.5% +/- 18.9%), spi1b (63.9% +/- 20.0%), and mpeg (71.4% +/- 16.1%) was determined at 48 hpf (J-M, N = 17–42) and with lyz (0%), mpx (61.8% +/- 19.7%), spi1b (80.7% +/- 14.7%), and mpeg (76.4% +/- 9.6%) at 72hpf (N-Q, N = 15–63). Blue, red, and purple bars indicate the percentage of cells stained on the yolk that were myeloid single positive (blue arrows), MLL single positive (red arrows), or myeloid marker/MLL double positive (purple arrows), respectively (J-Q). Statistical analysis was conducted using student’s t-test. * p<0.05, ** p<0.01, NS = not significant. Anterior to the left.
Fig 4
Fig 4. MLL expression colocalized with mpx, spi1b, and mpeg expression on the yolk of lyz:MLL-AF9 injected embryos at 48 and 72 hpf.
Expression of lyz, mpx, spi1b, and mpeg in control (A,C,E,G) and lyz:MLL-AF9 injected (B,D,F,H) embryos at 48 hpf. Black arrows indicate expression in the CHT, arrowheads indicate expression on the yolk (A-H). The number of cells on the yolk expressing lyz, mpx, spi1b, and mpeg was assessed at 48 hpf (I, N = 31–62). MLL colocalization with lyz (0%), mpx (41.9% +/- 14.0%), spi1b (47.1% +/-14.1%), and mpeg (53.4% +/- 13.6%) was determined at 48 hpf (J-M, N = 37–52) and with lyz (0%), mpx (36.6% +/- 15.4%), spi1b (49.8% +/- 12.0%), and mpeg (58.8% +/- 16.0%) at 72hpf (N-Q, N = 26–34). Blue, red, and purple bars indicate the percentage of cells stained on the yolk that were myeloid single positive (blue arrow), MLL single positive (red arrow), or myeloid marker/MLL double positive (purple arrow), respectively (J-Q). Statistical analysis was conducted using student’s t-test. * p<0.05, ** p<0.01, NS = not significant. Anterior to the left.
Fig 5
Fig 5. Myeloid targeted MLL-ENL induced expression of cdk9 and bcl2 on the yolk.
Cdk9 was expressed on the yolk of lyz:MLL-ENL injected embryos (B lateral; B’, ventral) compared to control embryos (A,A’). Quantitative analysis of cdk9 positive cells on the yolk (C, N = 28). Bcl2 expression was observed on the yolk of lyz:MLL-ENL injected embryos (E lateral; E’, ventral) compared to control embryos (D,D’). Quantitative analysis of bcl2 positive cells on the yolk (F, N = 35). Statistical analysis was conducted using student’s t-test. ** p<0.01. Anterior to the left.
Fig 6
Fig 6. Myeloid targeted MLL-AF9 induced expression of cdk9 and bcl2 on the yolk.
Cdk9 was expressed on the yolk of lyz:MLL-AF9 injected embryos (B lateral; B’, ventral) compared to no expression on the yolk in control embryos (A,A’). Quantitative analysis of cdk9 positive cells on the yolk (C, N = 31). Bcl2 expression was observed on the yolk of lyz:MLL-AF9 injected embryos (E lateral; E’, ventral) compared to control embryos (D,D’). Quantitative analysis of bcl2 positive cells on the yolk (F, N = 30). Statistical analysis was conducted using students t-test. ** p<0.01. Anterior to the left.
Fig 7
Fig 7. Dose dependent effect of Venetoclax and Flavopiridol on myelopoiesis.
Embryos were treated with 100nM or 500nM of Venetoclax (A-M) or 100nM and 500nM Flavopiridol (N-Z) and assessed for expression of lyz (A-C, N-P, N = 10), mpx (D-F, Q-S, N = 16–19), mpeg (G-I, T-V, N = 20), and cmyb (J-L, W-Y, N = 16–20) by counting the number of positive cells expressing each marker in the CHT (M,Z). Arrows indicate marker gene expression in the CHT. Statistical analysis was conducted using one-way ANOVA followed by Tukey HSD. * p<0.05, ** p<0.01, NS = not significant. Anterior to the left.
Fig 8
Fig 8. Venetoclax and Flavopiridol co-treatment significantly reduced MLL expression on the yolk of lyz:MLL-ENL and lyz:MLL-AF9 injected embryos.
Lyz:MLL-ENL injected embryos were incubated with 200nM DMSO (A, N = 82), 200nM Venetoclax (B, N = 76), 200nM Flavopiridol (C, N = 84) or 200nM Venetoclax and Flavopiridol (D, N = 98) at 24 hpf and the number of MLL positive cells was assessed at 72 hpf (E). Lyz:MLL-AF9 injected embryos were incubated with 200nM DMSO (F, N = 96), 200nM Venetoclax (G, N = 105), 200nM Flavopiridol (H, N = 102) or 200nM Venetoclax and Flavopiridol (I, N = 95) at 24 hpf and the number of MLL positive cells was assessed at 72 hpf (E,J). Lyz:MLL-ENL (K,L) and lyz:MLL-AF9 (M,N) injected embryos were assessed for expression of tp53 and mcl1a by qPCR (N = 2). Statistical analysis was conducted using one-way ANOVA followed by Tukey HSD. * p<0.05. Anterior to the left.

Similar articles

Cited by

References

    1. DiNardo CD, Cortes JE. Mutations in AML: prognostic and therapeutic implications. Hematology Am Soc Hematol Educ Program. 2016;2016(1):348–55. doi: 10.1182/asheducation-2016.1.348 - DOI - PMC - PubMed
    1. Winters AC, Bernt KM. MLL-Rearranged Leukemias-An Update on Science and Clinical Approaches. Front Pediatr. 2017;5:4. doi: 10.3389/fped.2017.00004 - DOI - PMC - PubMed
    1. Meyer C, Burmeister T, Groger D, Tsaur G, Fechina L, Renneville A, et al.. The MLL recombinome of acute leukemias in 2017. Leukemia. 2018;32(2):273–84. doi: 10.1038/leu.2017.213 - DOI - PMC - PubMed
    1. Slany RK. The molecular mechanics of mixed lineage leukemia. Oncogene. 2016;35(40):5215–23. doi: 10.1038/onc.2016.30 - DOI - PubMed
    1. Mueller D, Bach C, Zeisig D, Garcia-Cuellar MP, Monroe S, Sreekumar A, et al.. A role for the MLL fusion partner ENL in transcriptional elongation and chromatin modification. Blood. 2007;110(13):4445–54. doi: 10.1182/blood-2007-05-090514 - DOI - PMC - PubMed

MeSH terms