. 2024 Jul 9;68(7):e0020124.
doi: 10.1128/aac.00201-24. Epub 2024 Jun 3.

Nanoparticle delivery of Tat synergizes with classical latency reversal agents to express HIV antigen targets

Affiliations

Nanoparticle delivery of Tat synergizes with classical latency reversal agents to express HIV antigen targets

Samuel L M Raines et al. Antimicrob Agents Chemother. .

Abstract

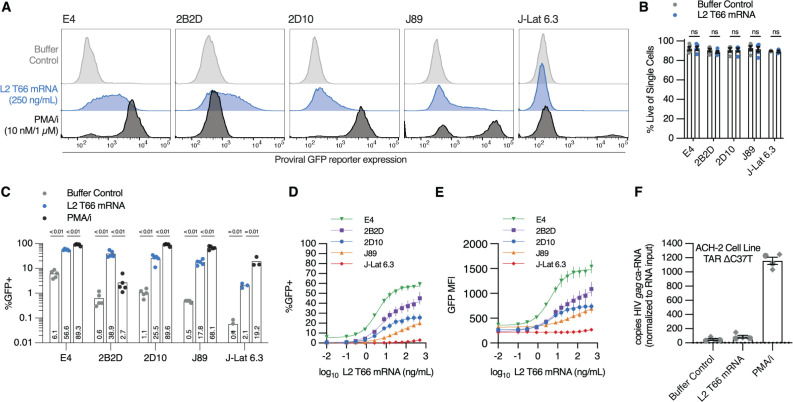
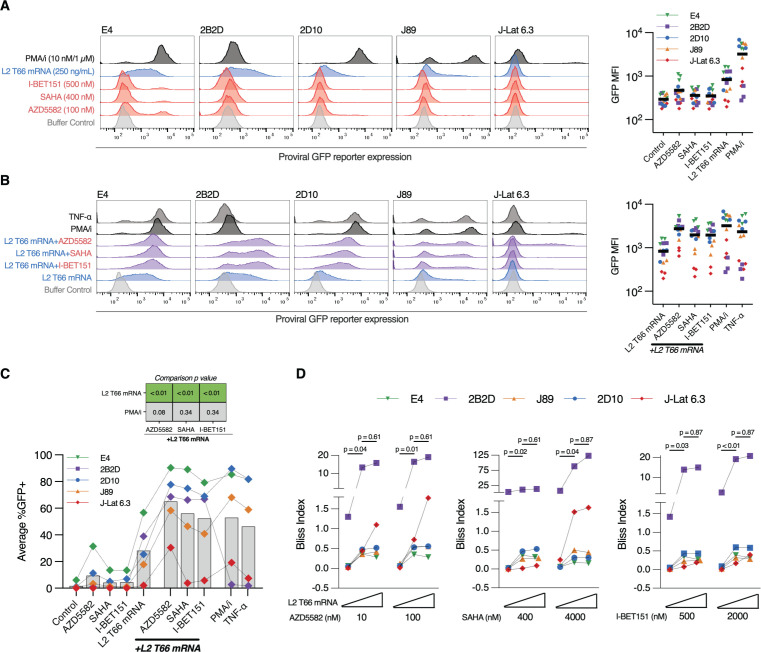
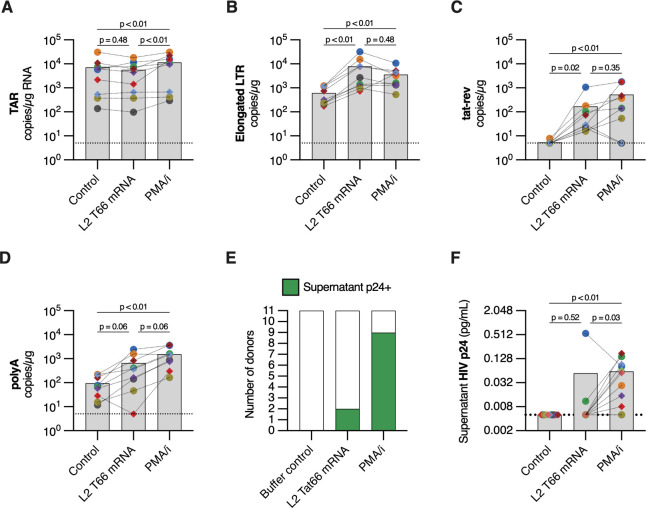
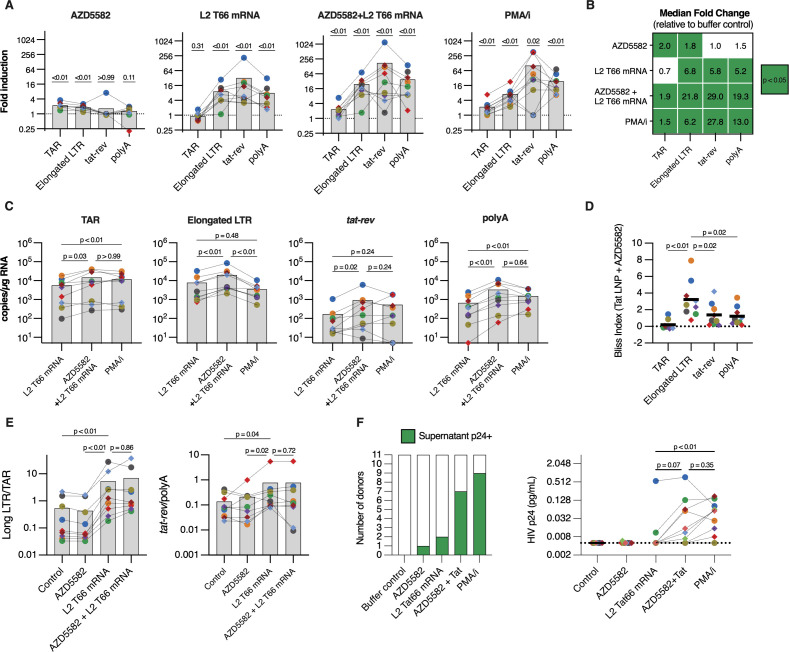
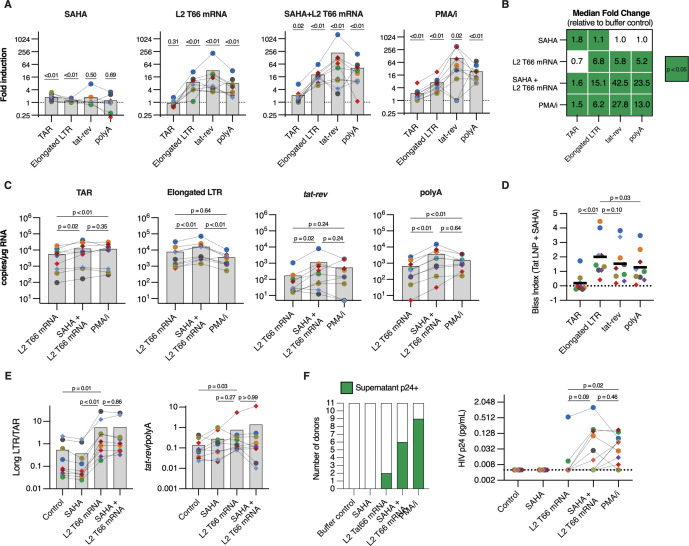
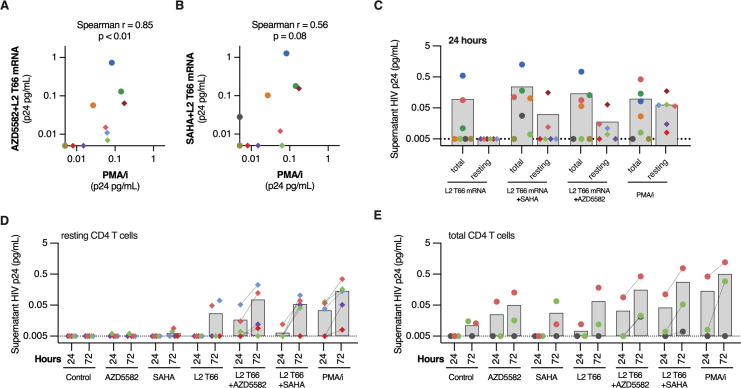
Limited cellular levels of the HIV transcriptional activator Tat are one contributor to proviral latency that might be targeted in HIV cure strategies. We recently demonstrated that lipid nanoparticles containing HIV tat mRNA induce HIV expression in primary CD4 T cells. Here, we sought to further characterize tat mRNA in the context of several benchmark latency reversal agents (LRAs), including inhibitor of apoptosis protein antagonists (IAPi), bromodomain and extra-Terminal motif inhibitors (BETi), and histone deacetylase inhibitors (HDACi). tat mRNA reversed latency across several different cell line models of HIV latency, an effect dependent on the TAR hairpin loop. Synergistic enhancement of tat mRNA activity was observed with IAPi, HDACi, and BETi, albeit to variable degrees. In primary CD4 T cells from durably suppressed people with HIV, tat mRNA profoundly increased the frequencies of elongated, multiply-spliced, and polyadenylated HIV transcripts, while having a lesser impact on TAR transcript frequencies. tat mRNAs alone resulted in variable HIV p24 protein induction across donors. However, tat mRNA in combination with IAPi, BETi, or HDACi markedly enhanced HIV RNA and protein expression without overt cytotoxicity or cellular activation. Notably, combination regimens approached or in some cases exceeded the latency reversal activity of maximal mitogenic T cell stimulation. Higher levels of tat mRNA-driven HIV p24 induction were observed in donors with larger mitogen-inducible HIV reservoirs, and expression increased with prolonged exposure time. Combination LRA strategies employing both small molecule inhibitors and Tat delivered to CD4 T cells are a promising approach to effectively target the HIV reservoir.

Keywords: HIV; Tat; latency; lipid; nanoparticles; reversal.


Conflict of interest statement

J.V. was an employee of Arcturus and may be a stockholder. E.V.G. and D.B. were employees of Johnson & Johnson and may be stockholders. D.M.M. has consulted for Merck and ViiV, outside the area of this work, and holds common stock in Gilead. No other conflicts are declared.

Figures

Fig 1
Fig 1
L2 T66 mRNA reverses HIV latency in cell line models of HIV latency without cytotoxicity in a TAR-dependent manner. Five cell line models of HIV latency (E4, 2B2D, 2D10, J89, and J-Lat 6.3) were exposed to negative control (DMSO and L2 T66 mRNA buffer), L2 T66 mRNA (250 ng/ml), or PMA/i (10 nM/1 µM) for 24 hours, and GFP reporter expression for single live cells was measured using flow cytometry. Each symbol represents data from an independent experiment, and bars and error represent mean ± SEM of at least n = 3 experiments. (A) Representative unit area histograms of proviral GFP reporter expression. (B) L2 T66 mRNA at 250 ng/mL does not result in cell death as measured by a Live/Dead membrane exclusion dye. (C) Percentage of GFP positive cells of live single cells following control, L2 Tat66mRNA, or PMA/i stimulation. (D and E) L2 T66 mRNA results in dose-responsive latency reversal, as measured by (D) %GFP+ cells and (E) GFP geometric mean fluorescence intensity (MFI). (F) Twenty-four-hour exposure to 250 ng/mL L2 T66 mRNA has minimal effects on the induction of cell-associated HIV gag RNA in ACH-2 cells, which have a TAR mutation that precludes Tat-TAR binding. ACH-2 data are derived from two independent experiments (symbol shape), each with two different ACH-2 cell cultures of differing passage numbers. Figure 1 statistical comparisons represent Wilcoxon matched-pairs signed-rank tests (B) and mixed-effects model analysis with Holm-Šídák’s multiple comparisons test (see Materials and Methods and Table S1) (C).
Fig 2
Fig 2
L2 T66 mRNA synergizes with IAPi, HDACi, and BETi to induce HIV expression in cell line models of HIV latency. E4, 2B2D, 2D10, J89, and J-Lat 6.3 cell lines were stimulated for 24 hours with indicated concentrations of small molecule LRAs and/or L2 T66 mRNA, and GFP reporter expression for single live cells was measured using flow cytometry. (A and B) Representative unit area histograms and gMFI of the proviral GFP reporter expression for L2 T66 mRNA (250 ng/mL) and several well-characterized latency reversal agents AZD5582 (100 nM), SAHA (400 nM), or I-BET151 (500 nM) either alone (A) or in combination (B). Buffer controls and the mitogens PMA/i (10 nM/1 µM) and TNF-α (10 ng/ml) are also plotted. Each symbol represents an independent experiment (n = 3); black bars represent the grand mean of all experiments. (C) The average percentage of GFP positive cells across all experiments for each cell line, with a table of P values from mixed-model multiple comparisons analysis plotted above the graph. (D) Bliss independence analysis was performed for a matrix of L2 T66 mRNA (0.3, 8, or 250 ng/mL) and small molecule LRA (concentrations indicated in the figure) exposures for each cell line. Positive values indicate synergistic activity. Mean Bliss Index values from n = 3 experiments are plotted for each cell line and treatment condition. Figure 2 statistical comparisons represent mixed-effects model analysis of log10-transformed data with Holm-Šídák’s multiple comparisons test (see Materials and Methods) (C) and Friedman’s tests with Dunn’s uncorrected multiple comparisons (D). Note that one data point was excluded for L2 T66 mRNA + AZD5582 (J89) and one for L2 T66 mRNA + I-BET151 (J-Lat 6.3) due to a technical error.
Fig 3
Fig 3
L2 T66 mRNA consistently increases cell-associated HIV transcriptional elongation, splicing, and polyadenylation in CD4 T cells from ART-suppressed donors. In a subset of donors, it also induces detectable p24 protein release into the culture supernatant. CD4 T cells (diamonds = resting CD4+ T cells; circles = total CD4 T cells) from ART-suppressed donors (Table 2) were exposed to 250 ng/mL L2 T66 mRNA for 24 hours prior to harvest of cell pellets for HIV ca-RNA analysis (n = 9). Culture supernatant was also sampled for ultrasensitive HIV p24 protein detection (n = 11). Each symbol represents data from a distinct cell donation from an ART-suppressed donor. Gray bars represent mean values. (A–D) Impact of L2 T66 mRNA (250 ng/mL) or PMA/i (10 nM/1 µM) treatment on the frequency of HIV cell-associated (A) TAR transcripts, (B) elongated LTR transcript, (C) tat-rev transcripts, and (D) polyA transcripts. (E and F) Impact of L2 T66 mRNA or PMA/i treatment on (E) the frequency of detectable p24 protein in the culture supernatant and (F) quantitative levels of p24 detected. Figure 3 statistical comparisons represent Friedman’s tests with Dunn’s uncorrected multiple comparisons (A–D and F).
Fig 4
Fig 4
L2 T66 mRNA synergizes with IAPi to induce HIV p24 release from CD4 T cells derived from ART-suppressed donors. CD4 T cells (diamonds = resting CD4+ T cells; circles = total CD4 T cells) from ART-suppressed donors (Table 2) were exposed to 250 ng/Ll L2 T66 mRNA and/or 100 nM AZD5582 for 24 hours prior to harvest of cell pellets for HIV ca-RNA analysis (n = 9). Culture supernatant was also sampled for ultrasensitive HIV p24 protein detection (n = 11). Each symbol represents data from a distinct cell donation from an ART-suppressed donor. Gray bars represent mean values. Note that data for buffer control, L2 T66 mRNA, and PMA/i conditions presented in Fig. 3 and 5 are also presented in this figure for comparison. (A) Impact of L2 T66 mRNA, AZD5582, combination, and PMA/i treatment on the fold induction of TAR, elongated LTR, tat-rev, and polyA HIV transcripts relative to buffer control. (B) Heatmap of median fold inductions for each drug treatment condition and transcript assays. Green boxes indicate P < 0.05 for one-sample Wilcoxon signed rank tests. (C) Comparison of AZD5582 in combination with L2 T66 mRNA to L2 T66 mRNA alone or PMA/i. (D) Bliss independence synergy index for AZD5582 in combination with L2 T66 mRNA. Values greater than 0 indicate a synergistic effect. Black bars indicate the mean. (E) Impact of L2 T66 mRNA and/or AZD5582 on the ratio of elongated LTR to TAR transcripts (transcriptional processivity) and the ratio of tat-rev transcripts to polyadenylated transcripts (multiple-splicing). (F) Impact of L2 T66 mRNA and/or AZD5582 treatment on the frequency of detectable p24 protein in the supernatant and quantitative levels of p24 detected. Figure 4 statistical comparisons represent one-sample Wilcoxon signed rank tests with a null hypothesis of a theoretical symmetric distribution around a fold induction of 1 (A and B) and Friedman’s tests with Dunn’s uncorrected multiple comparisons (C–F).
Fig 5
Fig 5
L2 T66 mRNA synergizes with HDACi to induce HIV p24 release from CD4 T cells derived from ART-suppressed donors. CD4 T cells (diamonds = resting CD4+ T cells; circles = total CD4 T cells) from ART-suppressed donors (Table 2) were exposed to 250 ng/mL L2 T66 mRNA and/or 400 nM SAHA for 24 hours prior to harvest of cell pellets for HIV ca-RNA analysis (n = 9). Culture supernatant was also sampled for ultrasensitive HIV p24 protein detection (n = 11). Each symbol represents data from a distinct cell donation from an ART-suppressed donor. Note that data for buffer control, L2 T66 mRNA, and PMA/i conditions presented in Fig. 3 and 4 are also presented in this figure for comparison. Gray bars represent mean values. (A) Impact of L2 T66 mRNA, SAHA, combination, and PMA/i treatment on the fold induction of TAR, elongated LTR, tat-rev, and polyA HIV transcripts relative to buffer control. (B) Heatmap of median fold inductions for each drug treatment condition and transcript assays. Green boxes indicate P < 0.05 for one-sample Wilcoxon signed rank tests. (C) Comparison of SAHA in combination with L2 T66 mRNA to L2 T66 mRNA alone or PMA/i. (D) Bliss independence synergy index for SAHA in combination with L2 T66 mRNA. Values greater than 0 indicate a synergistic effect. Black bars indicate the mean. (E) Impact of L2 T66 mRNA and/or SAHA on the ratio of elongated LTR to TAR transcripts (transcriptional processivity) and the ratio of tat-rev transcripts to polyadenylated transcripts (multiple splicing). (F) Impact of L2 T66 mRNA and/or SAHA treatment on the frequency of detectable p24 protein in the supernatant and quantitative levels of p24 detected. Figure 5 statistical comparisons represent one-sample Wilcoxon signed rank tests with a null hypothesis of a theoretical symmetric distribution around a fold induction of 1 (A and B) and Friedman’s tests with Dunn’s uncorrected multiple comparisons (C–F).
Fig 6
Fig 6
L2 T66 mRNA-driven latency reversal activity may be related to mitogen-inducibility, cellular state, and exposure time. Each symbol represents a distinct cell donation from an ART-suppressed donor (Table 2). Circles indicate total CD4 T cells, and diamonds indicate resting (CD69-CD25-HLA-DR-) CD4 T cells. Gray bars indicate mean values. (A and B) p24 release following treatment with L2 T66 mRNA (250 ng/mL) in combination with (A) AZD5582 (100 nM) or (B) SAHA (400 nM) is positively correlated (Spearman correlation) with p24 release from PMA/i (10 nM/1 µM) treatment. Data points on the axes are censored at the limit of detection (0.005 ng/mL). (C) The trend toward lower magnitude of p24 release in resting (n = 6) compared to total CD4 T cells (n = 7) following 24 hours of stimulation with the indicated LRAs. Note that matched total and resting CD4 T cell data are available only for Donor I (light green) and Donor J (salmon-pink). (D and E) p24 release into the culture supernatant following 24 or 72 hours of stimulation with the indicated LRAs for (D) resting and (E) total CD4 T cells. Aligned dot plots with dashed lines linking the 24- and 72-hour time points for L2 T66 mRNA + AZD5582, L2 T66 mRNA + AZD5582, and PMA/i are shown to highlight the temporal increase in p24 observed for these conditions.

Similar articles

References

    1. Falcinelli SD, Ceriani C, Margolis DM, Archin NM. 2019. New frontiers in measuring and characterizing the HIV reservoir. Front Microbiol 10:2878. doi:10.3389/fmicb.2019.02878 - DOI - PMC - PubMed
    1. Margolis DM, Archin NM, Cohen MS, Eron JJ, Ferrari G, Garcia JV, Gay CL, Goonetilleke N, Joseph SB, Swanstrom R, Turner A-MW, Wahl A. 2020. Curing HIV: seeking to target and clear persistent infection. Cell 181:189–206. doi:10.1016/j.cell.2020.03.005 - DOI - PMC - PubMed
    1. Li JZ, Aga E, Bosch RJ, Pilkinton M, Kroon E, MacLaren L, Keefer M, Fox L, Barr L, Acosta E, Ananworanich J, Coombs R, Mellors JW, Landay AL, Macatangay B, Deeks S, Gandhi RT, Smith DM. 2022. Time to viral rebound after interruption of modern antiretroviral therapies. Clin Infect Dis 74:865–870. doi:10.1093/cid/ciab541 - DOI - PMC - PubMed
    1. Lv T, Cao W, Li T. 2021. HIV-related immune activation and inflammation: current understanding and strategies. J Immunol Res 2021:7316456. doi:10.1155/2021/7316456 - DOI - PMC - PubMed
    1. Rodari A, Darcis G, Van Lint CM. 2021. The current status of latency reversing agents for HIV-1 remission. Annu Rev Virol 8:491–514. doi:10.1146/annurev-virology-091919-103029 - DOI - PubMed

MeSH terms

LinkOut - more resources