[Preprint]. 2024 May 21:2024.05.21.594597.
doi: 10.1101/2024.05.21.594597.

Viral and host network analysis of the human cytomegalovirus transcriptome in latency

Affiliations

Viral and host network analysis of the human cytomegalovirus transcriptome in latency

Donna Collins-McMillen et al. bioRxiv. .

Abstract

HCMV genes UL135 and UL138 play opposing roles regulating latency and reactivation in CD34+ human progenitor cells (HPCs). Using the THP-1 cell line model for latency and reactivation, we designed an RNA sequencing study to compare the transcriptional profile of HCMV infection in the presence and absence of these genes. The loss of UL138 results in elevated levels of viral gene expression and increased differentiation of cell populations that support HCMV gene expression and genome synthesis. The loss of UL135 results in diminished viral gene expression during an initial burst that occurs as latency is established and no expression of eleven viral genes from the ULb' region even following stimulation for differentiation and reactivation. Transcriptional network analysis revealed host transcription factors with potential to regulate the ULb' genes in coordination with pUL135. These results reveal roles for UL135 and UL138 in regulation of viral gene expression and potentially hematopoietic differentiation.


Conflict of interest statement

Declaration of Interests: The authors declare no competing interests.

Figures

Figure 1.
Figure 1.. Analysis of the UL135- and UL138-dependent control of the HCMV transcriptome.
A) A depiction of the samples included in this analysis and the phenotype of each virus in our CD34+ HPC model. Mock-infected cells were used to establish a baseline for regulation of cellular genes. Wildtype (WT) virus establishes latency in CD34+ HPCs and reactivates in response to cytokine stimulus. The ΔUL138STOP recombinant is replicative both prior to and following reactivation stimulus (loss of latency) and the ΔUL135STOP recombinant has low replication both prior to and following reactivation stimulus (failure to reactivate). B) Principal Component Analysis (PCA) plots were made using the ggplot2 package (60). Plots were made for both cellular and viral genes (left) and for viral genes only (right). Treatment groups include mock-infected as well as samples infected with WT, ΔUL135STOP, or ΔUL138STOP HCMV. Each treatment group consists of samples collected at 1, 3, and 5 days post infection (dpi) and at 5.5, 6, and 8 dpi treated with either DMSO control or TPA to induce cellular differentiation and viral reactivation. C) A time course of viral gene expression was made for each treatment group. Each set of data points connected by a single line represents one HCMV gene. Data were scaled to log2 counts per million (CPM) as a function of gene count.
Figure 2.
Figure 2.. Viral genes cluster into distinct patterns of regulation during latency and reactivation.
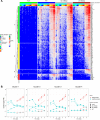
A) Clustering analysis was performed using the k-means approach and viral gene expression was visualized via heatmap with the ComplexHeatmap package from R (64, 65). Data were scaled to log2 CPM as a function of gene count. B) Average viral gene expression for each treatment group is shown by viral gene cluster.
Figure 3.
Figure 3.. The ΔUL138STOP loss of latency phenotype is pronounced in a subset of HCMV-infected hematopoietic cells.
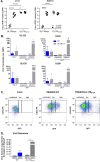
A) Humanized NSG mice (n = 10 per group) were injected with fibroblasts infected with UL138myc or ΔUL138STOP HCMV. At 4 weeks post infection, half of the mice were treated with G-CSF and AMD-3100 to induce cellular mobilization and trigger viral reactivation. Control mice remained untreated. At 1 week following mobilization, mice were euthanized, and tissues were collected. Total DNA was extracted and HCMV viral load was determined by qPCR using 1 μg of total DNA prepared from liver or spleen tissue. Error bars represent standard error of the mean (SEM) between average vDNA copies from four (liver) or two (spleen) tissue sections for individual animals. All samples were compared by two-way Anova with Tukey’s multiple comparison tests within experimental groups (non-mobilized [−G-CSF] vs mobilized [+G-CSF] for each virus and between all virus groups for both non-mobilized and mobilized conditions). Statistical significance where *, P < 0.05 and ****, P < 0.00005. B) THP-1 cells were infected with WT or ΔUL138STOP HCMV (MOI = 2) and cultured in suspension cell dishes for establishment of latency. Total RNA was extracted at 1 dpi from suspension cells and again at 7 dpi from suspension and adherent cells. cDNA was synthesized and viral transcripts were quantified by RT-qPCR. WT-infected cells did not spontaneously adhere to tissue culture dishes without reactivation stimulus in sufficient quantities to make cDNAs. Error bars represent SEM among three biological replicates analyzed in triplicate. Unpaired t tests were performed to compare individual time points for each virus infection by transcript. Statistical significance where *, P < 0.05 and ***, P < 0.0005. C) CD34+ HPCs were infected with WT or ΔUL138STOP HCMV (MOI = 2) for 24 hours, then CD34/PE+ and GFP+ (infected) cells were isolated by fluorescence-activated cell sorting (FACS). WT- and ΔUL138STOP-infected populations were divided into GFPLOW versus GFPHIGH experimental groups, using the gating strategy shown. D) Pure populations of WT- or ΔUL138STOP-infected CD34+/GFPLOW and CD34+/GFPHIGH cells were cultured over stromal support for establishment of latency. At 10 dpi, total DNA was isolated from each experimental group and viral genomes were quantified by qPCR. Data are shown as viral genome copy number normalized to the cellular gene RNAseP. Three experimental replicates were analyzed in duplicate; error bars represent SEM among experimental replicates.
Figure 4.
Figure 4.. An initial burst of viral gene expression occurs in infected cells prior to silencing and is driven by the UL135 protein.
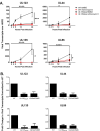
THP-1 cells were pre-treated with Actinomycin D or DMSO control for 30 minutes, then infected with WT or ΔUL135STOP HCMV (MOI = 2). Total RNA was collected over a time course of 24 hours and viral transcripts were quantified by RT-qPCR. Error bars represent SEM between three biological replicates analyzed in triplicate. All samples were compared by two-way Anova with Tukey’s multiple comparison tests across time and within experimental groups (DMSO vs Actinomycin D for each virus and WT vs ΔUL135STOP for both DMSO and Actinomycin D treatments). Statistical significance where *, P < 0.05; ***, P < 0.0005 and ****, P < 0.00005.
Figure 5.
Figure 5.. Motif analysis reveals candidate transcription factors driving expression of ULb’ genes.
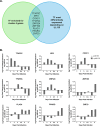
A) Graphical representation of motif analysis. A simple enrichment analysis (SEA) (66) was performed to identify predicted transcription factor binding motifs that are enriched in cluster 4 genes compared to the total HCMV genome (Supplementary Data Set 1). These transcription factors were then ranked by degree of differential expression at each time point dependent on the presence of pUL135 in our RNA-Seq analysis (Supplementary Data Set 2). When compared, these analyses generated a list of nine transcription factors that are regulated by pUL135 and are significantly more likely to control gene expression from the cluster 4 genes. B) RNA expression profiles of each of the nine candidate transcription factors from the RNA-Seq data set are shown. Numerical values are log2 fold change as a function of read count and represent the average of four biological replicates sequenced per experimental group. Data are normalized to show log2 fold change in expression when pUL135 is present (grey bars; average of WT and ΔUL138STOP infection at each time point) over absence of pUL135 (ΔUL135STOP infection). Values for ΔUL135STOP infection are set to zero so that an induction or repression of transcripts corresponds to a positive or negative number, respectively.

Similar articles

References

    1. Goodrum F., Britt W., Mocarski E. S., in Fields Virology, Howley P. M., Knipe D. M., Damania B. A., Cohen J. I., Eds. (Lippincott Williams & Wilkins, Philadelphia, PA, 2021), vol. 2, chap. 12, pp. 389–444.
    1. Fulkerson H. L., Nogalski M. T., Collins-McMillen D., Yurochko A. D., Overview of Human Cytomegalovirus Pathogenesis. Methods in molecular biology 2244, 1–18 (2021)10.1007/978-1-0716-1111-1_1). - DOI - PubMed
    1. Chambers J., Angulo A., Amaratunga D., Guo H., Jiang Y., Wan J. S., Bittner A., Frueh K., Jackson M. R., Peterson P. A., Erlander M. G., Ghazal P., DNA microarrays of the complex human cytomegalovirus genome: profiling kinetic class with drug sensitivity of viral gene expression. Journal of virology 73, 5757–5766 (1999); published online EpubJul (10.1128/jvi.73.7.5757-5766.1999). - DOI - PMC - PubMed
    1. Gatherer D., Seirafian S., Cunningham C., Holton M., Dargan D. J., Baluchova K., Hector R. D., Galbraith J., Herzyk P., Wilkinson G. W., Davison A. J., High-resolution human cytomegalovirus transcriptome. Proc Natl Acad Sci U S A 108, 19755–19760 (2011); published online EpubDec 6 (10.1073/pnas.1115861108). - DOI - PMC - PubMed
    1. Meshesha M. K., Veksler-Lublinsky I., Isakov O., Reichenstein I., Shomron N., Kedem K., Ziv-Ukelson M., Bentwich Z., Avni Y. S., The microRNA Transcriptome of Human Cytomegalovirus (HCMV). The open virology journal 6, 38–48 (2012)10.2174/1874357901206010038). - DOI - PMC - PubMed

Publication types