[Preprint]. 2024 May 23:2024.05.21.595090.
doi: 10.1101/2024.05.21.595090.

Murine modeling of menstruation identifies immune correlates of protection during Chlamydia muridarum challenge

Affiliations

Murine modeling of menstruation identifies immune correlates of protection during Chlamydia muridarum challenge

Laurel A Lawrence et al. bioRxiv. .

Abstract

The menstrual cycle influences the risk of acquiring sexually transmitted infections (STIs), including Chlamydia trachomatis (C. trachomatis), although the underlying immune contributions are poorly defined. A mouse model simulating the immune-mediated process of menstruation could provide valuable insights into tissue-specific determinants of protection against chlamydial infection within the cervicovaginal and uterine mucosae comprising the female reproductive tract (FRT). Here, we used the pseudopregnancy approach in naïve C57Bl/6 mice and performed vaginal challenge with Chlamydia muridarum (C. muridarum) at decidualization, endometrial tissue remodeling, or uterine repair. This strategy identified that the time frame comprising uterine repair correlated with robust infection and greater bacterial burden as compared with mice on hormonal contraception, while challenges during endometrial remodeling were least likely to result in a productive infection. By comparing the infection site at early time points following chlamydial challenge, we found that a greater abundance of innate effector populations and proinflammatory signaling, including IFNγ correlated with protection. FRT immune profiling in uninfected mice over pseudopregnancy or in pig-tailed macaques over the menstrual cycle identified NK cell infiltration into the cervicovaginal tissues and lumen over the course of endometrial remodeling. Notably, NK cell depletion over this time frame reversed protection, with mice now productively infected with C. muridarum following challenge. This study shows that the pseudopregnancy murine menstruation model recapitulates immune changes in the FRT as a result of endometrial remodeling and identifies NK cell localization at the FRT as essential for immune protection against primary C. muridarum infection.


Figures

Figure 1.
Figure 1.
(A). Depiction of the pseudopregnancy approach for inducing menstruation in C57Bl/6 mice with the time frame of major endometrial changes emphasized. (B). A mean symbol graph with the standard error of means (SEM) depicting Progesterone or (C). Estrogen levels measured from blood plasma over indicated time points of pseudopregnancy and plotted as concentration. Progesterone and Estrogen levels from mice administered Medroxyprogesterone acetate (MPA) are shown as a bar graph with SEM for each comparison. (D). Vaginal cytology over pseudopregnancy at indicated time points. Vaginal smears are stained using Hematoxylin and Eosin (H&E) and then visualized using microscopy at 40x magnification. (E). A photo of a menstruating C57Bl/6 mice following the induction of pseudopregnancy (day 10). (F). A schematic depicting the intravenous (IV) labeling approach for distinguishing leukocytes in circulation performed prior to euthanasia and necropsy. (G). Cell flow plots from the spleen and uterine horns of a representative animal at day 8 of pseudopregnancy, illustrating the approach for distinguishing tissue-resident or circulating leukocyte measurements following IV labeling. Viable, singlet leukocytes are distinguished by the expression of IV-labeled CD45. (H). The frequency of IV+ leukocytes from uterine horns over the indicated time points of pseudopregnancy and compared with sesame seed oil (ssoil) injection control mice or mice treated with MPA. Each open circle represents an individual mouse (B, C). Models used to evaluate a mean deviation were fit using one-sample t-tests. A minimum of 6 mice were measured at each time point. (H). Models used to compare a difference of means were fit using multiple comparisons: (B, C, H). p-values with q-values ≤ 0.05 are shown. *p≤0.05, **p<0.01, ***p<0.001, ****p<0.0001. (A, F). Created using BioRender.com.
Figure 2.
Figure 2.
(A). Flow cytometry cell gating strategy for measuring innate immune cells from anatomic compartments of the FRT. Viable singlet tissue-resident leukocytes are discriminated by the expression of Ly6G and side scatter characteristics from CVL, cervicovaginal tissue, and the uterine horns. The remaining populations are then measured for macrophage based on CD11b and F4/80 expression, and then NK cells are measured from CD11b and F4/80 negative lymphocytes (based on size and granularity characteristics) followed by DX5 expression. (B). The total yield of indicated immune cell populations from FRT tissue sites is plotted as bar and whiskers graphs over pseudopregnancy and compared with mice administered MPA as a control. (C). A heat map depicting the fold change in cytokines and chemokines measured from CVL over pseudopregnancy or MPA and ordered according to the greatest fold increase (top to bottom). (D). The concentrations of indicated cytokines are plotted as bar and whiskers graphs over pseudopregnancy and compared with mice administered MPA as a control. (B, D). Models used to compare a difference of means were fit using multiple comparisons: p-values with q-values≤0.05 are shown *p≤0.05, **p<0.01, ***p<0.001, ****p<0.0001.
Figure 3.
Figure 3.
(A). Cartoon of a pig-tailed macaque (Macaca Nemistrina). Figure created using BioRender.com. (B). A symbol line graph with SEM depicting the fold change in plasma levels of Progesterone (red symbols and lines) and Estrogen (Estradiol, blue symbols and lines) was measured longitudinally from 6 animals and stratified by cycle phase. (C). (Left panel) Flow dot plots depicting the strategy for measuring NK cells from PBMC (top) and CVL (bottom). Live, singlet CD45 expressing lymphocytes are first discriminated from granulocytes, myeloid cells, T cells, and B cells and then measured for HLADR negative and CD8 positive populations. (Right panel) a symbol line graph with SEM depicting the fold change in CVL NK cells measured longitudinally and stratified by cycle phase. Cells collected during time points of menstruation were considered contaminated by cells in blood circulation and are not shown. (D). A symbol line graph with SEM depicting the fold change in IP-10 measured from CVL supernatant (B-D). The cycle phases are identified as follows: Follicular phase (F), Follicular/Ovulation transition (F/O), Ovulation (O), Ovulation/Luteal transition (O/L), Luteal phase (L), Late Luteal phase (LL), Pre-menstruation (PM), and Menstruation (M). (C, D). Models used to evaluate fold change (against a value of 1) were fit using Wilcoxon rank sum tests. Median differences with p-values ≤ 0.05 are indicated by an asterisk.
Figure 4.
Figure 4.
(A). Schematic depiction of the vaginal C. muridarum challenge approach at time points of pseudopregnancy (indicated by red arrows). Created using BioRender.com. (B, C). Line graphs depicting the mean bacterial burden with SEM over the course of infection determined by ddPCR and compared with mice administered MPA prior to challenge (n=10, black dotted lines). The graphed data points based on the day of pseudopregnancy at challenge are comprised of 2 separate experiments for each group (B). The time of challenge over pseudopregnancy is indicated as day 4 challenge (n=8, green line), day 6 challenge (n=12, blue line), and day 8 challenge (n=10, red line). (C). The time of challenge over pseudopregnancy is indicated as day 10 (n=14, purple line). (B, C). Models used to compare a difference of means were fit using multiple comparisons: p-values with q-values ≤0.05 are shown *p≤0.05, **p<0.01, ***p<0.001, ****p<0.0001. (B). The red asterisk indicates a significant difference detected at day 3 post-challenge when comparing day 8 of pseudopregnancy at challenge with MPA.
Figure 5.
Figure 5.
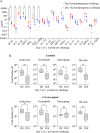
(A). A dot plot graph with the mean and standard deviation (SD) depicting the concentration of indicated proinflammatory cytokine and chemokines measured from CVL supernatant at day 3 of C. muridarum infection following challenge at D8 (red) or D10 (blue) of pseudopregnancy. Models used to compare a difference of means were fit using Multiple Mann-Whitney tests and ordered by rank: p-values with q-values ≤ 0.05 are indicated by an asterisk. (B). Box and whiskers graphs comparing the total number of indicated IV-negative innate cell populations from CVL (top panels) and vaginal tissues (bottom panels) collected on day 3 of C. muridarum infection following challenge at day 8 (D8) or day 10 (D10) of pseudopregnancy. Models used to compare a difference of means were fit using unpaired t-tests. (A-B). *p≤0.05, **p<0.01, ***p<0.001, ****p<0.0001
Figure 6.
Figure 6.
(A). Schematic depicting the approach for depleting NK cells during time points of endometrial remodeling and prior to vaginal C. muridarum challenge at day 8 of pseudopregnancy. An IP injection of αNK1.1 antibody is administered on day 5 and day 7 of pseudopregnancy. Schematic created using BioRender.com (B). NK cells are measured at the indicated time points over pseudopregnancy from the cervicovaginal lumen (left panel) or underlying tissues (right panel) following NK cell depletion and compared with mice not treated with αNK1.1 antibody over pseudopregnancy (originally shown in Figure 2). (C). The bacterial burden of C. muridarum is measured from vaginal swabs collected over the course of infection from mice that are administered αNK1.1 antibody (n=11, pink lines) over endometrial remodeling and compared with historical measurements from mice treated with MPA prior to challenge (n=10, dotted line originally shown in Figure 4B, C). (B, C). Models used to compare a difference of means were fit using multiple comparisons: p-values with q-values ≤ 0.05 are shown *p≤0.05, **p<0.01, ***p<0.001, ****p<0.0001.

Similar articles

References

    1. Dielissen PW, Teunissen DA, Lagro-Janssen AL. Chlamydia prevalence in the general population: is there a sex difference? a systematic review. BMC Infect Dis. 2013;13:534. Epub 20131111. doi: 10.1186/1471-2334-13-534. - DOI - PMC - PubMed
    1. Workowski KA, Bolan GA, Centers for Disease C, Prevention. Sexually transmitted diseases treatment guidelines, 2015. MMWR Recomm Rep. 2015;64(RR-03):1–137. - PMC - PubMed
    1. Stary G, Olive A, Radovic-Moreno AF, Gondek D, Alvarez D, Basto PA, et al. VACCINES. A mucosal vaccine against Chlamydia trachomatis generates two waves of protective memory T cells. Science. 2015;348(6241):aaa8205. doi: 10.1126/science.aaa8205. - DOI - PMC - PubMed
    1. Schuster IS, Sng XYX, Lau CM, Powell DR, Weizman OE, Fleming P, et al. Infection induces tissue-resident memory NK cells that safeguard tissue health. Immunity. 2023;56(9):2173–4. doi: 10.1016/j.immuni.2023.08.004. - DOI - PubMed
    1. Gray JI, Farber DL. Tissue-Resident Immune Cells in Humans. Annu Rev Immunol. 2022;40:195–220. Epub 20220119. doi: 10.1146/annurev-immunol-093019-112809. - DOI - PMC - PubMed

Publication types