. 2024 May 31:13:RP93087.
doi: 10.7554/eLife.93087.

Aberrant methylation and expression of TNXB promote chondrocyte apoptosis and extracullar matrix degradation in hemophilic arthropathy via AKT signaling

Affiliations

Aberrant methylation and expression of TNXB promote chondrocyte apoptosis and extracullar matrix degradation in hemophilic arthropathy via AKT signaling

Jiali Chen et al. Elife. .

Abstract

Recurrent joint bleeding in hemophilia patients frequently causes hemophilic arthropathy (HA). Drastic degradation of cartilage is a major characteristic of HA, but its pathological mechanisms has not yet been clarified. In HA cartilages, we found server matrix degradation and increased expression of DNA methyltransferase proteins. We thus performed genome-wide DNA methylation analysis on human HA (N=5) and osteoarthritis (OA) (N=5) articular cartilages, and identified 1228 differentially methylated regions (DMRs) associated with HA. Functional enrichment analyses revealed the association between DMR genes (DMGs) and extracellular matrix (ECM) organization. Among these DMGs, Tenascin XB (TNXB) expression was down-regulated in human and mouse HA cartilages. The loss of Tnxb in F8-/- mouse cartilage provided a disease-promoting role in HA by augmenting cartilage degeneration and subchondral bone loss. Tnxb knockdown also promoted chondrocyte apoptosis and inhibited phosphorylation of AKT. Importantly, AKT agonist showed chondroprotective effects following Tnxb knockdown. Together, our findings indicate that exposure of cartilage to blood leads to alterations in DNA methylation, which is functionally related to ECM homeostasis, and further demonstrate a critical role of TNXB in HA cartilage degeneration by activating AKT signaling. These mechanistic insights allow development of potentially new strategies for HA cartilage protection.

Keywords: DNA methylation; cartilage degeneration; cell biology; chondrocyte apoptosis; genetics; genomics; hemophilic arthropathy; human; mouse; tenascin XB.


Conflict of interest statement

JC, QZ, XW, RX, WW, YH, QS, WY, PW, PT, HJ No competing interests declared, DC Reviewing editor, eLife

Figures
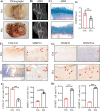
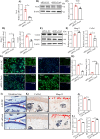
Figure 1.
Figure 1.. The severe cartilage damage in human HA.
(A) Human cartilage samples in the tibial plateau were obtained from patients with OA and HA. Black arrow indicates hemorrhagic ferruginous deposits. (B) MRI imaging of the knee joint in patients with HA and OA. Red arrow indicates the wear area. (C) Representative images of ABH/OG staining for HA and OA cartilage. (D) The degree of cartilage degeneration was quantified according to the OARSI score. (E) Representative IHC staining of COL2A1 and MMP13. (F) Quantification of the proportion of COL2A1 and MMP13 positive regions in human cartilage. (G) Representative IHC staining of DNMT1 and DNMT3A. (H) Quantification of the proportion of DNMT1 and DNMT3A positive cells in human cartilage. Red arrows indicate positive cells. Scale bar: 100 μm. Data were presented as means ± SD; n = 5 per group. And analyzed by two-tailed unpaired parametric Student’s t test, **p < 0.01, ***p < 0.001.
Figure 1—figure supplement 1.
Figure 1—figure supplement 1.. Representative immunofluorescence images (A) and quantification (B) of DNMT3B in human HA and OA cartilages.
Scale bar: 100 μm. Data were presented as means ± SD; n = 5 in each group. ns = no significance by unpaired Student’s t test.
Figure 2.
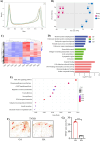
Figure 2.. Genome-wide DNA methylation profile in HA cartilage and biological functions of DMGs.
(A) Distribution of methylation level density of CpGs. Note: X = degree of methylation; Y = the CpG site density corresponding to the level of methylation. (B) Principal component analysis of DNA methylation data. (C) Heatmap shows the 700 significant DMRs between HA and OA. (D) Enriched GO terms for DMR-related genes. (E) KEGG enrichment analysis of DMR-related genes. (F) Representative IHC staining of TNXB. Red arrows indicate positive areas. Scale bar: 100 μm. (G) Quantification of the proportion of TNXB positive regions in human cartilage. Data were presented as means ± SD; n = 5 per group. And analyzed by two-tailed unpaired parametric Student’s t test, ***p < 0.001.
Figure 2—figure supplement 1.
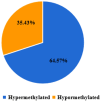
Figure 2—figure supplement 1.. The proportion of hypermethylated and hypomethylated DMRs.
Figure 2—figure supplement 2.
Figure 2—figure supplement 2.. Proportion of DMRs for each genetic feature.
Figure 2—figure supplement 3.
Figure 2—figure supplement 3.. Representative IHC staining (A) images and (B) corresponding quantification ofTNXB in synovium from human HA and OA.
Red arrows indicate positive cells. Scale bar: 100 μm. Data were presented as means ± SD; n = 5 in each group. ns = no significance by unpaired Student’s t test.
Figure 3.
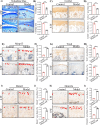
Figure 3.. TNXB expression is drastically reduced in HA mouse cartilages.
(A) Representative images and (B) Quantitative analysis of Toluidine blue staining for knee sections of F8-/- mice at 4 and 8 weeks following injury. Representative IHC staining of (C) Col2a1, (E) Mmp13, (G) Tnxb, (I) Dnmt1, and (K) Dnmt3a in F8-/- mice at 4 and 8 weeks post injury. Quantification of the proportion of (D) Col2a1, (F) Mmp13, (H) Tnxb, (J) Dnmt1 and (L) Dnmt3a positive regions. Scale bar: 100 μm. Data were presented as means ± SD; n = 6 mice per group. And analyzed by two-tailed unpaired parametric Student’s t test, ***p < 0.001.
Figure 3—figure supplement 1.
Figure 3—figure supplement 1.. Representative images of bleeding knee joint of F8-/- mice at (A) 4 and (B) 8 weeks following injury.
Figure 3—figure supplement 2.
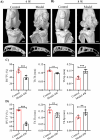
Figure 3—figure supplement 2.. Representative 3D reconstruction of the knee joint and subchondral bone of HA model mice at (A) 4 weeks and (B) 8 weeks after puncture-induced injury.
Quantification analysis of the subchondral bone BV/TV (%), Tb.Th (mm) and Tb.Sp (mm) at HA model mice at (C) 4 weeks and (D) 8 weeks after injury. Data were presented as means ± SD and analyzed by two-tailed unpaired parametric Student’s t test, **p < 0.01, ***p < 0.001, n = 6 in each group.
Figure 4.
Figure 4.. knockdown of Tnxb in chondrocytes induces extracellular matrix degradation and accelerates the progression of HA.
(A) qPCR and (B) western blotting analysis for Tnxb in mouse chondrocytes treated with siRNA-NC or siRNA-Tnxb. (C) Corresponding quantification analysis of Tnxb protein. Quantification of mRNA levels for (D) Mmp13 andCol2a1 in Tnxb-KD chondrocytes. (E) Western blot and (F) corresponding quantification analysis for Mmp13 and Col2a1 protein. (G) Representative immunofluorescence images of Col2a1 and Mmp13 expression in Tnxb-KD chondrocytes. (H) Quantification of Col2a1 and Mmp13 fluorescence intensity. Representative images of (I) Toluidine blue staining and (K) IHC staining of Col2a1 and Mmp13 for knee sections of F8-/- mice at 4 weeks after Intra-articular injection of AAV-shTnxb. (J) Quantitative detection of the area of the tibial cartilage area. (L) Quantification of the proportion of Col2a1 and Mmp13 positive regions. Red arrow indicates the wear area. Scale bar: 100 μm. Data were presented as means ± SD; n ≥ 3 in each group. And analyzed by two-tailed unpaired parametric Student’s t test, *p < 0.05, **p < 0.01, ***p < 0.001.
Figure 4—figure supplement 1.
Figure 4—figure supplement 1.. The qPCR analysis for the mRNA level of Tnxb in mouse chondrocytes treated with (A) RG-108 or (B) 5-Aza-dc.
Data were presented as means ± SD and analyzed by two-tailed unpaired parametric Student’s t test, ns = no significance, **p < 0.01, ***p < 0.001, n = 4 in each group.
Figure 4—figure supplement 2.
Figure 4—figure supplement 2.. The micro-CT analysis of subchondral bone in Tnxb-KD HA mice.
(A) Representative 3D reconstruction of the knee joint and subchondral bone. Quantification analysis of the subchondral bone (B) BV/TV (%), (C) Tb.Th (mm), (D) Tb.Sp (mm) and (E) Tb.N (1 /mm). Data were presented as means ± SD and analyzed by 2-tailed unpaired parametric Student’s t test, **p < 0.01, ***p < 0.001, n = 3 in each group.
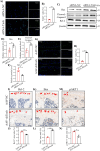
Figure 5.
Figure 5.. Tnxb knockdown increases apoptosis in chondrocytes and HA cartilages.
(A) Representative images of Tunel staining in Tnxb-KD chondrocytes (B) Quantification for Tunel positive cells. (C–F) Western blot and corresponding quantification analysis for Bax, Cleaved-Caspase3, and Bcl-2. (G) Tunel staining for apoptosis in articular cartilage from Tnxb-KD HA mice. (H) Quantification for Tunel-positive cells in articular cartilage. Representative IHC staining of Bax (I), Bcl-2 (K), and p-AKT1 (M) in articular cartilage from Tnxb-KD HA mice. Corresponding quantification of the proportion of (J) Bax, (L) Bcl-2 and (N) p-AKT1-positive regions. Red arrows indicate positive cells. Scale bar: 100 μm. Data were presented as means ± SD; n ≥ 3 in each group. And analyzed by two-tailed unpaired parametric Student’s t test, **p < 0.01, ***p < 0.001.
Figure 5—figure supplement 1.
Figure 5—figure supplement 1.. Tunel staining for apoptosis in articular cartilage of F8-/- mice at (A) 4 and (B) 8 weeks following injury.
Scale bar: 100 μm. Quantification for Tunel positive cells in articular cartilages.
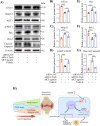
Figure 6.
Figure 6.. Treatment with AKT agonist decreases apoptosis in Tnxb-KD chondrocytes.
(A) Western blot analysis for Col2a1, Mmp13, Bax, Bcl-2, p-AKT1, AKT1 and Cleaved-Caspase9 in Tnxb-KD chondrocytes treated with SC79 (0 or 10 μM) for 24 h. (B–G) Corresponding quantification of these proteins. (H) Schematic of the role of TNXB in the pathogenesis of HA cartilage degeneration. Data were presented as means ± SD; n = 4 per group. And analyzed by two-tailed unpaired parametric Student’s t test or one-way ANOVA with Tukey’s multiple comparisons test, *p < 0.05, **p < 0.01, ***p < 0.001.
Figure 6—figure supplement 1.
Figure 6—figure supplement 1.. Western blot examined the function of AKT1 and p-AKT1 agonist SC79.
(A) Western blot label and (B) corresponding quantification of AKT1 and p-AKT1. Data were presented as means ± SD and analyzed by two-tailed unpaired parametric Student’s t test, **p < 0.01, ***p < 0.001, n = 4 in each group.
Figure 6—figure supplement 2.
Figure 6—figure supplement 2.. Western blot examined the expression of p-Smad2 in mouse chondrocytes treated with siRNA-NC or siRNA-Tnxb.
(A) Western blot label and (B) corresponding quantification of p-Smad2. Data were presented as means ± SD and analyzed by two-tailed unpaired parametric Student’s t test, ns = no significance, n = 4 in each group.
Author response image 1.
Author response image 1.. Figure Legend: Representative IHC staining of Dnmt1 in articular cartilage from Tnxb-KD HA mice.
Corresponding quantification of the proportion of Dnmt1 positive regions. Red arrows indicate positive cells. Scale bar: 100 μm. Data were presented as means ± SD; n = 5 in each group. ns = no significance by unpaired Student’s t test.

Update of

  • doi: 10.1101/2023.12.11.570472
  • doi: 10.7554/eLife.93087.1
  • doi: 10.7554/eLife.93087.2

Similar articles

References

    1. Alcaraz LB, Exposito JY, Chuvin N, Pommier RM, Cluzel C, Martel S, Sentis S, Bartholin L, Lethias C, Valcourt U. Tenascin-X promotes epithelial-to-mesenchymal transition by activating latent TGF-β. The Journal of Cell Biology. 2014;205:409–428. doi: 10.1083/jcb.201308031. - DOI - PMC - PubMed
    1. Aledort LM, Haschmeyer RH, Pettersson H, The Orthopaedic Outcome Study Group A longitudinal study of orthopaedic outcomes for severe factor-VIII-deficient haemophiliacs. Journal of Internal Medicine. 1994;236:391–399. doi: 10.1111/j.1365-2796.1994.tb00815.x. - DOI - PubMed
    1. Anaparti V, Agarwal P, Smolik I, Mookherjee N, El-Gabalawy H. Whole blood targeted bisulfite sequencing and differential methylation in the C6ORF10 gene of patients with rheumatoid arthritis. The Journal of Rheumatology. 2020;47:1614–1623. doi: 10.3899/jrheum.190376. - DOI - PubMed
    1. Bolton-Maggs PHB, Pasi KJ. Haemophilias A and B. Lancet. 2003;361:1801–1809. doi: 10.1016/S0140-6736(03)13405-8. - DOI - PubMed
    1. Cai C, Min S, Yan B, Liu W, Yang X, Li L, Wang T, Jin A. MiR-27a promotes the autophagy and apoptosis of IL-1β treated-articular chondrocytes in osteoarthritis through PI3K/AKT/mTOR signaling. Aging. 2019;11:6371–6384. doi: 10.18632/aging.102194. - DOI - PMC - PubMed

MeSH terms