. 2024 May 15:15:1402654.
doi: 10.3389/fmicb.2024.1402654. eCollection 2024.

Effect of folA gene in human breast milk-derived Limosilactobacillus reuteri on its folate biosynthesis

Affiliations

Effect of folA gene in human breast milk-derived Limosilactobacillus reuteri on its folate biosynthesis

Yu Jiang et al. Front Microbiol. .

Abstract

Introduction: Folate supplementation is crucial for the human body, and the chemically synthesized folic acid might have undesirable side effects. The use of molecular breeding methods to modify the genes related to the biosynthesis of folate by probiotics to increase folate production is currently a focus of research.

Methods: In this study, the folate-producing strain of Limosilactobacillus reuteri B1-28 was isolated from human breast milk, and the difference between B1-28 and folA gene deletion strain ΔFolA was investigated by phenotyping, in vitro probiotic evaluation, metabolism and transcriptome analysis.

Results: The results showed that the folate producted by the ΔFolA was 2-3 folds that of the B1-28. Scanning electron microscope showed that ΔFolA had rougher surface, and the acid-producing capacity (p = 0.0008) and adhesion properties (p = 0.0096) were significantly enhanced than B1-28. Transcriptomic analysis revealed that differentially expressed genes were mainly involved in three pathways, among which the biosynthesis of ribosome and aminoacyl-tRNA occurred in the key metabolic pathways. Metabolomics analysis showed that folA affected 5 metabolic pathways, involving 89 different metabolites.

Discussion: In conclusion, the editing of a key gene of folA in folate biosynthesis pathway provides a feasible pathway to improve folate biosynthesis in breast milk-derived probiotics.

Keywords: Limosilactobacillus reuteri; folate; metabolism; molecular breeding; probiotic properties; transcription.


Conflict of interest statement

YuJ, XL, WZ, YaJ, KY, LL, MZ, WQ, JZ, MD, XF, XD, HC, and LC were employed by the Beijing Sanyuan Foods Co., Ltd. The remaining authors declare that the research was conducted in the absence of any commercial or financial relationships that could be construed as a potential conflict of interest.

Figures

Figure 1
Figure 1
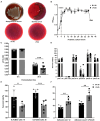
Screening, morphology and FA production abilities of human breast milk-derived strains. (A) Screening of FA producing human breast milk-derived strains. The abscissa indicates the strain number, and the ordinate indicates the FA content. (B) FA production of the wild-type strain and knockout strain. The abscissa number 1 means FA production of B1-28 in FACM; number 2 means FA production of ΔFolA in FACM; number 3 means FA production of B1-28 in milk; number 4 means FA production of ΔFolA in milk. (C–E) SEM images of B1-28, (C) 5.00 μm; (D) 2.00 μm; (E) 1.00 μm. (F–H) SEM images of ΔFolA, (F) 5.00 μm; (G) 2.00 μm; (H) 1.00 μm. The results of T-test were expressed as mean ± standard deviation, ****p < 0.0001.
Figure 2
Figure 2
In vitro probiotic properties of strains B1-28 and ΔFolA. (A) Hemolytic activity. (B) Growth curve of the strains from 0 to 40 h. (C) pH values before and after probiotic fermentation. (D) Acid tolerance of strains. (E) Bile salt tolerance of strains. (F) Adhesion properties of strains. Values are expressed as mean ± standard deviation. * represents statistically significant differences, *p < 0.05, **p < 0.01, ***p < 0.001, ****p < 0.0001. The gray dot represents strain B1-28, and the black square dot represents strain ΔFolA.
Figure 3
Figure 3
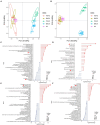
Screening results of differential metabolite in fermentation samples. (A) PCA plot in positive ion mode; (B) PCA plot in negative ion mode; scatters with different colors indicate samples from different experimental subgroups; FMRS: ΔFolA fermentation medium; BMRS: B1-28 fermentation medium; FMILK: ΔFolA fermented milk; BMILK: B1-28 fermented milk. (C) Matchstick diagram of differential metabolites in MRS broth fermentation broth in positive ion mode. (D) Matchstick diagram of differential metabolites in MRS broth fermentation broth in negative ion mode. (E) Matchstick diagram of differential metabolites in fermented milk in positive ion mode. (F) Matchstick diagram of differential metabolites in fermented milk in negative ion mode. The color of the dots represents up-regulation or down-regulation, blue represents the downregulation, and red represents up-regulation; the length of the rods represents the magnitude of the log2(Fold Change); and the size of the dots represents the magnitude of the VIP value.
Figure 4
Figure 4
Heat maps of differential metabolites in fermentation samples. (A,B) Heat maps of differential metabolites in MRS fermentation broth in positive and negative ion modes. (C,D) Heat maps of differential metabolites in fermented milk in positive and negative ion modes. Clustering is done vertically for samples and horizontally for metabolites, with shorter cluster branches representing higher similarity. Horizontal comparisons show the relationship between the clustering of metabolite contents between groups. FMRS: ΔFolA fermentation medium; BMRS: B1-28 fermentation medium; FMILK: ΔFolA fermented milk; BMILK: B1-28 fermented milk. Sample numbers 01–06 represent six parallel samples in this group.
Figure 5
Figure 5
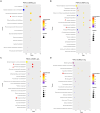
KEGG pathway analysis. (A) KEGG pathway of MRS fermentation broth in the positive ionic mode. (B) KEGG pathway of MRS fermentation broth in the negative ionic mode. (C) KEGG pathway of fermented milk in the positive ionic mode. (D) KEGG pathway of fermented milk in the negative ionic mode. The horizontal coordinate in the graph is x/y (the number of differential metabolites in the corresponding metabolic pathway/ the number of total metabolites identified in the pathway), larger values indicate higher enrichment of differential metabolites in the pathway. The colors of the dots represent the p-value of the hypergeometric test, smaller values indicate greater reliability and statistical significance of the test. FMRS: ΔFolA fermentation medium; BMRS: B1-28 fermentation medium; FMILK: ΔFolA fermented milk; BMILK: B1-28 fermented milk.
Figure 6
Figure 6
Transcriptional differential gene analysis. (A) PCA plot, in which samples between groups are dispersed and samples within groups are clustered together. (B) Gene expression correlation map, the closer the correlation coefficient is to 1, the higher the similarity in expression patterns between samples. (C) Differential gene volcano map, the horizontal coordinates of the graphs indicate the fold change in gene expression between the treatment and control groups (log2FoldChange), and the vertical coordinates indicate the significance level of the difference of gene expression between the treatment and control groups (−log10 padj or -log10 p-value). Up-regulated genes are represented by red dots and down-regulated genes are represented by green dots. (D) Differential gene function heatmap. Cluster analysis was conducted on differential gene sets, where genes with similar expression patterns were clustered together. When compared horizontally, red indicates high gene expression, and blue indicates low gene expression.
Figure 7
Figure 7
Enrichment analysis diagram. (A) GO enrichment histogram of DEGs in biological process. (B) GO enrichment histogram of DEGs in cellular components. (C) GO enrichment histogram of differential genes in molecular function. n: the number of differential genes annotated to the GO number and the functional analysis of transcriptional DEGs. (D) KEGG pathway was plotted as a scatter plot, the horizontal coordinate of the plot is the ratio of the number of differential genes annotated to the KEGG pathway to the total number of differential genes, and the vertical coordinate is the KEGG pathway. The scatter plot is shown with different colors and sizes of the dots, with the colors showing a gradual change from purple to red, the redder the color, the more significant the enrichment is; the bigger the dot, the more genes are enriched.

Similar articles

References

    1. Ali M. S., Lee E.-B., Lim S.-K., Suk K., Park S.-C. (2023). Isolation and identification of Limosilactobacillus reuteri PSC102 and evaluation of its potential probiotic, antioxidant, and antibacterial properties. Antioxidants 12:238. doi: 10.3390/antiox12020238, PMID: - DOI - PMC - PubMed
    1. Ali M. S., Lee E. B., Quah Y., Birhanu B. T., Suk K., Lim S. K., et al. . (2022). Heat-killed Limosilactobacillus reuteri PSC102 ameliorates impaired immunity in cyclophosphamide-induced immunosuppressed mice. Front. Microbiol. 13:820838. doi: 10.3389/fmicb.2022.820838, PMID: - DOI - PMC - PubMed
    1. Angermayr S. A., Pang T. Y., Chevereau G., Mitosch K., Lercher M. J., Bollenbach T. (2022). Growth-mediated negative feedback shapes quantitative antibiotic response. Mol. Syst. Biol. 18:e10490. doi: 10.15252/msb.202110490, PMID: - DOI - PMC - PubMed
    1. Bode L. (2012). Human milk oligosaccharides: every baby needs a sugar mama. Glycobiology 22, 1147–1162. doi: 10.1093/glycob/cws074, PMID: - DOI - PMC - PubMed
    1. Chavez-Esquivel G., Cervantes-Cuevas H., Ybieta-Olvera L. F., Castañeda Briones M. T., Acosta D., Cabello J. (2021). Antimicrobial activity of graphite oxide doped with silver against Bacillus subtilis, Candida albicans, Escherichia coli, and Staphylococcus aureus by agar well diffusion test: synthesis and characterization. Mater. Sci. Eng. C Mater. Biol. Appl. 123:111934. doi: 10.1016/j.msec.2021.111934 - DOI - PubMed

Grants and funding

The author(s) declare that financial support was received for the research, authorship, and/or publication of this article. This research was funded by the Special Funds for Guiding Local Scientific and Technological Development by the Central Government (Grant No. 5 GuikeZY22096025), National Natural Science Foundation of China (Grant No. 32072191), and Beijing Science and Technology Plan (Grant No. Z221100006422012) for funding this study.

LinkOut - more resources