. 2024 Jul;29(7):549-566.
doi: 10.1111/gtc.13130. Epub 2024 May 29.

DNMT1 can induce primary germ layer differentiation through de novo DNA methylation

Affiliations

DNMT1 can induce primary germ layer differentiation through de novo DNA methylation

Takamasa Ito et al. Genes Cells. 2024 Jul.

Abstract

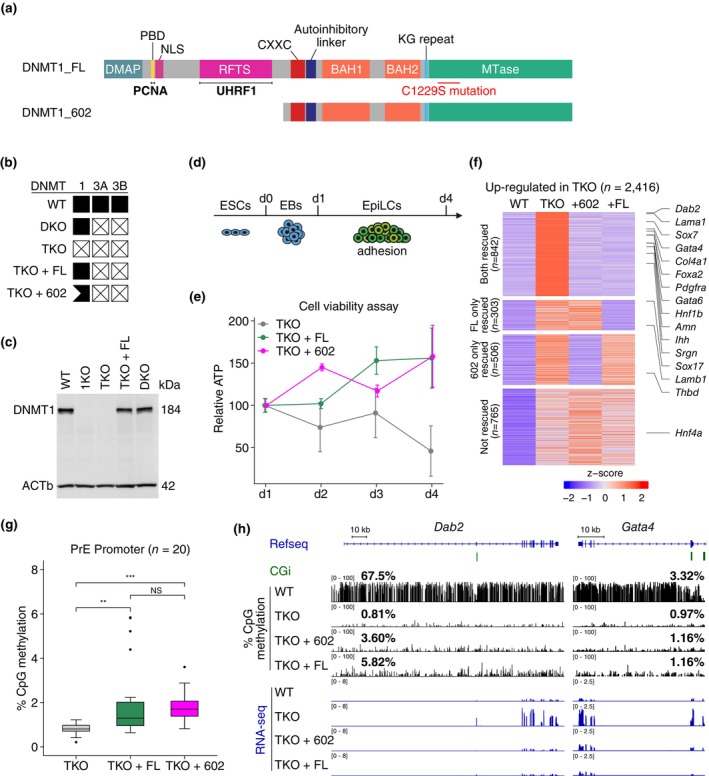
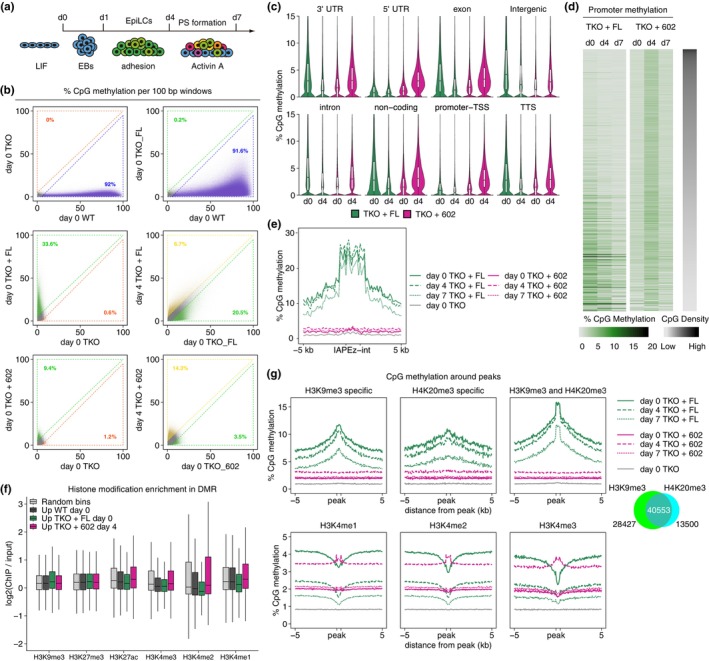
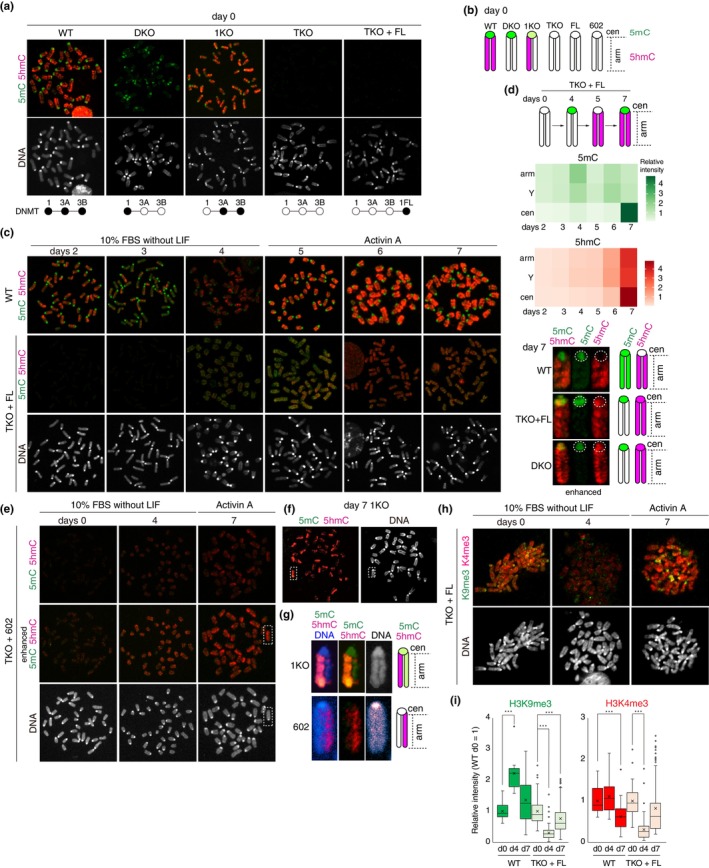
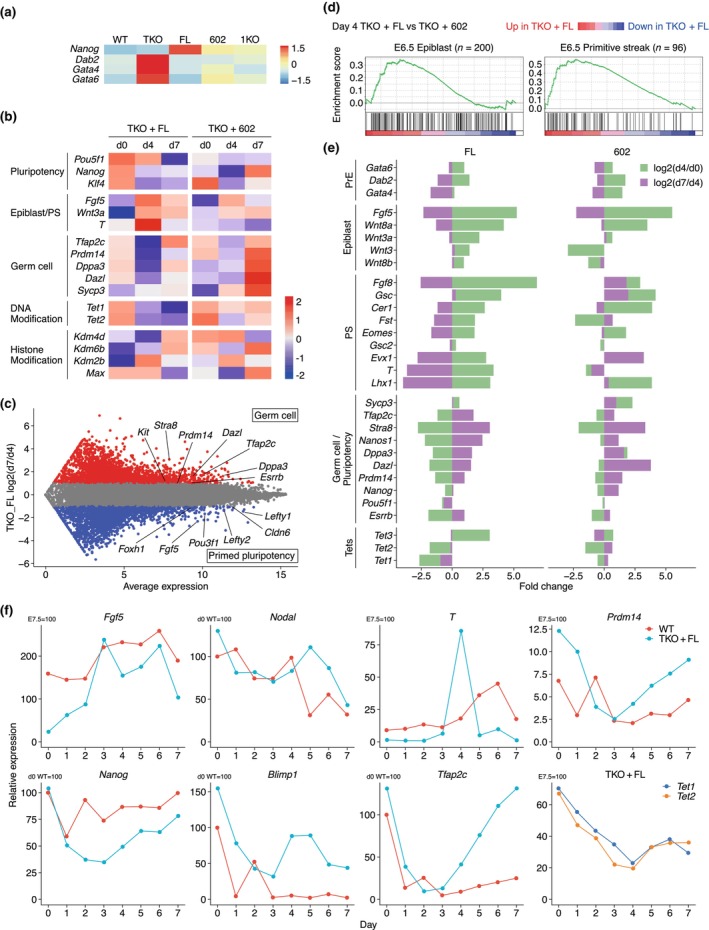
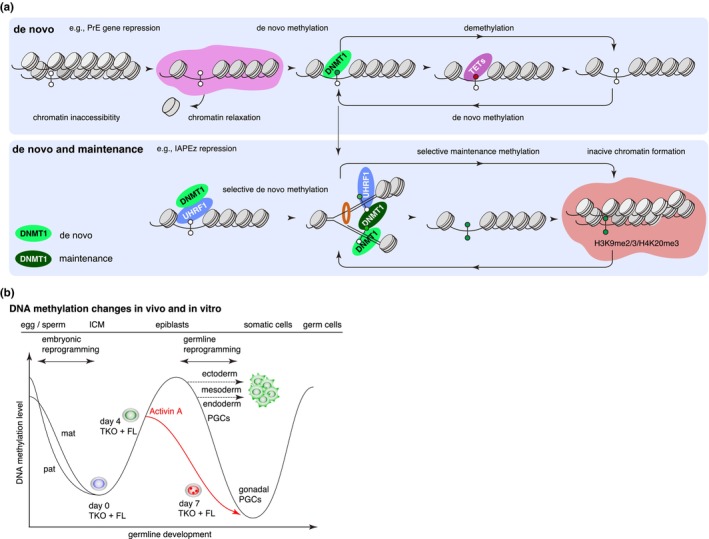
DNA methyltransferases and Ten-Eleven Translocation (TET) proteins regulate the DNA methylation and demethylation cycles during mouse embryonic development. Although DNMT1 mainly plays a role in the maintenance of DNA methylation after DNA replication, it is also reported to possess de novo methyltransferase capacity. However, its physiological significance remains unclear. Here, we demonstrate that full-length DNMT1 (FL) and a mutant lacking the N-terminus necessary for its maintenance activity (602) confer the differentiation potential of mouse Dnmt1, Dnmt3a, and Dnmt3b (Dnmts-TKO) embryonic stem cells (ESCs). Both FL and 602 inhibit the spontaneous differentiation of Dnmts-TKO ESCs in the undifferentiated state. Dnmts-TKO ESCs showed loss of DNA methylation and de-repression of primitive endoderm-related genes, but these defects were partially restored in Dnmts-TKO + FL and Dnmts-TKO + 602 ESCs. Upon differentiation, Dnmts-TKO + FL ESCs show increased 5mC and 5hmC levels across chromosomes, including pericentromeric regions. In contrast, Dnmts-TKO + 602 ESCs didn't accumulate 5mC, and sister chromatids showed 5hmC asynchronously. Furthermore, in comparison with DNMT1_602, DNMT1_FL effectively promoted commitment to the epiblast-like cells and beyond, driving cell-autonomous mesendodermal and germline differentiation through embryoid body-based methods. With precise target selectivity achieved by its N-terminal region, DNMT1 may play a role in gene regulation leading to germline development.

Keywords: DNA methylation; Dnmt1; embryonic stem cells; epigenetics.


Conflict of interest statement

The authors declare no competing interest.

Figures

FIGURE 1
FIGURE 1
DNMT1 targets primitive endoderm (PrE) genes and restores the differentiation potency of Dnm1/3a/3b triple knockout embryonic stem cells (TKO ESCs). (a) Schematic illustration of full‐length DNMT1 (DNMT1_FL) and a DNMT1 deletion mutant (DNMT1_602) lacking 1–602 amino acids, including the PCNA‐binding domain (PBD) and the UHRF1‐binding domain (RFTS), as well as the position of the catalytically inactive C1229S point mutation introduced into DNMT1_FLmut. (b) Schematic diagram of the DNA methyltransferase (DNMT) composition in the ESCs used in this study; present (black box) and absent (crossed out box). (c) Immunoblot analysis of DNMT1 protein expression. Wild‐type (WT) and Dnmt3a/3b double knockout (DKO) ESCs were used as positive controls, while Dnmt1 KO (1KO) and TKO ESCs were used as negative controls. (d) Schematic diagram of cell differentiation during the first 4 days. EBs, embryoid bodies; EpiLCs, epiblast‐like cells. (e) Luminometric ATP‐based cell viability assay during differentiation of TKO, TKO + FL and TKO + 602 ESCs (n = 6, p < .001). (f) Heatmap of coding genes differentially regulated in WT, TKO, TKO + FL and TKO + 602 ESCs based on RNA‐sequencing (RNA‐seq). Of the genes repressed in WT ESCs and upregulated in TKO ESCs (n = 2416), more than half (n = 1651) were repressed in TKO + FL or TKO + 602 ESCs and 842 were repressed in both types of ESCs. These included many PrE genes. (g) Box plot showing methylated cytosine (5mC) levels at PrE gene promoters in TKO, TKO + FL and TKO + 602 ESCs. The p‐values were calculated using the paired Student's t‐test (**p < .01, ***p < .001). NS, not statistically significant. (h) DNA methylation and RNA expression of two representative PrE genes, Dab2 and Gata4, in WT, TKO, TKO + FL and TKO + 602 ESCs detected by whole‐genome bisulfite sequencing (WGBS) and RNA‐seq analysis, and directly compared in the Integrative Genome Viewer (IGV). The percentages shown in the snapshots indicate the methylation level of the promoter region (TSS −2000 bp, +500 bp).
FIGURE 2
FIGURE 2
The N‐terminal domain of DNMT1 promotes site‐specific accumulation of DNA methylation in TKO + FL ESCs. (a) Schematic diagram of 7‐day cell differentiation. PS, primitive streak. (b) DNA methylation correlation plots in a 100 bp window for WT ESCs and TKO ESCs on day 0 (left, top), WT ESCs and TKO + FL ESCs on day 0 (right, top), TKO ESCs and TKO + FL ESCs on day 0 (left, middle), day 0 TKO + FL ESCs and day 4 TKO + FL cells (right, middle), TKO ESCs and TKO + 602 ESCs on day 0 (left, bottom) and day 0 TKO + 602 ESCs and day 4 TKO + 602 cells (right, bottom). (c) Violin plots showing the distribution of CpG methylation levels in day 0 and 4 TKO + FL (green) and TKO + 602 (red) cells. (d) Heatmaps displaying CpG methylation levels (left, green) and corresponding CpG densities (right, black) in promoter regions [−2000 to +500 bp relative to the transcription start site (TSS)] in TKO + FL and TKO + 602 cells on days 0, 4, and 7. (e) Line graph showing CpG methylation enriched around IAPEz‐int in TKO + FL cells but not in TKO + 602 cells on days 0, 4, and 7. (f) Box‐and‐whisker plot showing histone modifications abundant in differentially methylated regions (DMRs) in WT, TKO + FL, and TKO + 602 cells. The ChIP‐seq dataset GSE90895 was used to determine the histone modification profile of ESCs. As shown in the correlation plot in Figure 2b, hyper‐DMRs in day 0 TKO + FL ESCs include 966,929 loci (green) compared with day 0 TKO ESCs and those in day 4 TKO + 602 cells include 408,947 loci (red) compared with day 0 TKO + 602 ESCs. Hyper‐DMRs in WT ESCs (gray) compared with day 0 TKO ESCs and random 100 bp bins of 1 million (light gray) are shown as controls. (g) Line graphs show CpG methylation around histone modification peaks. The ChIP‐seq dataset GSE94086 defines regions marked with H3K9me3 and H4K20me3 (top). Furthermore, the ChIP‐seq dataset GSE90895 defines regions marked with H3K4me1–3 (bottom). All datasets used here are listed in Table S1.
FIGURE 3
FIGURE 3
Spreading of genome‐wide de novo DNA methylation by DNMT1 with chromatin reprogramming. (a) Representative immunofluorescence (IF) staining images of mitotic chromosome spreads for 5‐methylcytosine (5mC, green) and 5‐hydroxymethylcytosine (5hmC, red) in undifferentiated (day 0) WT, DKO, 1KO, TKO, and TKO + FL ESCs (n = 10 per cell line). The presence and absence of Dnmt genes in each cell type are indicated by black and white circles, respectively. (b) Schematic illustrations of the typical IF staining pattern of mitotic chromosomes in each ESC line. (c) Representative IF‐stained images of mitotic chromosome spreads showing daily changes in 5mC and 5hmC patterns of WT and TKO + FL ESCs during differentiation from day 2 to day 7. (d) Schematic illustrations showing stepwise changes in the IF staining pattern of mitotic chromosomes in TKO + FL cells (top). Heatmaps depicting relative IF staining intensities of chromosomal arms (arm), the Y chromosome (Y) and pericentromeric heterochromatin (cen) for 5mC and 5hmC in TKO + FL ESCs during differentiation (n = 15 per day, middle). The average IF staining signal intensities of 5mC and 5hmC in all samples were set to 1. Typical IF staining patterns of 5mC and 5hmC enhanced by simply digital modification in chromosomes of WT, TKO + FL and DKO cells on day 7 are shown (bottom). The schematic illustration shows the main features of the IF staining patterns in TKO + FL and DKO cells on day 7; 5hmC signals were not detected around centromeres in WT cells but were detected around centromeres in TKO + FL and DKO cells on day 7 (bottom, right). (e) Representative IF staining images of mitotic chromosome spreads for 5mC and 5hmC in TKO + 602 ESCs during differentiation. The IF‐stained image in the middle row was enhanced using a simple digital process. (f) Representative IF staining patterns of 5mC and 5hmC in differentiated 1KO cells on day 7. (g) Enlarged images of IF‐stained chromosomes and a schematic diagram showing accumulation of 5hmC on one side of sister chromatids and the absence of 5mC around centromeres in day 7 TKO + 602 cells. Chromosomes enlarged in g are indicated by dotted lines in e and f. (h) Representative IF staining images of mitotic chromosome spreads showing changes in the levels of H3K9me3 (green) and H3K4me3 (red) during differentiation of TKO + FL ESCs. Images are also shown in Figure S7. (i) Box‐and‐whisker plot showing the relative IF signal intensities of H3K9me3 and H3K4me3 in WT (mean n = 24 per day) and TKO + FL (mean n = 91 per day) ESCs during differentiation, with the average signal intensity in WT ESCs on day 0 set to 1.
FIGURE 4
FIGURE 4
DNMT1_FL promotes epiblast and mesendodermal differentiation of TKO ESCs. (a) Heatmap showing differential expression of pluripotency‐ and PrE‐related genes determined by RNA‐seq of WT, TKO, TKO + FL (FL), TKO + 602 (602), and 1KO ESCs (n = 1). (b) Heatmap showing differential expression of developmental genes determined by microarray analysis of TKO + FL and TKO + 602 ESCs on days 0, 4, and 7 of differentiation (n = 1). (c) MA plot showing changes in gene expression levels from day 4 to day 7 in TKO + FL cells. Up‐ and down‐regulated genes are highlighted in red and blue, respectively. (d) GSEA shows that genes up‐regulated in TKO + FL compared with TKO + 602 at day 4 of differentiation are enriched in the E6.5 Epiblast and primitive streak gene set. (e) Bar graphs showing changes in expression levels of PrE‐, epiblast‐, PS‐, and PGC‐related genes and Tet1‐3 from day 0 to day 4 (light green) and from day 4 to day 7 (purple) during differentiation of TKO + FL and TKO + 602 ESCs based on microarray analysis. Differences between the graphs of TKO + FL and TKO + 602 ESCs represent differences in cell differentiation potency. All datasets used in this study are presented in Table S1. (f) Line graphs showing daily changes in the expression levels of PS‐specific genes (T and Nodal), an epiblast gene (Fgf5), a pluripotency‐related gene (Nanog) and primordial germ cell (PGC)‐related genes (Blimp1, Prdm14, and Tfap2c) in TKO + FL and WT cells during differentiation determined by RT‐qPCR. The results also show differences in differentiation potency between WT and TKO + FL ESCs. Daily changes in Tet1/2 expression levels detected by RT‐qPCR in TKO + FL cells during differentiation are also shown. Relative expression was calculated as ∆∆Ct of day 0 WT ESCs or E7.5 mouse embryos as 100.
FIGURE 5
FIGURE 5
Models highlighting the dual roles of DNMT1 in the regulation of de novo and maintenance of DNA methylation and its physiological function in cell differentiation. (a) The de novo DNA methylation activity of DNMT1 can promote the differentiation of TKO ESCs into cell states mimicking epiblast and PS formation (top). By contrast, the N‐terminal region of DNMT1 regulates region‐specific de novo DNA methylation, such as of IAPEz retrotransposons, and region‐specific maintenance DNA methylation (bottom). (b) Schematic diagram showing similar changes in DNA methylation levels occurring in the germline during mouse embryonic development and in vitro differentiation of TKO + FL ESCs (black lines) and specifically during differentiation of TKO + FL ESCs (red line).

Similar articles

References

    1. Aramaki, S. , Hayashi, K. , Kurimoto, K. , Ohta, H. , Yabuta, Y. , Iwanari, H. , Mochizuki, Y. , Hamakubo, T. , Kato, Y. , Shirahige, K. , & Saitou, M. (2013). A mesodermal factor, T, specifies mouse germ cell fate by directly activating germline determinants. Developmental Cell, 27, 516–529. - PubMed
    1. Barau, J. , Teissandier, A. , Zamudio, N. , Roy, S. , Nalesso, V. , Hérault, Y. , Guillou, F. , & Bourc'his, D. (2016). The DNA methyltransferase DNMT3C protects male germ cells from transposon activity. Science, 354, 912. - PubMed
    1. Beck, S. , Le Good, J. A. , Guzman, M. , Haim, N. B. , Roy, K. , Beermann, F. , & Constam, D. B. (2002). Extraembryonic proteases regulate nodal signalling during gastrulation. Nature Cell Biology, 4, 981–985. - PubMed
    1. Becker, S. , Casanova, J. , & Grabel, L. (1992). Localization of endoderm‐specific mRNAs in differentiating F9 embryoid bodies. Mechanisms of Development, 37, 3–12. - PubMed
    1. Cao, Y. P. , Sun, J. Y. , Li, M. Q. , Dong, Y. , Zhang, Y. H. , Yan, J. , Huang, R. M. , & Yan, X. (2019). Inhibition of G9a by a small molecule inhibitor, UNC0642, induces apoptosis of human bladder cancer cells. Acta Pharmacologica Sinica, 40, 1076–1084. - PMC - PubMed

MeSH terms

Substances

LinkOut - more resources