. 2024 Aug 1;30(15):3229-3242.
doi: 10.1158/1078-0432.CCR-23-3960.

Clinical Implications and Molecular Features of Extracellular Matrix Networks in Soft Tissue Sarcomas

Affiliations

Clinical Implications and Molecular Features of Extracellular Matrix Networks in Soft Tissue Sarcomas

Valeriya Pankova et al. Clin Cancer Res. .

Abstract

Purpose: The landscape of extracellular matrix (ECM) alterations in soft tissue sarcomas (STS) remains poorly characterized. We aimed to investigate the tumor ECM and adhesion signaling networks present in STS and their clinical implications.

Experimental design: Proteomic and clinical data from 321 patients across 11 histological subtypes were analyzed to define ECM and integrin adhesion networks. Subgroup analysis was performed in leiomyosarcomas (LMS), dedifferentiated liposarcomas (DDLPS), and undifferentiated pleomorphic sarcomas (UPS).

Results: This analysis defined subtype-specific ECM profiles including enrichment of basement membrane proteins in LMS and ECM proteases in UPS. Across the cohort, we identified three distinct coregulated ECM networks which are associated with tumor malignancy grade and histological subtype. Comparative analysis of LMS cell line and patient proteomic data identified the lymphocyte cytosolic protein 1 cytoskeletal protein as a prognostic factor in LMS. Characterization of ECM network events in DDLPS revealed three subtypes with distinct oncogenic signaling pathways and survival outcomes. Evaluation of the DDLPS subtype with the poorest prognosis nominates ECM remodeling proteins as candidate antistromal therapeutic targets. Finally, we define a proteoglycan signature that is an independent prognostic factor for overall survival in DDLPS and UPS.

Conclusions: STS comprise heterogeneous ECM signaling networks and matrix-specific features that have utility for risk stratification and therapy selection, which could in future guide precision medicine in these rare cancers.


Conflict of interest statement

A.T.J. Lee reports personal fees from Alexion, AstraZeneca, and Deciphera outside the submitted work. P. Chudasama reports grants and other support from the German Research Foundation and German Federal Ministry of Education and Research during the conduct of the study. R.L. Jones reports personal fees from Adaptimmune, Astex, Athenex, Bayer, BI, Blueprint, Clinigen, Eisai, Epizyme, Daichii, Deciphera, Immunedesign, Immunicum, Karma Oncology, Lilly, Merck, Mundipharma, Pharmamar, Springworks, SynOx, Tracon, and UpToDate outside the submitted work. P.H. Huang reports grants from Sarcoma UK, Cancer Research UK, Sarcoma Foundation of America, National Institute for Health Research, and Bristol Care Homes during the conduct of the study. No disclosures were reported by the other authors.

Figures
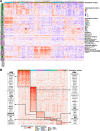
Figure 1.
Figure 1.
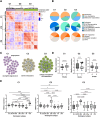
The matrisome and adhesome landscape of soft tissue sarcomas (STS). A, Annotated heatmap illustrating the unsupervised clustering (Pearson’s correlation distance) of 302 matrisome and adhesome components in the STS cohort. Top annotation panel correspond to histological subtype. The annotation on the (left) side shows proteins belonging to matrisome or adhesome databases and the breakdown into matrisome and adhesome functional classes. B, Heatmap showing matrisome and adhesome proteins uniquely upregulated (indicated by black boxes) in histological subtypes (false discovery rate <0.01, fold change ≥2), arranged by histological subtype. A selection of matrisome proteins which are upregulated in each histological subtype is shown. AS, angiosarcoma; ASPS, alveolar soft part sarcoma; CCS, clear cell sarcoma; DSRCT, desmoplastic small round cell tumor; ES, epithelioid sarcoma; RT, rhabdoid tumor.
Figure 2.
Figure 2.
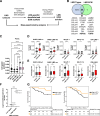
Matrisome and adhesome networks in STS. A, Heatmap showing a similarity matrix of Pearson’s correlation coefficients for all pairwise comparisons of matrisome and adhesome proteins. Heatmap is split into three clusters (C1, C2, and C3) identified by consensus clustering analysis. B, Pie charts showing breakdown of proteins within the clusters into adhesome, core matrisome, or matrisome-associated proteins (top), breakdown by matrisome class (middle) and by functional annotation of adhesome (bottom). C, Selected protein–protein interaction networks (colored by clusters) are shown for each cluster as identified by enrichment analysis (reactome pathways). D, Box plots showing distributions of median expression of C1, C2 and C3 proteins across tumor grades. Boxes indicate 25th and 75th percentile, with the median line in the middle, whiskers extending from 25th percentile − [1.5 × interquartile range (IQR)] to 75th percentile + (1.5 × IQR), and outliers plotted as points. Significance determined by Mann–Whitney U test. ***, P < 0.001; ****, P < 0.0001. E, Box plots showing distributions of median expression of C1, C2 and C3 proteins across histological subtypes. Boxes indicate 25th and 75th percentile, with the median line in the middle, whiskers extending from 25th percentile − (1.5 × IQR) to 75th percentile + (1.5 × IQR), and outliers plotted as points. Significance determined by Kruskal–Wallis tests with Dunn’s multiple corrections tests. *, P < 0.05; **, P < 0.01; ****, P < 0.0001. Other, ASPS, alveolar soft part sarcoma; CCS, clear cell sarcoma; DSRCT, desmoplastic small round cell tumor; ES, epithelioid sarcoma; RT, rhabdoid tumor.
Figure 3.
Figure 3.
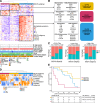
Generation and characterization of LMS ECM solution. A, A workflow to generate decellularized ECM LMS scaffolds from fresh frozen LMS tumors by extensive washes with detergent and generation of LMS ECM solution by incubating dried scaffolds with acidified pepsin, followed by neutralization with sodium hydroxide. Paired tumor and solidified LMS ECM solution samples were characterized by mass spectrometry. B, Venn diagram showing overlap of matrisome protein IDs consistently detected in all tumors and LMS ECM solution samples. Identities of 24 overlapping proteins are shown at the bottom. C, Box plots showing the 2D migration cell speed on plastic in GFP+ SK-UT-1 (n = 910), SK-UT-1b (n = 495), ICR-LMS-1 (n = 528), SHEF-LMS w1 (n = 996), and SHEF-LMS ws (n = 1,024) cells over 18 hours. Significance is shown following Kruskal–Wallis test with Dunn’s multiple testing correction. ****, P < 0.0001. D, Box plots showing the cell speed of GFP+ LMS cell lines on plastic or plastic precoated with LMS ECM solution. Significance is shown following Mann–Whitney U test. *, P < 0.05; **, P < 0.01; ****, P < 0.0001. E, Box plots showing the directionality indices of GFP+ LMS cell lines when grown in 2D conditions on plastic or plastic precoated with LMS ECM solution. Significance is shown following Mann–Whitney U test. *, P < 0.05; **, P < 0.01; ****, P < 0.0001. The GFP+ cells were tracked for 18 hours. Data were pooled from three independent experiments for all graphs. Boxes indicate the 25th, median, and 75th percentile, with whiskers extending from the 25th percentile − (1.5 × IQR) to the 75th percentile + (1.5 × IQR), and outliers plotted as points. F, Dot plot showing log2 normalized expression of LCP1 protein in low baseline speed cell lines (SK-UT-1, SK-UT-1B, and ICR-LMS-1), and in high baseline speed cell lines (SHEF-LMS w1 and SHEF-LMS ws). G, Kaplan–Meier plot of LRFS (left) and OS (right) with stratification by LCP1 tertiles in n = 80 LMS patients. Low LCP1 group contains patients with lower tertile (≤ −0.23 LCP1 expression), while high LCP1 group is made up of intermediate and high tertiles (> −0.23 LCP1). Hazard ratio, 95% CI, and P-values were determined by univariate Cox regression with a two-sided Wald test.
Figure 4.
Figure 4.
Identification, biological and clinical characterization of DDLPS subgroups. A, Heatmap showing the supervised clustering of 57 differentially expressed matrisome and adhesome proteins (DEPs) uniquely upregulated in each DDLPS subgroup. Black boxes indicate unique upregulated matrisome and adhesome DEPs in each of the subgroups. Bottom annotations indicate key tumor and patient characteristics. “*” Indicates that a clinical feature is significantly associated with DDLPS subgroups. B, Identities of upregulated matrisome and adhesome proteins in each DDLPS subgroup are shown on the right. Colored boxes on the right show functional pathways enriched in each DDLPS subgroup, as determined by overrepresentation analysis against the reactome pathway database. (C) Stacked bar charts showing the percentages of high and low CD3+, CD4+, and CD8+ TIL groups in each DDLPS subgroup. DDLPS cases were divided into high and low categories according to the median TILs score, separately for each stain. The χ2 test results are presented at the top of each plot. D, Significant (one-way ANOVA; FDR < 0.05) biological features obtained from ssGSEA of the MSigDB Hallmark gene sets. E, Kaplan–Meier plot of LRFS with stratification by DDLPS subgroups. Hazard ratio, 95% CI, and P-values were determined by univariate Cox regression with a two-sided Wald test.
Figure 5.
Figure 5.
Proteoglycan protein expression identifies a high-risk STS group. A, Summary of log-rank tests used to assess significant associations of matrisome-related gene sets with LRFS, MFS, and OS. The scores for each patient were obtained by taking the median expression focusing on 10 matrisome-related gene sets from the Molecular Signatures Database. B, Identities of the 11 proteoglycans included in the proteoglycan score. C, Kaplan–Meier plot of OS with stratification by the median expression of 11 proteoglycans in a combined UPS and DDLPS cohort (n = 92). D, Kaplan–Meier plot of OS with stratification by the ssGSEA score of 11 proteoglycans in a combined UPS and DDLPS cohort (n = 92). Hazard ratio, 95% CI, and P-values were determined by univariate Cox regression with a two-sided Wald test.

Similar articles

Cited by

References

    1. Stiller CA, Trama A, Serraino D, Rossi S, Navarro C, Chirlaque MD, et al. . Descriptive epidemiology of sarcomas in Europe: report from the RARECARE project. Eur J Cancer 2013;49:684–95. - PubMed
    1. Pankova V, Thway K, Jones RL, Huang PH. The extracellular matrix in soft tissue sarcomas: pathobiology and cellular signalling. Front Cell Dev Biol 2021;9:763640. - PMC - PubMed
    1. Pickup MW, Mouw JK, Weaver VM. The extracellular matrix modulates the hallmarks of cancer. EMBO Rep 2014;15:1243–53. - PMC - PubMed
    1. Zaidel-Bar R, Itzkovitz S, Ma’ayan A, Iyengar R, Geiger B. Functional atlas of the integrin adhesome. Nat Cell Biol 2007;9:858–67. - PMC - PubMed
    1. Winograd-Katz SE, Fassler R, Geiger B, Legate KR. The integrin adhesome: from genes and proteins to human disease. Nat Rev Mol Cell Biol 2014;15:273–88. - PubMed

Substances