. 2024 May 27;21(1):134.
doi: 10.1186/s12974-024-03132-5.

Neither injury induced macrophages within the nerve, nor the environment created by Wallerian degeneration is necessary for enhanced in vivo axon regeneration after peripheral nerve injury

Affiliations

Neither injury induced macrophages within the nerve, nor the environment created by Wallerian degeneration is necessary for enhanced in vivo axon regeneration after peripheral nerve injury

Aaron D Talsma et al. J Neuroinflammation. .

Abstract

Background: Since the 1990s, evidence has accumulated that macrophages promote peripheral nerve regeneration and are required for enhancing regeneration in the conditioning lesion (CL) response. After a sciatic nerve injury, macrophages accumulate in the injury site, the nerve distal to that site, and the axotomized dorsal root ganglia (DRGs). In the peripheral nervous system, as in other tissues, the macrophage response is derived from both resident macrophages and recruited monocyte-derived macrophages (MDMs). Unresolved questions are: at which sites do macrophages enhance nerve regeneration, and is a particular population needed.

Methods: Ccr2 knock-out (KO) and Ccr2gfp/gfp knock-in/KO mice were used to prevent MDM recruitment. Using these strains in a sciatic CL paradigm, we examined the necessity of MDMs and residents for CL-enhanced regeneration in vivo and characterized injury-induced nerve inflammation. CL paradigm variants, including the addition of pharmacological macrophage depletion methods, tested the role of various macrophage populations in initiating or sustaining the CL response. In vivo regeneration, measured from bilateral proximal test lesions (TLs) after 2 d, and macrophages were quantified by immunofluorescent staining.

Results: Peripheral CL-enhanced regeneration was equivalent between crush and transection CLs and was sustained for 28 days in both Ccr2 KO and WT mice despite MDM depletion. Similarly, the central CL response measured in dorsal roots was unchanged in Ccr2 KO mice. Macrophages at both the TL and CL, but not between them, stained for the pro-regenerative marker, arginase 1. TL macrophages were primarily CCR2-dependent MDMs and nearly absent in Ccr2 KO and Ccr2gfp/gfp KO mice. However, there were only slightly fewer Arg1+ macrophages in CCR2 null CLs than controls due to resident macrophage compensation. Zymosan injection into an intact WT sciatic nerve recruited Arg1+ macrophages but did not enhance regeneration. Finally, clodronate injection into Ccr2gfp KO CLs dramatically reduced CL macrophages. Combined with the Ccr2gfp KO background, depleting MDMs and TL macrophages, and a transection CL, physically removing the distal nerve environment, nearly all macrophages in the nerve were removed, yet CL-enhanced regeneration was not impaired.

Conclusions: Macrophages in the sciatic nerve are neither necessary nor sufficient to produce a CL response.

Keywords: Arginase 1; Axotomy; CCR2; Clodronate; Conditioning lesion; Dorsal root; Macrophages; Neuroimmune; Regeneration; Zymosan.


Conflict of interest statement

The authors declare no competing interests.

Figures

Fig. 1
Fig. 1
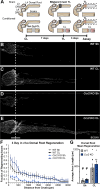
Sciatic nerves of Ccr2 KO animals show normal regeneration after a single crush injury and CL-enhanced regeneration. WT and Ccr2 KO animals underwent an in vivo CL assay: a unilateral distal sciatic nerve injury, either a crush or transection, followed by a 7 d conditioning period, then bilateral proximal crush test lesions followed by 2 d for regeneration. A, H. Diagram showing the time course and relative positions of the CL and TL performed on sciatic nerves for the in vivo Crush CL (A) or Cut CL (H) assays, and the dotted box indicates the tissue area examined for the assays. B-E and I-L. Representative images of regenerating nerves from WT and Ccr2 KO mice immunostained for SCG10, which labels regenerating sensory axons, in 40 μm sections. F, M. Axon regeneration quantified at 100 μm intervals as the fraction of regenerating axons relative to the crush site for WT and Ccr2 KO mice after a Crush CL (F) and a Cut CL (H). G, N, O. Mean regeneration distance calculated by integrating SCG10 immunofluorescent staining of regenerating axons for WT and Ccr2 KO mice after a Crush CL (G) and a Cut CL (N). O. Comparison of Crush and Cut conditioned regeneration distance. Unconditioned regeneration (Sh; B, D, I, K), represents the baseline growth rate. Conditioned regeneration (CL; C, E, J, L) was the same between genotypes and type of CL, and significantly increased compared to contralateral unconditioned nerves. The dotted line indicates the center of the crush site which was considered to be 500 μm wide, and the solid line is 3000 μm from the crush. Scale bar = 500 μm. # indicates a significant (p < 0.05) difference between the Sh (unconditioned) and CL (conditioned) regeneration within a genotype. N = 24 WT Crush, 22 WT Cut, 15 Ccr2 KO Crush, 17 Ccr2 KO Cut
Fig. 2
Fig. 2
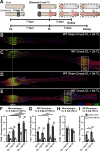
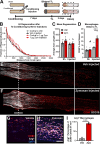
The central process of sensory neurons shows enhanced regeneration after a peripheral CL in Ccr2 KO animals. A. Diagram showing the sciatic CL, dorsal root TLs and the time course used for the in vivo dorsal root regeneration assay performed on WT and Ccr2 KO animals. B-E. Representative images of regenerating dorsal roots immunostained for SCG10 in 40 μm sections. Unconditioned regeneration (B, D) shows that the poor intrinsic regenerative capacity of dorsal root axons is the same in both genotypes. Conditioned regeneration (CL; C, F) was also the same between genotypes and significantly increased compared to contralateral unconditioned roots. The dotted line indicates the center of the crush site which was considered to be 500 μm wide, and the solid line is 3000 μm from the crush. Scale bar = 500 μm. F. Axon regeneration quantified at 100 μm intervals as the fraction of regenerating axons relative to the axons in the 300 μm proximal to the crush site. The fraction of axons at each distance from the crush was calculated from ratios of SCG10 immunofluorescence. G. Mean regeneration distance calculated by integrating SCG10 immunofluorescent staining of regenerating axons. # indicates a significant (p < 0.05) difference between the Sh (unconditioned) and CL (conditioned) regeneration within a genotype. N = 7–8 per group
Fig. 3
Fig. 3
Arginase 1 expression is primarily associated with macrophages within crush sites. A. Diagram showing WT animals given a unilateral 7 d crush CL, followed by crush TLs with a 2 d or 5 d regeneration period. The dotted box indicates the area examined in the assays. The “Sham” contralateral nerve only received the TL. B-C. Representative sciatic nerves from animals given a crush CL and a 2 d TL, immunostained for the macrophage marker CD68 and the proregenerative macrophage marker arginase 1 (Arg1). D-E. Representative sciatic nerves from animals given a crush CL and a 5 d TL, immunostained for CD68 and Arg1. For B-E, the dotted line indicates the center of the crush TL which was nominally 600 μm wide, and the box is 600 μm wide and placed at the crush CL. F. Macrophages at and immediately distal to the TL site represented by CD68 percent area stained. CD68 was measured for all groups by placing a 600 μm wide rectangular ROI centered over the TL site (Lesion Site) and then a second 600 μm wide ROI adjacent to the distal edge of the first ROI (Distal Nerve). ROIs were adjusted for the height of the nerve. G. M2 phenotype in macrophages at and immediately distal to the TL site represented by Arg1 percent area stained. Arg1 was measured for all groups as in F. H. Macrophages at and immediately distal to the CL site represented by CD68 percent area stained. CD68 was measured for all groups as in F except the first ROI was placed over the CL site. I. M2 phenotype in macrophages at and immediately distal to the CL site represented by Arg1 percent area stained. Arg1 was measured for all groups as in H. Scale bar = 500 μm. * p < 0.05; ** p < 0.01; *** p < 0.001. N = 4–5 per group
Fig. 4
Fig. 4
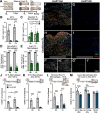
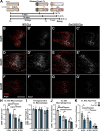
TL site macrophages are primarily CCR2+ MDMs and are rapidly recruited to control but not Ccr2 null TL sites. A. Diagram showing the lesion paradigm with the dotted boxes indicating the location quantified in B-I. B-E. Quantification of the macrophages responding to the Ccr2gfp het and KO TLs shown in F-I. Ten micron sections were immunostained with CD68 to label all macrophages, GFP to label infiltrating MDMs, and Arg1 to label proregenerative macrophages and cells were counted in a 600 µm wide by 300 µm tall area centered on the TL. B. The total macrophages in the TL sites is represented by the number of CD68+ cells per 0.01 mm2 and is significantly higher in both Ccr2gfp het TL sites compared to the KOs. C. Resident macrophages quantified as CD68+GFP cells per 0.01 mm2. D. Recruited macrophages quantified by percentage of CD68+GFP+ cells per 0.01 mm2. Nearly all TL site macrophages are derived from CCR2+ infiltrating monocytes and are absent in the 2 d TL of Ccr2gfp KOs. E. The percentage of CD68+ macrophages per 0.01 mm2 that express Arg1 are significantly decreased in Ccr2gfp KOs. F-I. Representative images of macrophages in the TL sites of Ccr2gfp het and KO animals from a CL paradigm. F’-I’. Insets of Arg1 staining in images in A-D. J-M. Ccr2 KOs also have greatly diminished numbers of macrophages in their TLs compared to WT, quantified by the percent area stained of CD68 in the TL site of 40 μm sections. Macrophages are significantly reduced from Ccr2 KO TLs in both the 14 d CL paradigm (I) and the 28 d CL paradigm (J) as well as dorsal root TL 3 d after injury (K). L. Quantification of TL sites in the 7 d CL with a 5 d TL injury paradigm shows that the macrophage deficiency is largely temporary. Scale bar = 600 μm. ** p < 0.01; *** p < 0.001. N = 7–10 per group
Fig. 5
Fig. 5
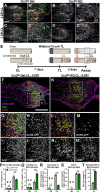
Cut axons reside in the CL with macrophages during the conditioning period, and Arg1+ CL site macrophages can be derived from either CCR2+ recruited macrophages or CCR2 resident macrophages. A-D. Representative images of the proximal CL 4 and 7 days post-injury (DPI) of Ccr2gfp hets and KOs, showing axons residing near CL macrophages during the conditioning period. Ten micron sections were immunostained for SCG10 labeling cut and regenerating axons, CD68 labeling all macrophages, and GFP labeling recruited macrophages. Dotted box indicates the area displayed in A’-D’. Scale bar = 250 μm. A’-D’. Enlarged 500 by 600 μm images from A-D. E. Diagram showing the lesion paradigm with the dotted boxes indicating the location examined in F-S. F-O. Representative images of Ccr2gfp het and KO proximal CLs after the in vivo regeneration paradigm. F, K. Ten micron sections immunostained for GFP, labeling recruited CCR2+ macrophages shown in magenta, CD68, labeling all macrophages shown in red, and Arg1, labeling proregenerative macrophages shown in green. With these colors, recruited Arg1+CD68+GFP+ macrophages appear white and resident Arg1+CD68+GFP macrophages appear yellow. Arg1 resident (CD68+ GFP) and recruited (CD68+ GFP+) appear red and magenta, respectively. Dotted boxes indicate the magnified images in G-H and L-O. Scale bar = 500 μm. G-J. Enlarged portion of the Ccr2gfp het CL site in F illustrates that most macrophages are Arg1+CCR2+ recruited macrophages although a few are resident derived. H-J Show single grayscale channels of G. L-O. Enlarged portion of the Ccr2gfp KO CL site in K illustrates macrophages are mostly resident derived (CD68+CCR2 cells) but are still Arg1+. M-O Show single channel grayscale images from L. P-S. Quantification of the macrophages in the CL sites shown in F-O by counting cells in an approximately 250 μm square centered on the inflammation at the cut nerve end in CLs or 3 mm distal to the TL in Sh. P. Total macrophages in the CL site, quantified as the number of CD68+ cells per 0.01 mm2, is significantly higher in Ccr2gfp hets compared to KOs. Q. Resident macrophages, quantified as the number of GFPCD68+ cells per 0.01 mm2, shows a significant increase in residents in Ccr2gfp KO CLs compared to Ccr2gfp hets. R. Recruited macrophages quantified as the GFP+ percentage of CD68+ cells per 0.01 mm2. Most CL macrophages are GFP+ in Ccr2gfp hets, indicating they are derived from CCR2+ infiltrating monocytes, and are reduced but not absent in Ccr2gfp KOs. S. M2 macrophages, quantified as the Arg1+ percentage of CD68+ cells per 0.01 mm2, demonstrates similar proportions of M2 CL macrophages in both genotypes. T. Proportion of M2 macrophages derived from residents, quantified as the GFP percentage of Arg1+CD68+ cells per 0.01 mm2, reveals residents expand and adopt the appropriate phenotype when MDMs are deficient in Ccr2gfp KOs. ** p < 0.01. *** p < 0.001. # indicates a significant (p < 0.05) difference between the Sh (unconditioned) and CL (conditioned) groups within a genotype. N = 6–7 per group
Fig. 6
Fig. 6
Arg1+ macrophages are still observed in the CL sites of both WT and Ccr2 KO animals at 30 d after the CL. A. Diagram showing the lesion paradigms used with the dotted box indicating the location quantified in B-K. B-G’. Representative images of Arg1+ macrophages in WT and Ccr2 KO CL sites from 7 d CL (B-C’), 14 d CL (D-E’), and 28 d CL (F-G’) paradigms displayed as CD68 and Arg1 colabeling (B-G) and Arg1 alone (B’-G’) in 10 μm sections. H. CL site macrophages were quantified by counting CD68 labeled cells within two 300 μm diameter circles centered on the inflammation at the nerve end and expressed as CD68+ cells per 0.01 mm2. I. Arg1+ macrophages were quantified by counting cells with immunofluorescence staining that colocalized with CD68+ cells and expressed as the percentage of Arg1+ CD68+ cells. J. Macrophages quantified by measuring the percent area of the CL labeled by CD68 which represents relative macrophage area. I. Total Arg1 expression quantified by the percent area of the CL labeled by Arg1. Scale bar = 500 μm. * p < 0.05. ** p < 0.01. N = 4–8 per group
Fig. 7
Fig. 7
Zymosan induced recruitment of macrophages into the sciatic nerve does not condition axons. A. Diagram of the zymosan conditioning paradigm in which WT sciatic nerves received a unilateral conditioning injection of zymosan (Zym) or vehicle (Veh) 7 d before the nerves were given bilateral crush TLs and assayed after a 2 d regeneration period. B. Axon regeneration quantified at 100 μm intervals as the fraction of regenerating axons relative to the crush site using SCG10 staining. C. Mean regeneration distance calculated by integrating SCG10 immunofluorescent staining of regenerating axons. D. Macrophages in the 3 mm immediately distal to the TL measured by the percent area immunostained for CD68. E-F. Representative images of regenerating nerves immunostained for regenerating axons with SCG10 and macrophages with CD68 in 40 μm sections. The dotted line indicates the center of the crush site which was considered to be 500 μm wide, and the solid line is 3000 μm from the crush. Scale bar = 500 μm. Forty-micron sections were used in B-E. G-H. Vehicle and zymosan injected nerves were stained for CD68, Arg1, and DAPI. I. Arg1 expressing macrophages were quantified by the percentage of CD68+ cells that express Arg1 per 0.01 mm2. Scale bar = 100 μm. # indicates a significant (p < 0.05) difference between the Sh (unconditioned) and Injected (conditioned) regeneration within treatment groups (vehicle or zymosan). *** p < 0.001. N = 4–8 per group
Fig. 8
Fig. 8
Effect of driving CL-macrophages toward an M1 phenotype on CL-enhanced regeneration. A. Diagram showing the CL paradigm performed on WT animals with daily CL injections to pharmacologically inhibit an M2 phenotype and promote an M1 phenotype at the CL. The arginase inhibitor, nor-NOHA (left, B-K), or an M1 stimulation cocktail, containing LPS and a STAT6 inhibitor (right, L-U), was injected daily into the CL site to polarize the macrophages from M2 to M1. A-B, L-M. Representative images for vehicle and arginase inhibitor (A-B), or M1 stimulation cocktail (L-M) treated mice showing CD68, Arg1, and iNOS, immunostaining. CD68 is shown in blue so that macrophages co-labeled with Arg1 will appear Cyan and those co-labeled with iNOS will appear magenta. Triple labeled cells will appear white. Note the increase in magenta cells and decrease in cyan cells in the nor-NOHA treated CL (C), compared to the increase in white cells with few magenta cells in the M1 stim CL (M). Scale bar = 100 μm in A, B, L, M. D, N. Macrophage number, displayed as cells per 0.01 mm2, was not altered by the treatment. E, O. The percentage of CD68+ macrophages expressing Arg1 after the arginase inhibitor (E) or M1 stimulation cocktail (O) treatment compared to vehicle controls. F, P. The percentage of CD68+ macrophages expressing iNOS after arginase inhibitor (F) or M1 stimulation cocktail (P) treatment compared to vehicle. G, Q. Axon regeneration quantified at 100 μm intervals as the fraction of regenerating axons relative to the crush site for arginase inhibitor (G) or M1 stimulation (Q) treated nerves. H, R. Mean regeneration distance calculated by integrating SCG10 immunofluorescent staining of regenerating axons for arginase inhibitor (H) or M1 stimulation (R) treated nerves. I-K, S-U. Representative images of regenerating nerves treated with arginase inhibitor (I-K) or M1 stimulation cocktail (S-U) immunostained for regenerating axons with SCG10 in 40 μm sections. Unconditioned regeneration (I, S) was the same for both treatment groups. Conditioned regeneration (J-K, T-U) was also the same between treatments and significantly increased compared to contralateral uninjected nerves. The dotted line indicates the center of the crush site which was considered to be 500 μm wide, and the solid line is 3000 μm from the crush. Scale bar = 500 μm in I-K, S-U. * p < 0.05. *** p < 0.001. # p < 0.05 between injury groups within the same treatment group. N = 4–11 per group
Fig. 9
Fig. 9
Clodronate liposomes injected into the CL site of Ccr2gfp KO mice significantly reduces macrophages but does not prevent the peripheral CL response. A. Diagram depicting a CL paradigm performed on Ccr2gfp KO animals in which CL macrophages were targeted for ablation by injecting clodronate liposomes into the proximal CL site on the day of the CL (day 0) the next day (day 1) and every other day thereafter. Control animals received vehicle liposome injections instead. B-E. Representative images of regenerating nerves immunostained for regenerating axons with SCG10. Unconditioned regeneration (B, D) was the same for both treatment groups. Conditioned regeneration (C, E) was also the same between treatments and significantly increased compared to contralateral uninjected nerves. The dotted line indicates the center of the crush site which was considered to be 500 µm wide, and the solid line is 3000 µm from the crush. Scale bar is 500 µm. F. Axon regeneration quantified at 100 µm intervals as the fraction of regenerating axons relative to the crush site. G. Mean regeneration distance calculated by integrating SCG10 immunofluorescent staining of regenerating axons. H. Macrophages quantified by percent CD68 positive area in a circle placed on the CL with a diameter equal to the largest width of the uninjured portion of the nerve. Forty-micron sections were used in B-H. I-J. Representative images of a PBS (vehicle) liposome-treated (I) and clodronate liposome-treated (J) Ccr2gfp KO CL site immunostained for macrophages with F4/80, proregenerative macrophages with Arg1, recruited CCR2+ macrophages with GFP, and DAPI. F4/80 is a membrane marker, shown in green, while Arg1, shown in red, and GFP, shown in cyan, are both intracellular. These colors cause proregenerative F4/80+, Arg1+ macrophages to appear yellow or red ringed by yellow, recruited proregenerative GFP+, Arg1+ monocyte/macrophages to appear cyan and white, and triple positive cells to appear white surrounded by yellow-green. I’-J’’’’. Individual channel images from I and J. Percent area stained was quantified by outlining the tissue of the entire CL site. K. GFP staining was significantly reduced within the CL site of clodronate liposome treated Ccr2gfp KO mice compared to vehicle treated mice. L. F4/80 macrophage staining was also significantly reduced in clodronate liposome versus PBS liposome treated mice. M. Despite the significant reduction in macrophages in the CL site of clodronate liposome treated mice, DAPI staining was not altered in the CL site. Scale bar is 500 μm. N = 18–20 per group for B-H and N = 5 per group for I-M. ** p < 0.01; *** p < 0.001. # p < 0.05 between injury conditions within the same treatment group

Similar articles

Cited by

References

    1. Scheib J, Hoke A. Advances in peripheral nerve regeneration. Nat Rev Neurol. 2013;9:668–76. doi: 10.1038/nrneurol.2013.227. - DOI - PubMed
    1. McQuarrie IG, Grafstein B, Gershon MD. Axonal regeneration in the rat sciatic nerve: effect of a conditioning lesion and of dbcAMP. Brain Res. 1977;132:443–53. doi: 10.1016/0006-8993(77)90193-7. - DOI - PubMed
    1. McQuarrie IG, Grafstein B. Axon outgrowth enhanced by a previous nerve injury. Arch Neurol. 1973;29:53–5. doi: 10.1001/archneur.1973.00490250071008. - DOI - PubMed
    1. Neumann S, Woolf CJ. Regeneration of dorsal column fibers into and beyond the lesion site following adult spinal cord injury. Neuron. 1999;23:83–91. doi: 10.1016/S0896-6273(00)80755-2. - DOI - PubMed
    1. Richardson PM, Issa VM. Peripheral injury enhances central regeneration of primary sensory neurones. Nature. 1984;309:791–3. doi: 10.1038/309791a0. - DOI - PubMed

MeSH terms