[Preprint]. 2024 May 14:2024.05.10.592432.
doi: 10.1101/2024.05.10.592432.

Control of Inflammatory Response by Tissue Microenvironment

Affiliations

Control of Inflammatory Response by Tissue Microenvironment

Zhongyang Wu et al. bioRxiv. .

Abstract

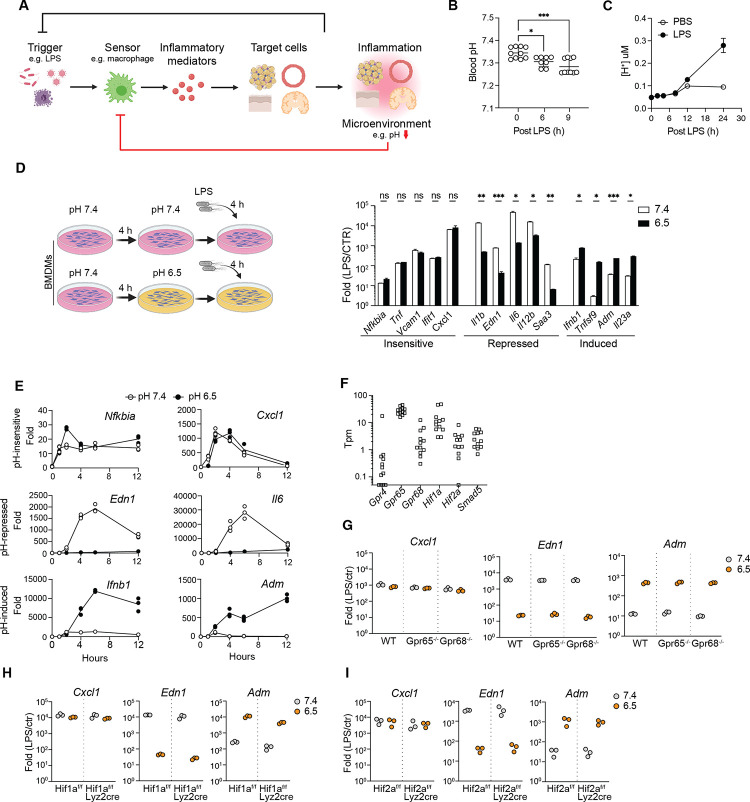
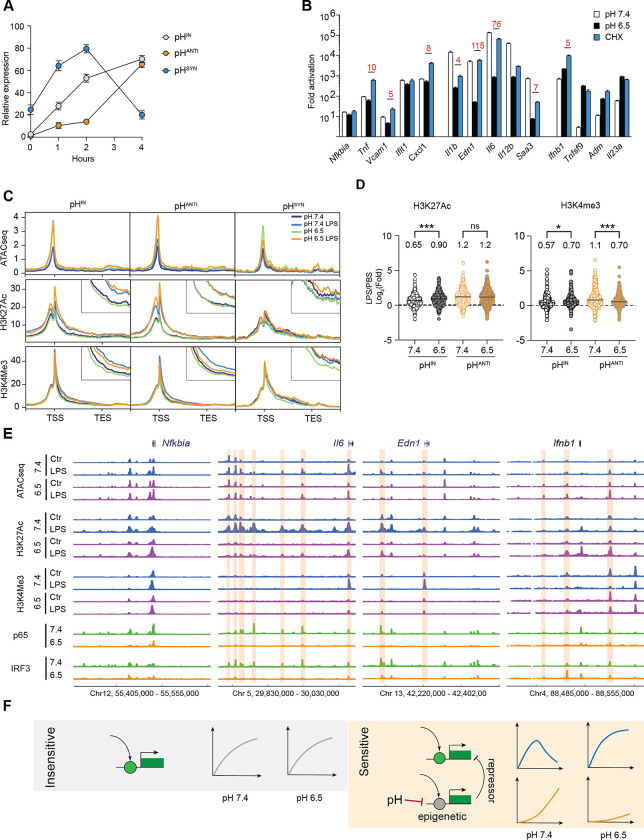
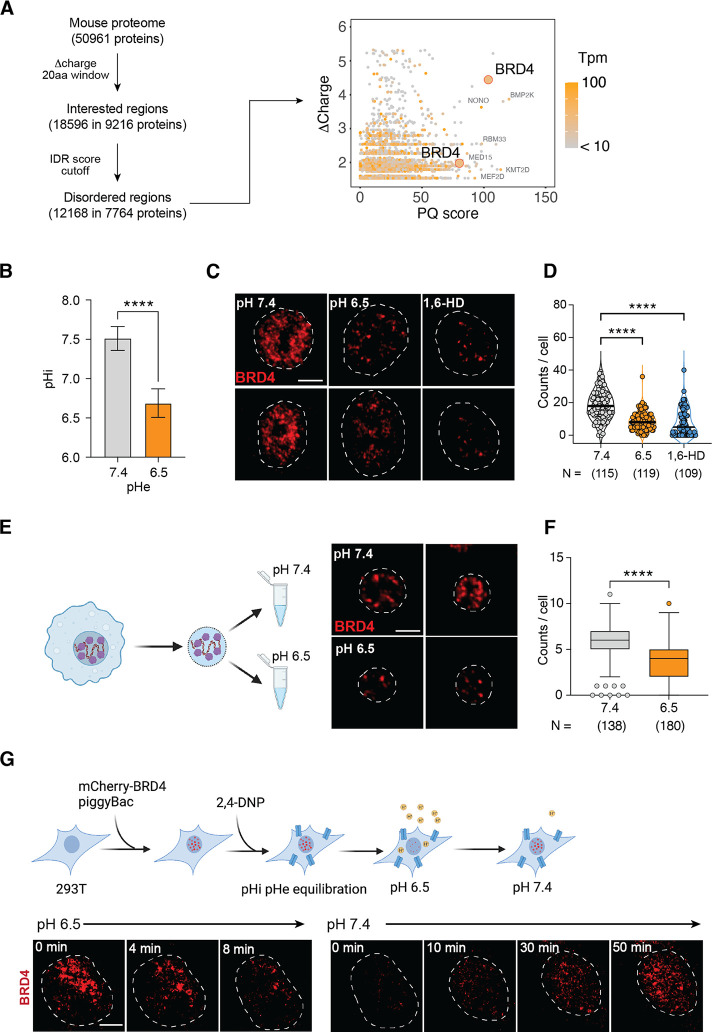
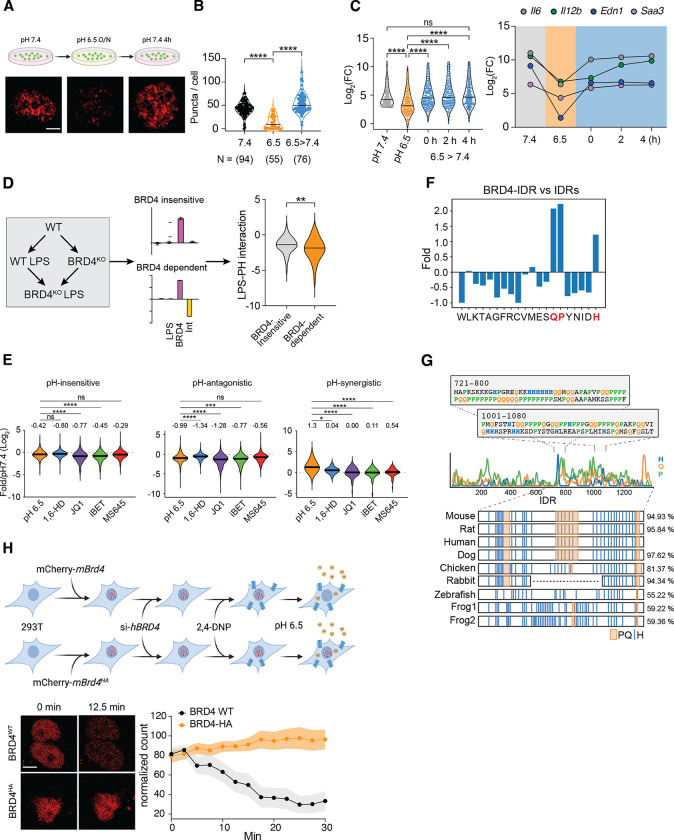
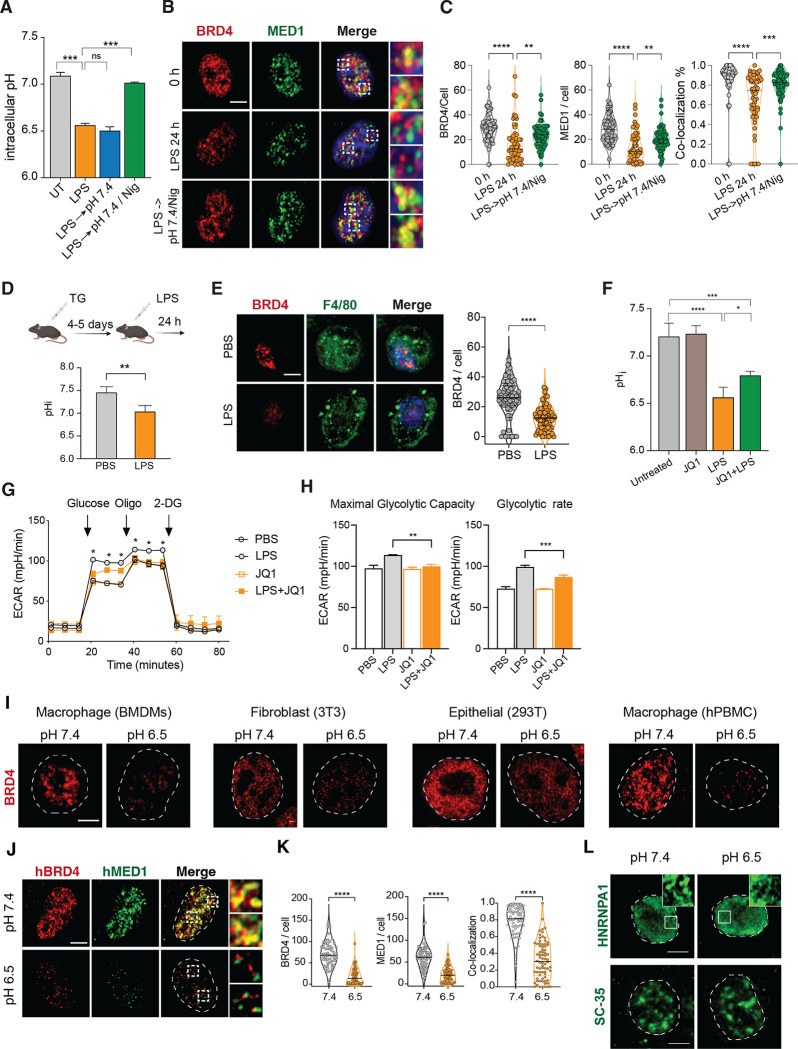
Inflammation is an essential defense response but operates at the cost of normal functions. Whether and how the negative impact of inflammation is monitored remains largely unknown. Acidification of the tissue microenvironment is associated with inflammation. Here we investigated whether macrophages sense tissue acidification to adjust inflammatory responses. We found that acidic pH restructured the inflammatory response of macrophages in a gene-specific manner. We identified mammalian BRD4 as a novel intracellular pH sensor. Acidic pH disrupts the transcription condensates containing BRD4 and MED1, via histidine-enriched intrinsically disordered regions. Crucially, decrease in macrophage intracellular pH is necessary and sufficient to regulate transcriptional condensates in vitro and in vivo, acting as negative feedback to regulate the inflammatory response. Collectively, these findings uncovered a pH-dependent switch in transcriptional condensates that enables environmental sensing to directly control inflammation, with a broader implication for calibrating the magnitude and quality of inflammation by the inflammatory cost.


Conflict of interest statement

Declaration of interests J.C.K. consults and holds equity in Corner Therapeutics and Larkspur Biosciences. None of these relationships impacted this study. The authors declare no competing interests.

Figures

Figure 1.
Figure 1.. Acidic pH regulates gene-specific inflammatory response in macrophages.
(A) A diagram of an inflammatory circuit with pH-sensing feedback to the innate sensors. (B) Blood pH in mice challenged with 10 mg/kg LPS intraperitoneally. One-way ANOVA, Dunnett test for multiple comparisons, Mean +/− STD. (C) Extracellular acidification of BMDMs stimulated with 100 ng/mL LPS in vitro. Mean+/− STD. (D) Fold activation of inflammatory genes in BMDMs after 4 hours 10 ng/mL LPS at pH 7.4 or 6.5, normalized to unstimulated conditions respectively. Mean+/− standard deviation (STD). Unpaired t-test, Holm-Sidak’s test for multiple comparisons. (E) Time course analysis of gene activation in BMDMs stimulated with 10 ng/mL LPS at pH 7.4 and 6.5. (F) Expression of known pH sensors in macrophages, including BMDMs, monocytes, tissue resident macrophages in peritoneal, liver, lung, small and large intestines (ref: Lavin 2014). (G-I) Fold changes of selected genes in WT, Gpr65−/− and Gpr68−/− BMDMs (G), Hif1a−/− BMDMs (H) and Hif2a−/− BMDMs (I). In (B) and (D), *p<0.05, **p<0.01, ***p<0.001.
Figure 2.
Figure 2.. Deconvolution analysis revealed pH-dependent combinatorial control of inflammatory response.
(A) Van diagrams of significantly regulated genes by LPS or acidic pH. Fc > 3 and q < 0.05. (B) Illustration of the linear deconvolution model to identify gene regulatory logics between LPS and acidic pH. (C) Evaluation of linear model fitting using expression variance and R-square for each gene. Blue marks all genes and magenta marks differentially expressed genes (FC > 3, q<0.05) in any pair of conditions. (D) Heatmap of inflammatory genes regulated by either LPS stimulation or acidic pH. Left, log2(fold) of model-inferred regulation by acidic pH alone (pH), LPS stimulation alone (LPS) and the interactions between acidic pH and LPS stimulation (LPSPH). Right, heatmap of p-values of each expression component, determined with a null hypothesis that the regulatory effect is less than 1.5-folds. Cluster groups (1–20) were determined based on expression component p-values. (E) Functional enrichment for LPS-induced or LPS-repressed genes that are pH-insensitive, pH-antagonistic or pH-synergistic. (F) Expression components of inflammatory cytokines, cytokine receptors, antigen presentation genes, integrins and regulators of NF-κB signaling. (G) Motif enrichment of LPS-induced genes that are pH-insensitive and pH-antagonistic. (H) Western blot of NF-κB, IRF3 and STAT1 signaling activation in BMDMs after LPS stimulation. (I) Immunofluorescence staining of p65 (pink) and IRF3 (pink) in BMDMs after LPS stimulation, 1 hour for p65 and 2 hours for IRF3.
Figure 3.
Figure 3.. Transcription circuit and epigenetic control underlies environment-sensitive inflammatory response.
(A) Expression kinetics of LPS-induced genes for top pH-insensitive (100), pH-antagonistic (100) and pH-synergistic groups (58). (B) Activation of inflammatory genes by LPS with 10 ng/mL for 4 hours, at pH 7.4, 6.5 or with 200 ng/mL cycloheximide (CHX). Fold change is calculated as LPS/untreated in each treatment condition. (C) Average profile of ATAC-seq and ChIP-seq of H3K27Ac and H3K4me3 of pH-regulated genes. Intersection image shows an enlarged profile around TSS. (D) Fold change of H3K27Ac and H3K4me3 ChIP-seq counts within 1kb around TSS for pH-insensitive and pH-antagonistic groups. Welch t-test and Holm-Sidak’s multiple comparisons test, ns p>0.05, * p<0.05, ***p<0.001. (E) Profile of ATAC-seq, H3K27 acetylation, H3K4 tri-methylation, p65 and IRF3 ChIP-seq at selected LPS induced genes. Orange boxes highlight regions with strong differences between pH 7.4 and pH 6.5. (F) model illustration of the activation of pH-sensitive and pH-insensitive inflammatory response.
Figure 4.
Figure 4.. Acidic pH regulates BRD4 transcriptional condensates.
(A) Diagram and results of the bioinformatic analysis of pH-sensitive peptide sequences in the mouse proteome. The 2D-plot shows side chain Δcharge and enrichment of proline and glutamine residues. Orange color indicates gene expression in BMDMs. (B) pHi measurement in BMDMs using pH-sensitive fluorescent probe SNARF-4F. **** p<0.0001, unpaired Student t test. (C-D) Immunofluorescent imaging (C) and quantification (D) of BRD4 in BMDMs cultured at pH 7.4, 6.5 for 4 hours, or treated with 10% 1,6-Hexanediol for 2 min. **** p<0.0001, One way ANOVA test. (E-F) Immunofluorescent imaging (E) and quantification (F) of BRD4 in isolated BMDM nuclei, conditioned in pH 7.4 and pH 6.5 buffer. **** p<0.0001, unpaired Student’s t test. (G) Time lapse imaging of BRD4 in live BMDMs in response to pH 6.5. N represents the number of cells analyzed for each condition in (E, G). Scale bar represents 2 μm.
Figure 5.
Figure 5.. BRD4 is a pH sensor and regulates pH-dependent inflammatory response.
(A-B) Immunofluorescent imaging (A) and quantification (B) of BRD4 in BMDMs. Brown-Forsythe and Welch ANOVA tests. (C) Violin plots of fold activation for pH-sensitive genes after restoring media pH from 6.5 to 7.4. The top 200 pH-repressed genes. Median of fold activation is labeled on violin plots. Kruskal-Wallis test with multiple comparisons. Only significant pairs are labeled. (D) RNA-seq deconvolution analysis of BRD4 KO BMDMs stimulated with 10 ng/mL LPS for 4 hours. LPS-induced BRD4-dependent and independent genes were analyzed for their pH-dependence. Unpaired Student’s t test. (E) Fold difference of pH-insensitive, -antagonistic or synergistic genes, at pH 6.5, with 1% 1,6-hexanediol or various BRD4 inhibitors. (F) Amino acid composition in the BRD4-IDR relative to that of all annotated IDRs in the mouse proteome. (G) Conservation of HPQ regions along the coding sequence of BRD4. Panels display amino acid sequences of the two HPQ regions within BRD4-IDR identified through bioinformatic screening. The distribution of H, P, Q residues, along with HPQ patterns in BRD4-IDR across different vertebrates are illustrated with sequence conservation. (G) Live-cell imaging of mCherry-BRD4WT or mCherry-BRD4HA 293T cells in response to pH 6.5. N represents the number of cells analyzed for each condition (B, C, D, E). ns, p>0.05, *p<0.05, **p<0.01, ***p<0.001, **** p<0.0001.
Figure 6.
Figure 6.. Gene-specific regulation is mediated by BRD4-MED1 transcription condensates and BRD9.
(A-B) BRD4 and MED1 in BMDMs at pH 7.4, at 6.5, in the presence of 10 % 1,6-HD, JQ-1, iBET and MS645. (A) Immunofluorescent imaging (B) Quantification of puncta and co-localization. One way ANOVA. (C) Fold change of LPS induced gene expression in the presence of BRD9 specific inhibitor (iBRD9) of degrader (dBRD9). (D) Western blot analysis of Co-IP between BRD4-IDR and BRD9. FLAG-mCherry was fused with BRD4-IDR for IP with total cell lysate, with FLAG-mCherry as control (Ctrl). (E) ChIP-seq of BRD4 and BRD9 in BMDMs at pH-regulated genes. Orange boxes highlight regions with significant differences in BRD4 or BRD9 binding. (F) Fold change of pH-dependent inflammatory genes in iBMDMs overexpressing BRD4-IDR after 6 hours 100 ng/mL LPS at pH 7.4 or 6.5, normalized to unstimulated conditions respectively. Mean+/− standard deviation (STD). Unpaired t-test, Holm-Sidak’s test for multiple comparisons. (G) Model diagram of pH-dependent regulation of BRD4 condensates. In (B), (D), (F) ns p>0.05, *** p<0.001, **** p<0.0001.
Figure 7.
Figure 7.. pHi sensing via BRD4 acts as negative feedback to modulate pH homeostasis and inflammatory response.
(A) pHi in BMDMs after LPS stimulation in various indicated conditions, pairwise comparison with Kruskal-Wallis. (B-C) Immunofluorescent imaging (B) and quantification (C) of BRD4, MED1 and co-localization. one way ANOVA (F). (D-E) pHi and BRD4 measurement of thioglycollate-induced peritoneal macrophages in vivo, 24 h after i.p. injection with PBS or 3 mg/kg LPS. pH quantification, unpaired Student’s t test (D), Immunofluorescent imaging and quantification of F4/80+ macrophages, Mann-Whtiney test (E). (F) pHi of BMDMs treated with 100 ng/mL LPS for 24 h and/or 0.5 μM JQ1 for 8 h, one way ANOVA. (G) Seahorse analysis of glycolytic activity in BMDMs treated with 100 ng/mL LPS and/or 0.5 μM JQ1 for 8 h, one way ANOVA. (H) Glycolytic capacity and rate of BMDMs treated with 100 ng/mL LPS +/− 0.5 μM JQ1 for 8 h, one way ANOVA. (I, L) Immunofluorescent imaging of BRD4 (I), HNRNPA1 or SRSF2 (L) phase condensates in murine and human cells. (J, K) BRD4 and MED1 puncta in human macrophages at pH 7.4 and pH 6.5. (J) Immunofluorescent imaging, (K) Quantification of puncta and co-localization. Mann-Whtiney test. p>0.05, *p<0.05, **p<0.01, ***p<0.001, **** p<0.0001.

Similar articles

References

    1. Meizlish M.L., Franklin R.A., Zhou X., and Medzhitov R. (2021). Tissue Homeostasis and Inflammation. Annu Rev Immunol 39, 1–25. 10.1146/annurev-immunol-061020-053734. - DOI - PubMed
    1. Medzhitov R. (2021). The spectrum of inflammatory responses. Science 374, 1070–1075. 10.1126/science.abi5200. - DOI - PubMed
    1. Hajjar S., and Zhou X. (2023). pH sensing at the intersection of tissue homeostasis and inflammation. Trends Immunol. 44, 807–825. 10.1016/j.it.2023.08.008. - DOI - PMC - PubMed
    1. Levin L.R., and Buck J. (2014). Physiological Roles of Acid-Base Sensors. Annu Rev Physiol 77, 347––362. 10.1146/annurev-physiol-021014-071821. - DOI - PubMed
    1. Nichol A., Bailey M., Egi M., Pettila V., French C., Stachowski E., Reade M.C., Cooper D.J., and Bellomo R. (2011). Dynamic lactate indices as predictors of outcome in critically ill patients. Crit. Care 15, R242. 10.1186/cc10497. - DOI - PMC - PubMed

Publication types