. 2024 May 17;25(10):5475.
doi: 10.3390/ijms25105475.

Molecular Characterization and Inhibition of a Novel Stress-Induced Mitochondrial Protecting Role for Misfolded TrkAIII in Human SH-SY5Y Neuroblastoma Cells

Affiliations

Molecular Characterization and Inhibition of a Novel Stress-Induced Mitochondrial Protecting Role for Misfolded TrkAIII in Human SH-SY5Y Neuroblastoma Cells

Lucia Cappabianca et al. Int J Mol Sci. .

Abstract

Pediatric neuroblastomas (NBs) are heterogeneous, aggressive, therapy-resistant embryonal tumors that originate from cells of neural crest origin committed to the sympathoadrenal progenitor cell lineage. Stress- and drug-resistance mechanisms drive post-therapeutic relapse and metastatic progression, the characterization and inhibition of which are major goals in improving therapeutic responses. Stress- and drug-resistance mechanisms in NBs include alternative TrkAIII splicing of the neurotrophin receptor tropomyosin-related kinase A (NTRK1/TrkA), which correlates with post-therapeutic relapse and advanced-stage metastatic disease. The TrkAIII receptor variant exerts oncogenic activity in NB models by mechanisms that include stress-induced mitochondrial importation and activation. In this study, we characterize novel targetable and non-targetable participants in this pro-survival mechanism in TrkAIII-expressing SH-SY5Y NB cells, using dithiothreitol (DTT) as an activator and a variety of inhibitors by regular and immunoprecipitation Western blotting of purified mitochondria and IncuCyte cytotoxicity assays. We report that stress-induced TrkAIII misfolding initiates this mechanism, resulting in Grp78, Ca2+-calmodulin, adenosine ribosylating factor (Arf) and Hsp90-regulated mitochondrial importation. TrkAIII imported into inner mitochondrial membranes is cleaved by Omi/high temperature requirement protein A2 (HtrA2) then activated by a mechanism dependent upon calmodulin kinase II (CaMKII), alpha serine/threonine kinase (Akt), mitochondrial Ca2+ uniporter and reactive oxygen species (ROS), involving inhibitory mitochondrial protein tyrosine phosphatase (PTPase) oxidation, resulting in phosphoinositide 3 kinase (PI3K) activation of mitochondrial Akt, which enhances stress resistance. This novel pro-survival function for misfolded TrkAIII mitigates the cytotoxicity of mitochondrial Ca2+ homeostasis disrupted during integrated stress responses, and is prevented by clinically approved Trk and Akt inhibitors and also by inhibitors of 78kDa glucose regulated protein (Grp78), heat shock protein 90 (Hsp90), Ca2+-calmodulin and PI3K. This identifies Grp78, Ca2+-calmodulin, Hsp90, PI3K and Akt as novel targetable participants in this mechanism, in addition to TrkAIII, the inhibition of which has the potential to enhance the stress-induced elimination of TrkAIII-expressing NB cells, with the potential to improve therapeutic outcomes in NBs that exhibit TrkAIII expression and activation.

Keywords: Akt; Ca2+-calmodulin; Grp78; PI3K; ROS; TrkAIII; adenosine ribosylating factor; integrated stress response; mitochondria; mitochondrial Ca2+ uniporter; stress resistance.


Conflict of interest statement

The authors declare no conflicts of interest.

Figures

Figure 1
Figure 1
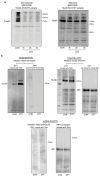
(a) Indirect IFs demonstrating increased overlapping (yellow/orange) immunoreactivity for TrkA (green) and MitoTracker-labeled mitochondria (red) (upper panels) and Y490 phosphorylated TrkAIII (pTrkAIII, green) and MitoTracker-labeled mitochondria (red) (lower panels) in DTT-treated (5 mM for 6 h) TrkAIII SH-SY5Y cells compared to untreated controls (control). DAPI stained nuclei are blue. (bar = 50 μm). (b) Western blots demonstrating TrkAIII cleavage and Y674/5 phosphorylation in mitochondria (50 mg) from DTT-treated (5 mM for 6 h) TrkAIII SH-SY5Y cells compared to untreated TrkAIII SH-SY5Y controls. (c) Western blots demonstrating increased PTPase oxidation (arrows) in mitochondria (50 mg) from DTT-treated TrkAIII SH-SY5Y cells (5 mM for 6 h) compared to untreated controls (Con). (d) Phase contrast images merged with green fluorescence and histogram demonstrating significant differences (* p < 0.0001) in pcDNA-SH-SY5Y and TrkAIII SH-SY5Y percentage cell death at 24 h and 48 h, induced by 5 mM DTT.
Figure 2
Figure 2
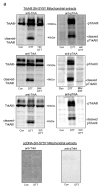
(a) Western blots demonstrating differences in TrkAIII immunoreactivity in untreated (CON) and DTT-treated (5 mM DTT for 1, 2 and 3 h) TrkAIII SH-SY5Y cell extracts (30 mg) under non-reducing and reducing conditions. (b) Co-immunoprecipitation Western blots demonstrating increased TrkAIII pulldown of Grp78 by anti-TrkA antibody in DTT-treated (5 mM for 6 h) TrkAIII SH-SY5Y cell extracts compared to untreated control extracts (CON) and similar levels of TrkAIII immunoprecipitated by anti-TrkA antibody but not by pre-immune mouse IgG in untreated (Con) and DTT-treated (5 mM for 6 h) TrkAIII SH-SY5Y cell extracts (500 μg), plus the absence of GRP78 or TrkA isoform pulldown by anti-TrkA antibody in pcDNA-SH-SY5Y cell extracts (500 μg). (c) Western blots of TrkAIII pulldown by calmodulin-conjugated Sepharose (CaM-Seph) in TrkAIII SH-SY5Y but not pcDNA-SH-SY5Y cell extracts (500 μg) in the presence of 150 mM CaCl2 (left panel) plus increased TrkAIII pulldown by calmodulin-conjugated Sepharose (CaM-Seph) in TrkAIII SH-SY5Y cell extracts (500 μg) in the presence of 150 μM CaCl2 compared to 5 mM EGTA (right panel), plus no TrkAIII pulldown by unconjugated Sepharose in TrkAIII SH-SY5Y cell extracts in the presence of 150 μM CaCl2 or 5 mM EGTA (right panel). (d) Co-immunoprecipitation Western blots demonstrating enhanced pulldown of TrkAIII by anti-calmodulin antibody (anti-CaM) but not by pre-immune mouse IgG in DTT-treated (5 mM for 3 and 6 h) but not untreated (Con) TrkAIII SH-SY5Y extracts (500 μg) (upper left panels) and calmodulin pulldown by anti-calmodulin antibody (anti-CaM) but not pre-immune IgG in untreated (Con) and DTT-treated (DTT) TrkAIII SH-SY5Y cell extracts (500 μg) (upper right panels), plus no pulldown of TrkAIII by anti-calmodulin antibody in pcDNA-SH-SY5Y extracts (500 μg).
Figure 2
Figure 2
(a) Western blots demonstrating differences in TrkAIII immunoreactivity in untreated (CON) and DTT-treated (5 mM DTT for 1, 2 and 3 h) TrkAIII SH-SY5Y cell extracts (30 mg) under non-reducing and reducing conditions. (b) Co-immunoprecipitation Western blots demonstrating increased TrkAIII pulldown of Grp78 by anti-TrkA antibody in DTT-treated (5 mM for 6 h) TrkAIII SH-SY5Y cell extracts compared to untreated control extracts (CON) and similar levels of TrkAIII immunoprecipitated by anti-TrkA antibody but not by pre-immune mouse IgG in untreated (Con) and DTT-treated (5 mM for 6 h) TrkAIII SH-SY5Y cell extracts (500 μg), plus the absence of GRP78 or TrkA isoform pulldown by anti-TrkA antibody in pcDNA-SH-SY5Y cell extracts (500 μg). (c) Western blots of TrkAIII pulldown by calmodulin-conjugated Sepharose (CaM-Seph) in TrkAIII SH-SY5Y but not pcDNA-SH-SY5Y cell extracts (500 μg) in the presence of 150 mM CaCl2 (left panel) plus increased TrkAIII pulldown by calmodulin-conjugated Sepharose (CaM-Seph) in TrkAIII SH-SY5Y cell extracts (500 μg) in the presence of 150 μM CaCl2 compared to 5 mM EGTA (right panel), plus no TrkAIII pulldown by unconjugated Sepharose in TrkAIII SH-SY5Y cell extracts in the presence of 150 μM CaCl2 or 5 mM EGTA (right panel). (d) Co-immunoprecipitation Western blots demonstrating enhanced pulldown of TrkAIII by anti-calmodulin antibody (anti-CaM) but not by pre-immune mouse IgG in DTT-treated (5 mM for 3 and 6 h) but not untreated (Con) TrkAIII SH-SY5Y extracts (500 μg) (upper left panels) and calmodulin pulldown by anti-calmodulin antibody (anti-CaM) but not pre-immune IgG in untreated (Con) and DTT-treated (DTT) TrkAIII SH-SY5Y cell extracts (500 μg) (upper right panels), plus no pulldown of TrkAIII by anti-calmodulin antibody in pcDNA-SH-SY5Y extracts (500 μg).
Figure 3
Figure 3
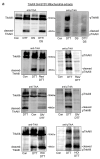
(a) Western blots demonstrating TrkAIII cleavage and phosphorylation in mitochondria (50 μg) from TrkAIII SH-SY5Y cells treated with 5 mM DTT alone for 6 h and in mitochondria from TrkAIII SH-SY5Y cells co-treated with 5 mM DTT and either HA-15 (20 μM) (DTT/HA); brefeldin A (5 mg/mL) (DTT/BfA) or W7 (60 μM) (DTT/W7) plus non-phosphorylated TrkAIII in mitochondria from untreated TrkAIII SH-SY5Y cells (Con) and lack of TrkA or phosphorylated TrkA immunoreactivity in mitochondria (50 μg) from untreated (Con) and DTT-treated (5 mm for 6 h) pcDNA-SH-SY5Y cells. (b) Line graphs demonstrating significant inhibition (*) of pcDNA-SH-SY5Y and TrkAIII SH-SY5Y proliferation by BfA (5 μg/mL) and W7 (60 μM) but not by HA-15 (20 μM) at 24 and 48 h (* p < 0.0001). (c) Phase contrast images merged with green fluorescence plus histograms demonstrating percentage pcDNA-SH-SY5Y and TrkAIII SH-SY5Y cell death induced by 5 mM DTT alone (DTT), DTT and either HA-15 (20 μM) (DTT/HA), BfA (5 μg/mL) (DTT/BfA) or W7 (60 μM) (DTT/W7), plus pcDNA-SH-SY5Y and TrkAIII SH-SY5Y cell death induced by W7 (60 μM) alone (W7) at 24 and 48 h (* p < 0.006).
Figure 3
Figure 3
(a) Western blots demonstrating TrkAIII cleavage and phosphorylation in mitochondria (50 μg) from TrkAIII SH-SY5Y cells treated with 5 mM DTT alone for 6 h and in mitochondria from TrkAIII SH-SY5Y cells co-treated with 5 mM DTT and either HA-15 (20 μM) (DTT/HA); brefeldin A (5 mg/mL) (DTT/BfA) or W7 (60 μM) (DTT/W7) plus non-phosphorylated TrkAIII in mitochondria from untreated TrkAIII SH-SY5Y cells (Con) and lack of TrkA or phosphorylated TrkA immunoreactivity in mitochondria (50 μg) from untreated (Con) and DTT-treated (5 mm for 6 h) pcDNA-SH-SY5Y cells. (b) Line graphs demonstrating significant inhibition (*) of pcDNA-SH-SY5Y and TrkAIII SH-SY5Y proliferation by BfA (5 μg/mL) and W7 (60 μM) but not by HA-15 (20 μM) at 24 and 48 h (* p < 0.0001). (c) Phase contrast images merged with green fluorescence plus histograms demonstrating percentage pcDNA-SH-SY5Y and TrkAIII SH-SY5Y cell death induced by 5 mM DTT alone (DTT), DTT and either HA-15 (20 μM) (DTT/HA), BfA (5 μg/mL) (DTT/BfA) or W7 (60 μM) (DTT/W7), plus pcDNA-SH-SY5Y and TrkAIII SH-SY5Y cell death induced by W7 (60 μM) alone (W7) at 24 and 48 h (* p < 0.006).
Figure 4
Figure 4
(a) Western blots of TrkAIII cleavage and phosphorylation in mitochondria (50 mg) from TrkAIII SH-SY5Y treated with 5 mM DTT for 6 h (DTT); co-treated with 5 mM DTT and either DS16570511 (40 μM) (DTT DS), resveratrol (100 μM) (DTT Res), geldanamycin (100 μM) (GA DTT) or Honokiol-DCA (10 μM) (DTT HON), plus un-cleaved, non-phosphorylated TrkAIII in mitochondria from untreated TrkAIII SH-SY5Y cells (Con). (b) Line graphs demonstrating the effects of DS16570511 (DS) (40 μM), resveratrol (Res) (100 μM), geldanamycin (GA) (100 μM) and Honokiol-DCA (HO) (10 μM) on pcDNA-SH-SY5Y and TrkAIII SH-SY5Y proliferation over 48 h (* p < 0.001). (c) Representative phase contrast images merged with green fluorescence and histograms comparing pcDNA-SH-SY5Y and TrkAIII SH-SY5Y cell death induced by 5 mM DTT to cell death induced by co-treatment with 5 mM DTT and either DS16570511 (40 μM) (DTT DS), resveratrol (100 μM) (DTT Res), geldanamycin (100 μM) (DTT GA) or Honokiol-DCA (10 μM) (DTT HO) (* p < 0.01).
Figure 4
Figure 4
(a) Western blots of TrkAIII cleavage and phosphorylation in mitochondria (50 mg) from TrkAIII SH-SY5Y treated with 5 mM DTT for 6 h (DTT); co-treated with 5 mM DTT and either DS16570511 (40 μM) (DTT DS), resveratrol (100 μM) (DTT Res), geldanamycin (100 μM) (GA DTT) or Honokiol-DCA (10 μM) (DTT HON), plus un-cleaved, non-phosphorylated TrkAIII in mitochondria from untreated TrkAIII SH-SY5Y cells (Con). (b) Line graphs demonstrating the effects of DS16570511 (DS) (40 μM), resveratrol (Res) (100 μM), geldanamycin (GA) (100 μM) and Honokiol-DCA (HO) (10 μM) on pcDNA-SH-SY5Y and TrkAIII SH-SY5Y proliferation over 48 h (* p < 0.001). (c) Representative phase contrast images merged with green fluorescence and histograms comparing pcDNA-SH-SY5Y and TrkAIII SH-SY5Y cell death induced by 5 mM DTT to cell death induced by co-treatment with 5 mM DTT and either DS16570511 (40 μM) (DTT DS), resveratrol (100 μM) (DTT Res), geldanamycin (100 μM) (DTT GA) or Honokiol-DCA (10 μM) (DTT HO) (* p < 0.01).
Figure 5
Figure 5
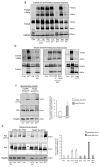
(a) Western blots of TrkAIII cleavage and phosphorylation in mitochondria (50 μg) from TrkAIII SH-SY5Y cells treated for 3 and 6 h with 5 mM DTT and from TrkAIII SH-SY5Y cells co-treated for 6 h with 5 mM DTT and either PD098059 (10 μM) (DTT/PD), LY294002 (25 μM) (DTT/LY), Entrectinib (1 μM) (DTT/Ent) or Lestaurtinib (1 μM) (DTT/Les). (b) Western blots of TrkAIII cleavage and phosphorylation in mitochondria (50 μg) from TrkAIII SH-SY5Y cells treated for 6 h with 5 mM DTT and from TrkAIII SH-SY5Y cells co-treated for 6 h with 5 mM DTT plus either KN-93 (10 μM) (DTT/KN), STO-609 (5 μM and 10 μM) (STO/DTT) or Capivasertib (20 μM) (DTT/Cap) plus un-cleaved non-phosphorylated TrkAIII in mitochondria from untreated TrkAIII SH-SY5Y cells (Con). (c) Western blots demonstrating Ser473 phosphorylated and total Akt in mitochondria (50 μg) from pcDNA-SH-SY5Y and TrkAIII SH-SY5Y cells treated for 6 h with 5 mM DTT compared to untreated controls (Con) and histogram comparing mean (±s.d.) fold increase in mitochondrial Akt S473 phosphorylation compared to untreated controls (* p < 0.0221); (d) Western blots demonstrating Ser473 phosphorylated and total Akt in mitochondria (50 μg) from pcDNA-SH-SY5Y and TrkAIII SH-SY5Y cells treated for 6 h with either 5 mM DTT alone (DTT), 1 μM Entrectinib alone (Ent) or co-treated for 6 h with 5 mM DTT plus Entrectinib (1 μM) (DTT Ent) compared to levels in mitochondria from untreated pcDNA-SH-SY5Y and TrkAIII SH-SY5Y controls (Con), and accompanying histogram and histogram comparing mean (±s.d.) fold increase in mitochondrial Akt S473 phosphorylation compared to untreated controls demonstrating significant inhibition of DTT-induced mitochondrial Akt S473 phosphorylation in TrkAIII SH-SY5Y but not pcDNA-SH-SY5Y cells co-treated with DTT and 1 μM Entrectinib inhibition (* p <0.0009 compared to Akt S473 phosphorylation levels in TrkAIII SH-SY5Y cells treated with DTT alone). (e) Western blots of Ser473 phosphorylated and non-phosphorylated Akt levels in mitochondria (50 μg) from pcDNA-SH-SY5Y and TrkAIII SH-SY5Y cells treated for 6 h with 5mM DTT alone (DTT) or counterparts co-treated for 6 h with 5 mM DTT and either PD098059 (10 μM) (DTT/PD), KN-93 (10 μM) (DTT/KN), LY294002 (25 μM) (DTT/LY) or STO-609 (5 μM and/or 10 μM) (DTT/STO), plus a histogram demonstrating significant inhibition of DTT-induced mean (±s.d.) fold increase in Akt S473 phosphorylation induced in pcDNA-SH-SY5Y cells, in cells co-treated with DTT-and KN-93 (* p = 0.03 compared to DTT alone) but not with LY294002, and significant reductions in DTT-induced mitochondrial Akt S473 phosphorylation in TrkAIII SH-SY5Y cells co-treated with DTT and either KN-93 (* p = 0.011) or LY294002 (* p = 0.013). The bottom panel demonstrates the increase in DTT-induced mitochondrial Akt S473 phosphorylation caused by Capivasertib (20 μM) in TrkAIII SH-SY5Y cells (DTT/Cap). (f) Line graphs demonstrating the effects of PD098059 (10 μM), LY294002 (25 μM) (LY), Entrectinib (1 μM), Lestaurtinib (1 μM) (Les) and Capivasertib (20 μM) (Cap) on pcDNA-SH-SY5Y and TrkAIII SH-SY5Y proliferation over 48 h (* p < 0.0001). (g) Representative phase contrast images merged with green fluorescence and histograms of mean (±s.d.) percentage of pcDNA-SH-SY5Y and TrkAIII SH-SY5Y cell death at 24 and 48 h, induced by 5 mM DTT alone (DTT) or by DTT co-treatment with either LY294002 (25 μM) (DTT/LY), PD098059 (10 μM) (DTT/PD), Entrectinib (1 μM) (DTT/Ent), Lestaurtinib (1 μM) (DTT/Les) or Capivasertib (20 μM) (DTT/Cap) (* p < 0.0001).
Figure 5
Figure 5
(a) Western blots of TrkAIII cleavage and phosphorylation in mitochondria (50 μg) from TrkAIII SH-SY5Y cells treated for 3 and 6 h with 5 mM DTT and from TrkAIII SH-SY5Y cells co-treated for 6 h with 5 mM DTT and either PD098059 (10 μM) (DTT/PD), LY294002 (25 μM) (DTT/LY), Entrectinib (1 μM) (DTT/Ent) or Lestaurtinib (1 μM) (DTT/Les). (b) Western blots of TrkAIII cleavage and phosphorylation in mitochondria (50 μg) from TrkAIII SH-SY5Y cells treated for 6 h with 5 mM DTT and from TrkAIII SH-SY5Y cells co-treated for 6 h with 5 mM DTT plus either KN-93 (10 μM) (DTT/KN), STO-609 (5 μM and 10 μM) (STO/DTT) or Capivasertib (20 μM) (DTT/Cap) plus un-cleaved non-phosphorylated TrkAIII in mitochondria from untreated TrkAIII SH-SY5Y cells (Con). (c) Western blots demonstrating Ser473 phosphorylated and total Akt in mitochondria (50 μg) from pcDNA-SH-SY5Y and TrkAIII SH-SY5Y cells treated for 6 h with 5 mM DTT compared to untreated controls (Con) and histogram comparing mean (±s.d.) fold increase in mitochondrial Akt S473 phosphorylation compared to untreated controls (* p < 0.0221); (d) Western blots demonstrating Ser473 phosphorylated and total Akt in mitochondria (50 μg) from pcDNA-SH-SY5Y and TrkAIII SH-SY5Y cells treated for 6 h with either 5 mM DTT alone (DTT), 1 μM Entrectinib alone (Ent) or co-treated for 6 h with 5 mM DTT plus Entrectinib (1 μM) (DTT Ent) compared to levels in mitochondria from untreated pcDNA-SH-SY5Y and TrkAIII SH-SY5Y controls (Con), and accompanying histogram and histogram comparing mean (±s.d.) fold increase in mitochondrial Akt S473 phosphorylation compared to untreated controls demonstrating significant inhibition of DTT-induced mitochondrial Akt S473 phosphorylation in TrkAIII SH-SY5Y but not pcDNA-SH-SY5Y cells co-treated with DTT and 1 μM Entrectinib inhibition (* p <0.0009 compared to Akt S473 phosphorylation levels in TrkAIII SH-SY5Y cells treated with DTT alone). (e) Western blots of Ser473 phosphorylated and non-phosphorylated Akt levels in mitochondria (50 μg) from pcDNA-SH-SY5Y and TrkAIII SH-SY5Y cells treated for 6 h with 5mM DTT alone (DTT) or counterparts co-treated for 6 h with 5 mM DTT and either PD098059 (10 μM) (DTT/PD), KN-93 (10 μM) (DTT/KN), LY294002 (25 μM) (DTT/LY) or STO-609 (5 μM and/or 10 μM) (DTT/STO), plus a histogram demonstrating significant inhibition of DTT-induced mean (±s.d.) fold increase in Akt S473 phosphorylation induced in pcDNA-SH-SY5Y cells, in cells co-treated with DTT-and KN-93 (* p = 0.03 compared to DTT alone) but not with LY294002, and significant reductions in DTT-induced mitochondrial Akt S473 phosphorylation in TrkAIII SH-SY5Y cells co-treated with DTT and either KN-93 (* p = 0.011) or LY294002 (* p = 0.013). The bottom panel demonstrates the increase in DTT-induced mitochondrial Akt S473 phosphorylation caused by Capivasertib (20 μM) in TrkAIII SH-SY5Y cells (DTT/Cap). (f) Line graphs demonstrating the effects of PD098059 (10 μM), LY294002 (25 μM) (LY), Entrectinib (1 μM), Lestaurtinib (1 μM) (Les) and Capivasertib (20 μM) (Cap) on pcDNA-SH-SY5Y and TrkAIII SH-SY5Y proliferation over 48 h (* p < 0.0001). (g) Representative phase contrast images merged with green fluorescence and histograms of mean (±s.d.) percentage of pcDNA-SH-SY5Y and TrkAIII SH-SY5Y cell death at 24 and 48 h, induced by 5 mM DTT alone (DTT) or by DTT co-treatment with either LY294002 (25 μM) (DTT/LY), PD098059 (10 μM) (DTT/PD), Entrectinib (1 μM) (DTT/Ent), Lestaurtinib (1 μM) (DTT/Les) or Capivasertib (20 μM) (DTT/Cap) (* p < 0.0001).
Figure 6
Figure 6
Schematic representation of the pro-survival mechanism investigated in this study, including the following: 1. Grp78, Hsp90, Ca2+-calmodulin and ARF1 regulated misfolded TrkAIII importation from the endoplasmic reticulum (ER) into the inner mitochondrial membrane (IMM) via MAMs; 2. Omi cleavage of the IMM-associated misfolded TrkAIII N-terminus, required for subsequent activation of the IMM-associated TrkAIII C-terminus; and 3. Ca2+-calmodulin- (CaM), CaMK II-, Akt-, MCU- and ROS-dependent activation of the cleaved IMM-associated TrkAIII C-terminus, associated with inhibitory mitochondrial PTPase oxidation. The inhibitors used in this study are localized at their points of action, and the inhibitors that reduce TrkAIII SH-SY5Y resistance to DTT-induced death are indicated by the side of “enhanced survival”.

Similar articles

References

    1. Farina A.R., Cappabianca L.A., Zelli V., Sebastiano M., Mackay A.R. Mechanisms involved in selecting and maintaining neuroblastoma cancer stem cell populations, and perspectives for therapeutic targeting. World J. Stem Cells. 2021;13:685–736. doi: 10.4252/wjsc.v13.i7.685. - DOI - PMC - PubMed
    1. Tomolonis J.A., Agarwal S., Shohet J.M. Neuroblastoma pathogenesis: Deregulation of embryonic neural crest development. Cell Tissue Res. 2018;372:245–262. doi: 10.1007/s00441-017-2747-0. - DOI - PMC - PubMed
    1. Johnsen J.I., Dyberg C., Wickstrom M. Neuroblastoma-a neural crest derived embryonal malignancy. Front. Mol. Neurosci. 2019;12:9. doi: 10.3389/fnmol.2019.00009. - DOI - PMC - PubMed
    1. Lines C.L., McGrath M.J., Dorwart T., Conn C.S. The integrated stress response in cancer progression: A force for plasticity and resistance. Front. Oncol. 2023;13:1206561. doi: 10.3389/fonc.2023.1206561. - DOI - PMC - PubMed
    1. Chen X., Cubillos-Ruiz J.R. Endoplasmic reticulum stress signals in the tumour and its microenvironment. Nat. Rev. Cancer. 2021;21:71–88. doi: 10.1038/s41568-020-00312-2. - DOI - PMC - PubMed

MeSH terms