Review
. 2024 May 20;12(5):1133.
doi: 10.3390/biomedicines12051133.

A Primer for Utilizing Deep Learning and Abdominal MRI Imaging Features to Monitor Autosomal Dominant Polycystic Kidney Disease Progression

Affiliations
Review

A Primer for Utilizing Deep Learning and Abdominal MRI Imaging Features to Monitor Autosomal Dominant Polycystic Kidney Disease Progression

Chenglin Zhu et al. Biomedicines. .

Abstract

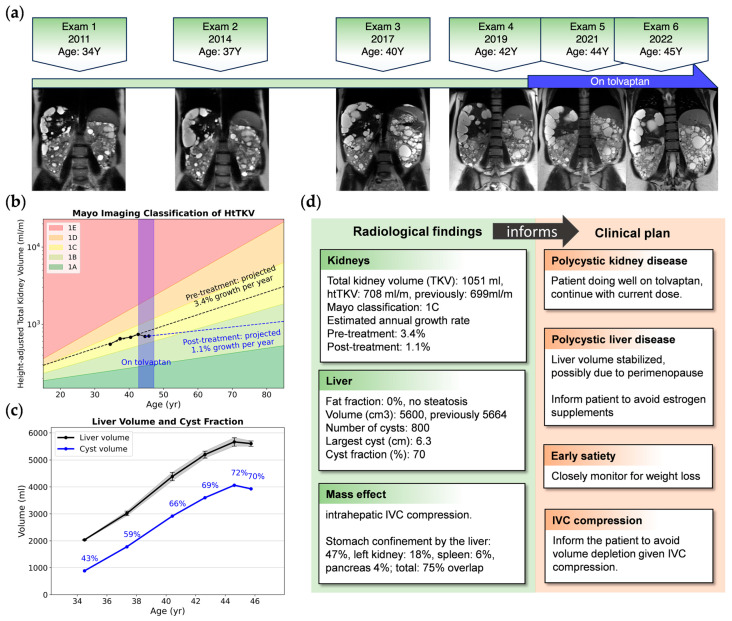
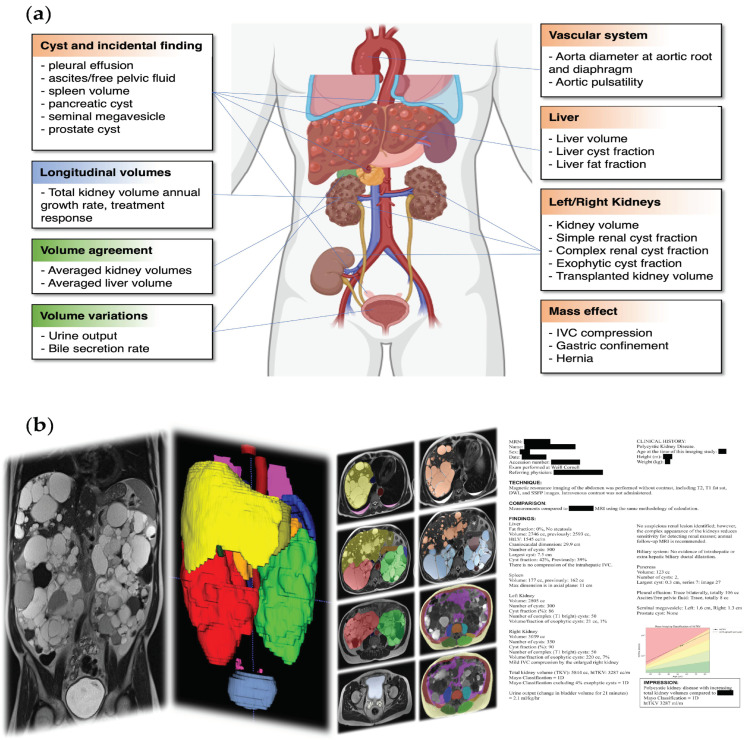
Abdominal imaging of autosomal dominant polycystic kidney disease (ADPKD) has historically focused on detecting complications such as cyst rupture, cyst infection, obstructing renal calculi, and pyelonephritis; discriminating complex cysts from renal cell carcinoma; and identifying sources of abdominal pain. Many imaging features of ADPKD are incompletely evaluated or not deemed to be clinically significant, and because of this, treatment options are limited. However, total kidney volume (TKV) measurement has become important for assessing the risk of disease progression (i.e., Mayo Imaging Classification) and predicting tolvaptan treatment's efficacy. Deep learning for segmenting the kidneys has improved these measurements' speed, accuracy, and reproducibility. Deep learning models can also segment other organs and tissues, extracting additional biomarkers to characterize the extent to which extrarenal manifestations complicate ADPKD. In this concept paper, we demonstrate how deep learning may be applied to measure the TKV and how it can be extended to measure additional features of this disease.

Keywords: autosomal dominant polycystic kidney disease; radiological report; semantic segmentation.


Conflict of interest statement

J.D.B. receives research support from Vertex Pharmaceuticals. D.S. reports consulting fees from Accordant and speaker fees from Otsuka. All other authors declare no conflicts of interest.

Figures

Figure 2
Figure 2
An example of image metrics extracted from longitudinal images and clinical insights for a 34-year-old female with ADPKD, a Mayo class 1C subject who began tolvaptan therapy due to progressive TKV growth. (a) Timeline of MRIs showing representative coronal T2 images; (b) semi-log plot of htTKV versus age showing TKV growing as predicted by the Mayo Imaging Classification, but the trajectory of extrapolated growth pre-treatment (black dashed line) has a steeper slope compared to post tolvaptan treatment (blue dashed line); (c) longitudinal liver volume (black) and total cyst volume with cyst fraction (blue), where liver cyst growth is plateauing, probably due to perimenopause [39]; (d) excerpt of a radiological report providing one piece of evidence to guide clinical decision-making. IVC: inferior vena cava; TKV: total kidney volume; htTKV: height-adjusted total kidney volume.
Figure 1
Figure 1
(a) Features and complications of ADPKD. Metrics derived from longitudinal MR exams (blue), from multiple image sequences within one MR exam (green), and from a single image sequence (brown) are indicated in boxes; (b) image analysis pipeline transforming images (left panel) into segmentation (middle panels) and a radiological analysis report (right panel). From left to right, there is one coronal SSFSE image covering the abdomen to the pelvis, and then the liver (yellow) and kidneys (right = red, left = green) are shown to be enlarged in a 3D rendering of segmentation. The third panel shows the segmentation of multiple anatomical structures on axial images, including organs, tissues (fat and muscles), and cystic pathology. In the fourth panel, there is a radiological report with protected health information redacted.
Figure 3
Figure 3
Kidney volume measurements from ages 36 to 43 in an ADPKD patient show good measurement consistency among multiple MRI pulse sequences, except for at age 41, when an outlier value (red arrow) causes a large measurement standard deviation. Standard deviation is illustrated as error bars showing the degrees of measurement uncertainty. The axial T2 images and segmentation should be reviewed to screen for image artifacts or labeling mistakes. Note that the rate of kidney growth decreases following the initiation of tolvaptan in this patient.
Figure 4
Figure 4
Liver fat fraction estimation in a 62-year-old male ADPKD patient with a (a) normal in-phase T1 image but decreased liver signal on (b) the out-of-phase T1 image corresponding to fatty infiltration. To calculate the hepatic fat fraction, (c) the liver mask (yellow) is taken as the starting point and (d) the hepatic cyst mask (red) is subtracted to yield (e) a pure parenchymal mask used for measuring the whole liver signal drop-out on out-of-phase images, where the fat fraction=lliver in-phase signal intensity  liver out-of-phase signal intensity2 × iver in-phase signal intensity. (f) A parenchymal mask excluding liver and hepatic cyst segmentation, with erosion at the boundary to exclude peripheral fat tissue. (g) A liver voxel signal intensity histogram shows the histogram peak, revealing that there is an 18% calculated liver fat fraction.
Figure 5
Figure 5
Corrected weight and BMI of a female ADPKD patient with a severe polycystic liver. (a) Snapshots of six serial coronal T2 images acquired across 11 years. Notably, images acquired at 3 T in 2019 and 2021 had dielectric artifacts spoiling the image quality, while images acquired from a 1.5 T field with comparable liver cysts in 2022 were free of dielectric artifacts. (b) A plot of longitudinal weight and BMI calculated with correction (blue line) and without correction (black line) shows that, from ages 35 to 40, her weight loss was masked by cyst growth. After 44 years, her uncorrected BMI falsely indicated that she was borderline overweight.
Figure 6
Figure 6
In this 36-year-old ADPKD female patient, the urine output is 7 mL/kg/hour, estimated from serially acquired images during a 15 min MRI exam of 5 sequences; (a) from left to right: coronal T2, coronal SSFP, coronal reformation of axial SSFP, T1, and T2. (b) A graph of urine output corresponding to the slope of a linear regression fit to the bladder volume divided by the subject’s weight. The DICOM image timestamp is treated as the instantaneous acquisition time for each image. In our experience, T1 (red dot) commonly shows a lower bladder volume compared to other sequences. (c) An axial T2 image with a ureteral jet in-flow signal void artifact (yellow arrow).
Figure 7
Figure 7
Images and segmentation from a 45-year-old female ADPKD patient with early satiety (ac), where the liver (L: yellow) and left kidney (LK: green) enlarged by hundreds of cysts squeeze the stomach (S: greenish brown); (d) stomach mask dilated circumferentially by 10 mm (red) to simulate postprandial distension, demonstrating how surrounding organs must be pushed out of the way for the stomach to expand. (e) A pie chart graphically showing the amount of the stomach’s adjacent space occupied by the liver, left kidney, spleen, and pancreas that needs to be pushed out of the way for stomach expansion. Only 25% of the stomach does not touch adjacent organs and is free to expand.

Similar articles

References

    1. Cornec-Le Gall E., Alam A., Perrone R.D. Autosomal dominant polycystic kidney disease. Lancet. 2019;393:919–935. doi: 10.1016/s0140-6736(18)32782-x. - DOI - PubMed
    1. Torres V.E., Chapman A.B., Devuyst O., Gansevoort R.T., Grantham J.J., Higashihara E., Perrone R.D., Krasa H.B., Ouyang J., Czerwiec F.S. Tolvaptan in patients with autosomal dominant polycystic kidney disease. N. Engl. J. Med. 2012;367:2407–2418. doi: 10.1056/NEJMoa1205511. - DOI - PMC - PubMed
    1. Schrier R.W., Brosnahan G., Cadnapaphornchai M.A., Chonchol M., Friend K., Gitomer B., Rossetti S. Predictors of autosomal dominant polycystic kidney disease progression. J. Am. Soc. Nephrol. 2014;25:2399–2418. doi: 10.1681/asn.2013111184. - DOI - PMC - PubMed
    1. Grantham J.J., Torres V.E., Chapman A.B., Guay-Woodford L.M., Bae K.T., King B.F., Jr., Wetzel L.H., Baumgarten D.A., Kenney P.J., Harris P.C., et al. Volume progression in polycystic kidney disease. N. Engl. J. Med. 2006;354:2122–2130. doi: 10.1056/NEJMoa054341. - DOI - PubMed
    1. Taylor J., Thomas R., Metherall P., van Gastel M., Cornec-Le Gall E., Caroli A., Furlano M., Demoulin N., Devuyst O., Winterbottom J., et al. An Artificial Intelligence Generated Automated Algorithm to Measure Total Kidney Volume in ADPKD. Kidney Int. Rep. 2024;9:249–256. doi: 10.1016/j.ekir.2023.10.029. - DOI - PMC - PubMed

Grants and funding

Support from the NIH (grant number: 2M01RR000102-41), the Department of Radiology of Weill Cornell Medicine, and the Shaw Family Foundation is gratefully acknowledged.

LinkOut - more resources