. 2024 May 15;22(5):223.
doi: 10.3390/md22050223.

Extracellular Vesicles from Ecklonia cava and Phlorotannin Promote Rejuvenation in Aged Skin

Affiliations

Extracellular Vesicles from Ecklonia cava and Phlorotannin Promote Rejuvenation in Aged Skin

Sosorburam Batsukh et al. Mar Drugs. .

Abstract

Plant-derived extracellular vesicles (EVs) elicit diverse biological effects, including promoting skin health. EVs isolated from Ecklonia cava (EV-EC) carry heat shock protein 70 (HSP70), which inhibits key regulators such as TNF-α, MAPKs, and NF-κB, consequently downregulating matrix metalloproteinases (MMPs). Aging exacerbates oxidative stress, upregulating MAPK and NF-κB signaling and worsening extracellular matrix degradation in the skin. E. cava-derived phlorotannin (PT) mitigates MAPK and NF-κB signaling. We evaluated the impact of EV-EC and PT on skin rejuvenation using an in vitro keratinocyte senescence model and an in vivo aged-mouse model. Western blotting confirmed the presence of HSP70 in EV-EC. Treatment with EV-EC and PT in senescent keratinocytes increased HSP70 expression and decreased the expression of TNF-α, MAPK, NF-κB, activator protein-1 (AP-1), and MMPs. Oxidative stress was also reduced. Sequential treatment with PT and EV-EC (PT/EV-EC) yielded more significant results compared to individual treatments. The administration of PT/EV-EC to the back skin of aged mice mirrored the in vitro findings, resulting in increased collagen fiber accumulation and improved elasticity in the aged skin. Therefore, PT/EV-EC holds promise in promoting skin rejuvenation by increasing HSP70 expression, decreasing the expression of MMPs, and reducing oxidative stress in aged skin.

Keywords: Ecklonia cava; extracellular vesicles from Ecklonia cava; phlorotannin; skin rejuvenation.


Conflict of interest statement

Kyunghee Byun has received research grants from SACCI Bio Co.

Figures

Figure 1
Figure 1
Characterization of EV-EC and detection of HSP70. (a) TEM images of the EV-EC. Blue dotted line indicates the magnified view (scale bar = 200 nm). (b) Quantification of EV-ECs per exosome diameter based on TEM images, with diameters ranging from 30 to 150 nm. (c) Number distribution of EV-ECs was provided by DLS analysis. (d) Particle size, mode of distribution, and concentration of EV-ECs were determined by NTA. (e) Western blot analysis confirmed the presence of HSP70 protein in EV-EC and PT. Data represent the mean ± SD of three independent experiments. DLS, dynamic light scattering; EV-EC, extracellular vesicles from Ecklonia cava; HSP70, heat shock protein 70; MW, molecular weight; NTA, nanoparticle-tracking analysis; PT, phlorotannin; SD, standard deviation; TEM, transmission electron microscopy.
Figure 2
Figure 2
Modulation of HSP70, TNF-α, MAPK, AP-1, NF-κB, and MMP expression by EV-EC and PT in H2O2-induced SnCs keratinocytes. (a) Western blot analysis of HSP70, TNF-α, and β-actin levels in Non-SnCs and SnCs keratinocytes treated with PBS, EV-EC, PT, or PT/EV-EC. (b) Western blot analysis of pSAPK/JNK, total SAPK/JNK, pp38, total p38, and β-actin levels in Non-SnCs and SnCs keratinocytes. (c) ICC analysis of AP-1 and NF-κB expression (both green) in Non-SnCs and SnCs keratinocytes (nuclei: blue; scale bar = 30 μm). Quantitative data for (ac) are presented in Figure S5. (df) ELISA evaluation of MMP1 (d), MMP3 (e), and MMP9 (f) protein levels in Non-SnCs and SnCs keratinocytes. Data represent the mean ± SD of three independent experiments. ***, p < 0.001, first bar vs. second bar; $, p < 0.05 and $$, p < 0.01, second bar vs. third, fourth, and fifth bars; #, p < 0.05 and ##, p < 0.01, fifth bar vs. third and fourth bars (Mann–Whitney U test). AP-1, activator protein-1; ELISA, enzyme-linked immunosorbent assay; ICC, immunocytochemistry; MMP, matrix metalloproteinase; NF-κB, nuclear factor kappa-light-chain-enhancer of activated B cells; Non-SnCs, non-senescent cells; PBS, phosphate-buffered saline; pp38, phosphorylated p38; pSAPK/JNK, phosphorylated SAPK/JNK; SAPK/JNK, stress-activated protein kinases/Jun-amino-terminal kinase; SnCs, senescent cells; TNF-α, tumor necrosis factor-alpha.
Figure 3
Figure 3
Reduction in reactive oxygen species (ROS) in SnCs keratinocytes by EV-EC and PT enhanced expression of TGF-β and collagen I and III in SnCs fibroblasts. (a) Western blot analysis of NOX1, NOX2, NOX4, and β-actin in Non-SnCs and SnCs keratinocytes treated with EV-EC, PT, and PT/EV-EC. Quantitative data are presented in Figure S9. (b) ELISA evaluation of 8-OhdG protein levels in Non-SnCs and SnCs keratinocytes. (ce) ELISA assessment of TGF-β1 (c), TGF-β2 (d), and TGF-β3 I protein levels in Non-SnCs and SnCs fibroblasts treated with conditioned media (CMPBS, CMH2O2, CMEV-EC, CMPT, and CMPT/EV-EC). (f) ICC analysis of collagen I (upper) and collagen III (lower) expression (both green) in Non-SnCs and SnCs fibroblasts (nuclei: blue; scale bar = 30 μm). Quantitative data are presented in Figure S8. Data represent the mean ± SD of three independent experiments. ***, p < 0.001, first bar vs. second bar; $, p < 0.05 and $$, p < 0.01, second bar vs. third, fourth, and fifth bars; #, p < 0.05 and ##, p < 0.01, fifth bar vs. third and fourth bars (Mann–Whitney U test). 8-OHdG, 8-hydroxy-2′-deoxyguanosine; NOX, nicotinamide adenine dinucleotide phosphate oxidases; TGF-β, transforming growth factor-beta.
Figure 4
Figure 4
Modulation of HSP70, TNF-α, MAPK, AP-1, NF-κB, and MMPs expression by PT/EV-EC treatment in the skin of aged mice. (a) Western blot analysis of HSP70, TNF-α, and β-actin levels in the skin of young and aged mice. (b) Western blot analysis of pSAPK/JNK, total SAPK/JNK, pp38, total p38, and β-actin levels in the skin of young and aged mice. (c) IHC staining of AP-1 and NF-κB in the epidermis of young and aged mice (IHC signal: brown; nuclei: blue; scale bar = 80 μm). Quantitative data from (ac) are presented in Figure S18. (df) ELISA assessment of MMP1, MMP3, and MMP9 in the skin of young and aged mice. Data represent the mean ± SD of three independent experiments. ***, p < 0.001, first bar vs. second bar; $$, p < 0.01, second bar vs. third bar (Mann–Whitney U test). AP-1, activator protein-1; DW, distilled water; IHC, immunohistochemistry.
Figure 5
Figure 5
PT/EV-EC treatment reduced ROS levels and increased TGF-β1, TGF-β2, TGF-β3, and collagen I and III expression in the skin of aged mice. (a) Western blot analysis of NOX1, NOX2, NOX4, and β-actin in the skin of young and aged mice. (be) ELISA assessment of 8-OHdG, TGF-β1, TGF-β2, and TGF-β3 in the skin of young and aged mice. (f) IHC staining of collagen I (upper) and III (lower) in the dermis of young and aged mice (IHC signal: brown, nuclei: blue; scale bar = 100 μm). Quantitative data from (a,f) are presented in Figure S19. Data represent the mean ± SD of three independent experiments. ***, p < 0.001, first bar vs. second bar; $$, p < 0.01, second bar vs. third bar (Mann–Whitney U test).
Figure 6
Figure 6
Basement membrane recovery in the skin of aged mice post EV-EC and PT treatment. (a) IHC staining of laminin (upper) and nidogen (lower) in the dermis of young and aged mice (IHC signal: brown, nuclei: blue; scale bar = 30 μm). (bc) Quantification of laminin and nidogen signal intensities from the images in (a). (d) BM assessment via TEM imaging of young and aged skin (scale bar = 1 μm). Green marks represent hemidesmosomes, and red indicates lamina densa with disruptions or duplications. Data represent the mean ± SD of three independent experiments. ***, p < 0.001, first bar vs. second bar; $$$, p < 0.001, second bar vs. third bar (Mann–Whitney U test). BM, basement membrane.
Figure 7
Figure 7
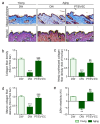
Enhanced rejuvenation by PT/EV-EC treatment in the skin of aged mice. (a) Masson’s trichrome staining (blue) depicting collagen fiber (upper) and Herovici’s staining of newly synthesized (blue) and mature (red) collagen fibers in skin samples from young and aged mice (scale bar = 100 µm). (b) Quantification of Masson’s trichrome staining from panel (a). (c,d) Quantification of Herovici’s staining from panel (a). (e) Skin elasticity before and 4 weeks after PT/EV-EC dermal injection in the skin of young and aged mice was measured using the API-100 instrument. Data represent the mean ± SD of three independent experiments. **, p < 0.01 and ***, p < 0.001, first bar vs. second bar; $$, p < 0.01 and $$$, p < 0.001, second bar vs. third bar (Mann–Whitney U test). AU, arbitrary unit.
Figure 8
Figure 8
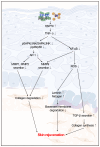
Summary of rejuvenation effects of sequential PT and EV-EC treatments on aged skin. Upon treatment, HSP70 expression increased, while expression of TNF-α, pSAPK/JNK, pp38, AP-1, and NF-κB decreased, concomitant with reduced oxidative stress. Similarly, secretion of MMP1, MMP3, and MMP9 declined. Subsequently, expression of TGF-β1, TGF-β2, TGF-β3, collagen I, collagen III, and basement membrane proteins (laminin and nidogen) was elevated. These changes facilitated accumulation of collagen fibers and improvement in elasticity in PT/EV-EC-treated skin of aged mice.

Similar articles

References

    1. Abels E.R., Breakefield X.O. Introduction to Extracellular Vesicles: Biogenesis, RNA Cargo Selection, Content, Release, and Uptake. Cell Mol. Neurobiol. 2016;36:301–312. doi: 10.1007/s10571-016-0366-z. - DOI - PMC - PubMed
    1. Raposo G., Stoorvogel W. Extracellular vesicles: Exosomes, microvesicles, and friends. J. Cell Biol. 2013;200:373–383. doi: 10.1083/jcb.201211138. - DOI - PMC - PubMed
    1. Théry C., Witwer K.W., Aikawa E., Alcaraz M.J., Anderson J.D., Andriantsitohaina R., Antoniou A., Arab T., Archer F., Atkin-Smith G.K., et al. Minimal information for studies of extracellular vesicles 2018 (MISEV2018): A position statement of the International Society for Extracellular Vesicles and update of the MISEV2014 guidelines. J. Extracell. Vesicles. 2018;7:1535750. doi: 10.1080/20013078.2018.1535750. - DOI - PMC - PubMed
    1. Tarasuntisuk S., Patipong T., Hibino T., Waditee-Sirisattha R., Kageyama H. Inhibitory effects of mycosporine-2-glycine isolated from a halotolerant cyanobacterium on protein glycation and collagenase activity. Lett. Appl. Microbiol. 2018;67:314–320. doi: 10.1111/lam.13041. - DOI - PubMed
    1. An Q., van Bel A.J., Hückelhoven R. Do plant cells secrete exosomes derived from multivesicular bodies? Plant Signal. Behav. 2007;2:4–7. doi: 10.4161/psb.2.1.3596. - DOI - PMC - PubMed