. 2024 May 23;7(1):618.
doi: 10.1038/s42003-024-06186-6.

The gluconeogenesis enzyme PCK2 has a non-enzymatic role in proteostasis in endothelial cells

Affiliations

The gluconeogenesis enzyme PCK2 has a non-enzymatic role in proteostasis in endothelial cells

Pauline de Zeeuw et al. Commun Biol. .

Abstract

Endothelial cells (ECs) are highly glycolytic, but whether they generate glycolytic intermediates via gluconeogenesis (GNG) in glucose-deprived conditions remains unknown. Here, we report that glucose-deprived ECs upregulate the GNG enzyme PCK2 and rely on a PCK2-dependent truncated GNG, whereby lactate and glutamine are used for the synthesis of lower glycolytic intermediates that enter the serine and glycerophospholipid biosynthesis pathways, which can play key roles in redox homeostasis and phospholipid synthesis, respectively. Unexpectedly, however, even in normal glucose conditions, and independent of its enzymatic activity, PCK2 silencing perturbs proteostasis, beyond its traditional GNG role. Indeed, PCK2-silenced ECs have an impaired unfolded protein response, leading to accumulation of misfolded proteins, which due to defective proteasomes and impaired autophagy, results in the accumulation of protein aggregates in lysosomes and EC demise. Ultimately, loss of PCK2 in ECs impaired vessel sprouting. This study identifies a role for PCK2 in proteostasis beyond GNG.


Conflict of interest statement

The authors declare no competing interests.

Figures
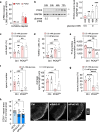
Fig. 1
Fig. 1. Role of endothelial PCK2 in vessel sprouting.
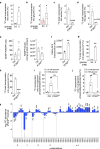
a qRT-PCR analysis of PCK1 and PCK2 mRNA levels in ECs (HUVEC) (n = 4) and HepG2 cells (n = 4; used as positive control); nd, not detectable. b Representative immunoblot and densitometric quantification of PCK2 protein level in ECs in glucose-deprived (0 mM) versus control (24 h 5.5 mM glucose) conditions for the indicated time points (n = 4). GAPDH was used as a loading control. c Quantification of cell death (LDH release assay) in control and PCK2KD1 ECs in 5.5 versus 0 mM glucose (n = 5). d Quantification of TUNEL+ cells in control and PCK2KD1 ECs in 5.5 versus 0 mM glucose (n = 8). e 3H-thymidine incorporation into DNA in control and PCK2KD1 ECs in 5.5 versus 0 mM glucose (n = 7); dpm, disintegrations per minute. f Number of sprouts and average sprout length per spheroid in mitomycin C (MitoC)-treated control and PCK2KD1 ECs in 5.5 versus 0 mM glucose (n = 6). g Scratch wound closure (proxy of EC migration) in MitoC-treated control and PCK2KD1 ECs in 5.5 versus 0 mM glucose (n = 6). h Representative immunofluorescence images of CD31-stained neovessels (gray) in corneal flat-mounts from mice after surgical implantation in the eye of bFGF pellets containing a negative control or Pck2-targeting siRNA and corresponding quantification of CD31+ vessel area as percentage of total cornea area (n = 13–14). Scale bars are 300 µm. Data are mean ± s.e.m. Statistics: ANOVA (cg), two-tailed t-test with Welch’s correction (b, h); *P < 0.05; **P < 0.01; ***P < 0.001; ****P < 0.0001; ns not significant.
Fig. 2
Fig. 2. Effect of PCK2 silencing on EC morphology and membrane integrity.
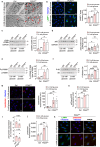
a Quantification of cell area in control and PCK2KD1 ECs in 5.5 versus 0 mM glucose (n = 5). b Representative immunofluorescence images of F-actin (phalloidin staining; white) in control and PCK2KD1 ECs in 5.5 versus 0 mM glucose (n = 5). c qRT-PCR analysis of tight junction protein 1 (TJP1) and claudin-5 (CLDN5) mRNA levels in control and PCK2KD1 ECs in 5.5 versus 0 mM glucose (n = 3). d Representative immunofluorescence images of VE-cadherin staining and quantification of VE-cadherin+ (dis)continuous junction length (graph right to the images) in control and PCK2KD1 ECs in 5.5 versus 0 mM glucose (n = 3). White arrowheads show VE-cadherin+ discontinuous junctions. e, f Quantification of reticular structure area (e) and gap size index (f) on VE-cadherin immunostained control and PCK2KD1 ECs in 5.5 versus 0 mM glucose (n = 3). g Trans-endothelial electrical resistance (TEER) measurements in proliferation-blocked (MitoC-treated) confluent control and PCK2KD1 EC monolayers in 5.5 versus 0 mM glucose (glc) (n = 5). Asterisks and hashtags in (g) denote statistically significant differences between KD and control respectively at 5.5 mM and at 0 mM glucose. Data are mean ± s.e.m. Statistics: ANOVA (a, cf) two-tailed t-test with Welch’s correction (g); * or #P < 0.05; ** or ##P < 0.01; *** or ###P < 0.001; **** or ####P < 0.0001; ns not significant. Scale bars in (b, d) are 10 µm; AU, arbitrary units.
Fig. 3
Fig. 3. PCK2 controls channeling of glutamine- and lactate-derived carbons into lower glycolytic intermediates in glucose-deprived ECs.
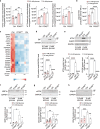
a Heatmap of transcript levels of metabolic genes involved in gluconeogenesis (GNG), glycolysis, pentose phosphate pathway (PPP), serine and glycine biosynthesis pathway, 1-carbon (1 C) metabolism, aspartate and glutamine metabolism and amino acid (AA) transporters (transp.) from bulk RNA sequencing of ECs in 5.5 versus 0 mM glucose (n = 3). Color scale: red, high expression; blue, low expression. b, c Incorporation of [U13C]-glutamine and [U13C]-lactate carbon into total intracellular phosphoenolpyruvate (PEP) pool (b; n = 6) and 2/3-phosphoglycerate (2/3-PG) pool (c; n = 7) in ECs in 5.5 versus 0 mM glucose. d, e Incorporation of [U13C]-glutamine and [U13C]-lactate carbon into total intracellular PEP pool (d) and 2/3-PG pool (e) in control and PCK2KD1 glucose-deprived ECs (n = 5). f Intracellular levels of PEP, normalized (norm.) to protein content (expressed in AUC/µg protein), in control and PCK2KD1 glucose-deprived ECs (n = 3). AUC, area under the curve. g Incorporation of [U13C]-glutamine and [U13C]-lactate carbon into total intracellular dihydroxyacetone phosphate (DHAP) pool in ECs in 5.5 versus 0 mM glucose (n = 3). Data are mean ± s.e.m. Statistics: two-tailed t-test with Welch’s correction (bg); *P < 0.05; **P < 0.01; ***P < 0.001; ****P < 0.0001.
Fig. 4
Fig. 4. PCK2-derived glycolytic intermediates shuttle into serine/glycine biosynthesis and glyceroneogenesis.
a, b Incorporation of [U13C]-glutamine and [U13C]-lactate carbon into total intracellular serine pool (a; n = 3) and glycine pool (b; n = 6) in ECs in 5.5 versus 0 mM glucose. c, d Incorporation of [U13C]-glutamine and [U13C]-lactate carbon into total intracellular serine pool (c; n = 5) and glycine pool (d; n = 3) in control and PCK2KD1 glucose-deprived ECs. e Intracellular NADPH levels and NADP+/NADPH ratio in control and PCK2KD1 glucose-deprived ECs (n = 6). f Quantification of cellular ROS levels (measured as median CM-H2DCF fluorescence levels) in control and PCK2KD1 glucose-deprived ECs (n = 3). g Incorporation of [U13C]-glutamine and [U13C]-lactate carbon into total intracellular glycerol-3-phosphate pool in ECs in 5.5 versus 0 mM glucose (n = 3). h Incorporation of [U13C]-glutamine and [U13C]-lactate carbon into total intracellular glycerol-3-phosphate pool in control and PCK2KD1 glucose-deprived ECs (n = 3). i, j Incorporation of [U13C]-glutamine and [U13C]-lactate carbon into fractional m + 3 intracellular glycerol-phosphatidylcholine pool (i) and glycerol-phosphatidylethanolamine pool (j) in control and PCK2KD1 ECs in 5.5 versus 0 mM glucose (n = 3). k Phospholipidomic profile analysis showing the log2 abundance of saturated, mono-, di- and poly-unsaturated glycerol-phosphatidylcholine (PC) phospholipid species in PCK2KD1 glucose-deprived ECs (n = 4–5 HUVEC donors) relative to their respective wild type control glucose-deprived ECs. The numbers under the axes indicate the carbon length of the fatty acid within each group of unsaturation degree (zero to ≥ 4). Data are mean ± s.e.m. Statistics: two-tailed t-test with Welch’s correction (ah); ANOVA (i, j); one-sample t and Wilcoxon test (k) *P < 0.05; **P < 0.01; ***P < 0.001; ****P < 0.0001. AU arbitrary units.
Fig. 5
Fig. 5. PCK2-silenced ECs have decelerated autolysosomal clearance of protein aggregates.
a Representative transmission electron microscopy (TEM) images of control and PCK2KD1 ECs in 5.5 versus 0 mM glucose (n = 3). Red arrowheads show (auto)lysosomal structures. b Representative immunofluorescence images of LAMP1 (green; lysosomal marker) staining and quantification of LAMP1+ staining area per cell nucleus in control and PCK2KD1 ECs in 5.5 versus 0 mM glucose (n = 3). Nuclei are counterstained with Hoechst (blue). c Representative immunoblot of LC3B protein level and densitometric quantification of LC3BII (lipidated)/LC3BI (non-lipidated) ratio in control and PCK2KD1 ECs in 5.5 versus 0 mM glucose (n = 3). GAPDH was used as a loading control. d Representative immunoblot and densitometric quantification of p62 protein level in control and PCK2KD1 ECs in 5.5 versus 0 mM glucose (n = 9). GAPDH was used as a loading control. e Representative immunoblot and densitometric quantification of phosphorylated (P)-p70S6K at threonine (T) 389/total p70S6K protein ratio in control and PCK2KD1 ECs in 5.5 versus 0 mM glucose (n = 3). f Representative immunoblot and densitometric quantification of phosphorylated (P)-S6/total S6 protein ratio in control or PCK2KD1 ECs in 5.5 versus 0 mM glucose (n = 5). g Representative images of lysotracker (red) and Hoechst (blue) staining and quantification of lysotracker+ staining area per cell nucleus in control and PCK2KD1 ECs in 5.5 versus 0 mM glucose (n = 5). h Quantification of relative autolysosomal degradation levels (measured as the ratio of median mCherry/GFP fluorescence levels) in control and PCK2KD1 ECs transduced with mCherry(acid-insensitive)-GFP(acid-sensitive)-LC3 lentiviral vector (see Methods) in 5.5 versus 0 mM glucose (n = 4). i Quantification of p62 protein level in control and PCK2KD1 ECs in normal glucose conditions, upon 2 h treatment with bafilomycin A (Baf.; 50 nM) or chloroquine (CQ; 50 µM) (relative to untreated control or PCK2KD1 ECs) (n = 6). j Quantification of protein aggregate levels (measured as median proteostat fluorescence levels) in control and PCK2KD1 ECs in 5.5 versus 0 mM glucose (n = 3). k Representative immunofluorescence images of LAMP1 (green), proteostat (red) and Hoechst (blue) staining in PCK2KD1 ECs in 5.5 versus 0 mM glucose (n = 3). Data are mean ± s.e.m. Statistics: ANOVA (bh, j), two-tailed t-test with Welch’s correction (i); *P < 0.05; **P < 0.01; ***P < 0.001; ****P < 0.0001. Scale bars are 500 nm in (a) and 10 µm in (b, g, k); AU arbitrary units.
Fig. 6
Fig. 6. PCK2 silencing affects proteostasis.
a Quantification of conjugated ubiquitin levels (measured as median fluorescence levels of mono- and poly-ubiquitinylated conjugates (n = 5), specific K48-linked poly-ubiquitinylated conjugates (n = 3) or specific K63-linked poly-ubiquitinylated conjugates (n = 3)) in control and PCK2KD1 ECs in 5.5 versus 0 mM glucose. AU, arbitrary units. b Quantification of proteasome activity (measured as luminescence signal emitted upon the degradation of aminoluciferin-tagged peptide substrate Z-nLPnLD-aminoluciferin upon caspase-like proteolytic activity) in control and PCK2KD1 ECs in 5.5 versus 0 mM glucose (n = 4); RLU relative luminescence units. c Heatmap of transcript levels of molecular chaperones (BiP (HSPA5), eIF2α (EIF2A), ATF4, CHOP (DDIT3), XBP1, ATF6, heat shock protein 90 (HSP90B1), Derlin (DERL2/3), PDI (PDIA3/4/6), EDEM1/2/3, DNAJB9, calreticulin (CALR) and calnexin (CANX)) involved in the unfolded protein response (UPR) assessed by bulk RNA sequencing of control and PCK2KD1 ECs in 5.5 versus 0 mM glucose (n = 3). Color scale: red, high expression; blue, low expression. dh Representative immunoblot and densitometric quantification of BiP (d; n = 6), ATF4 (e; n = 4), CHOP (e; n = 3), spliced XBP1 (XBP1s; see black arrowhead) (f; n = 3), cleaved ATF6 (cATF6) (g; n = 7) and ERp72 (h; n = 4) protein levels in control and PCK2KD1 ECs in 5.5 versus 0 mM glucose. GAPDH was used as a loading control. Data are mean ± s.e.m. Statistics: ANOVA (a, b–h); *P < 0.05; **P < 0.01; *** P < 0.001; ****P < 0.0001.

Similar articles

References

    1. Eelen G, et al. Endothelial cell metabolism. Physiol. Rev. 2018;98:3–58. doi: 10.1152/physrev.00001.2017. - DOI - PMC - PubMed
    1. Kalucka, J. et al. Quiescent endothelial cells upregulate fatty acid beta-oxidation for vasculoprotection via redox homeostasis. CellMetab. 28, 881–894 (2018). - PubMed
    1. Schoors S, et al. Fatty acid carbon is essential for dNTP synthesis in endothelial cells. Nature. 2015;520:192–197. doi: 10.1038/nature14362. - DOI - PMC - PubMed
    1. Vandekeere, S. et al. Serine synthesis via PHGDH is essential for heme production in endothelial cells. Cell Metab. 28, 573–587 (2018). - PubMed
    1. Eelen G, et al. Role of glutamine synthetase in angiogenesis beyond glutamine synthesis. Nature. 2018;561:63–69. doi: 10.1038/s41586-018-0466-7. - DOI - PubMed

MeSH terms

Substances