. 2024 Jun;630(8015):166-173.
doi: 10.1038/s41586-024-07465-2. Epub 2024 May 22.

Acquisition of epithelial plasticity in human chronic liver disease

Affiliations

Acquisition of epithelial plasticity in human chronic liver disease

Christopher Gribben et al. Nature. 2024 Jun.

Abstract

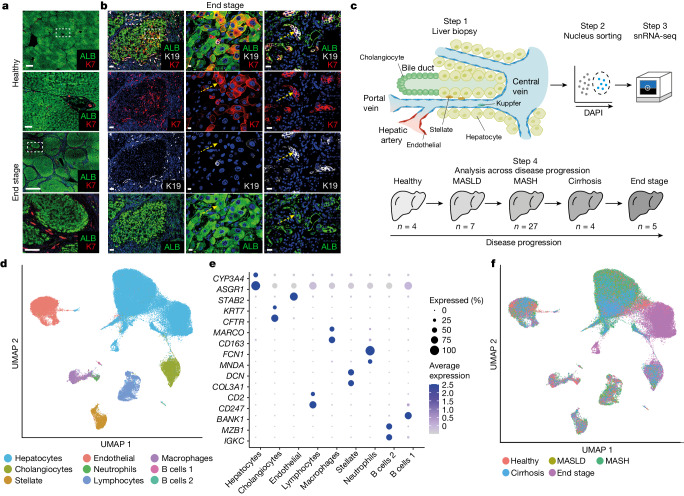
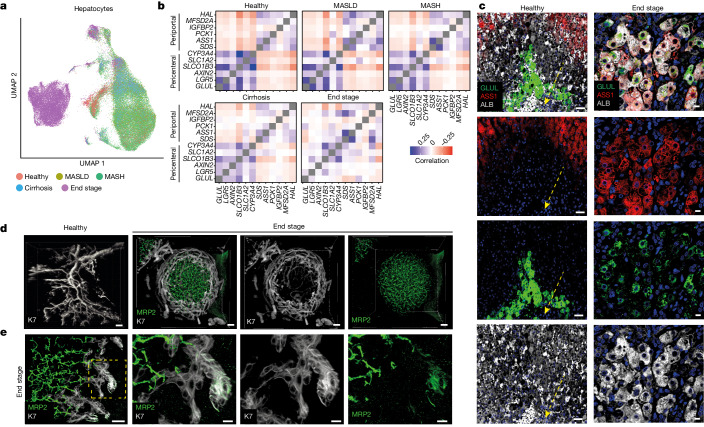
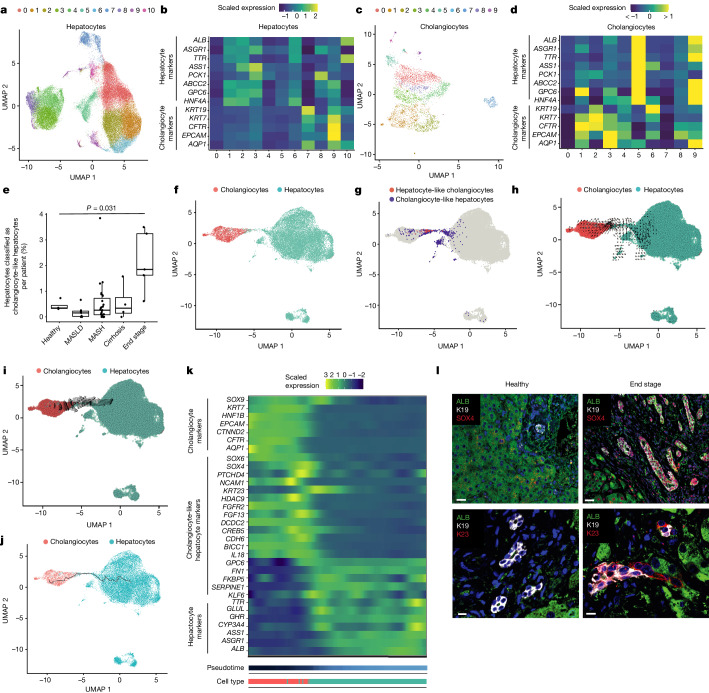
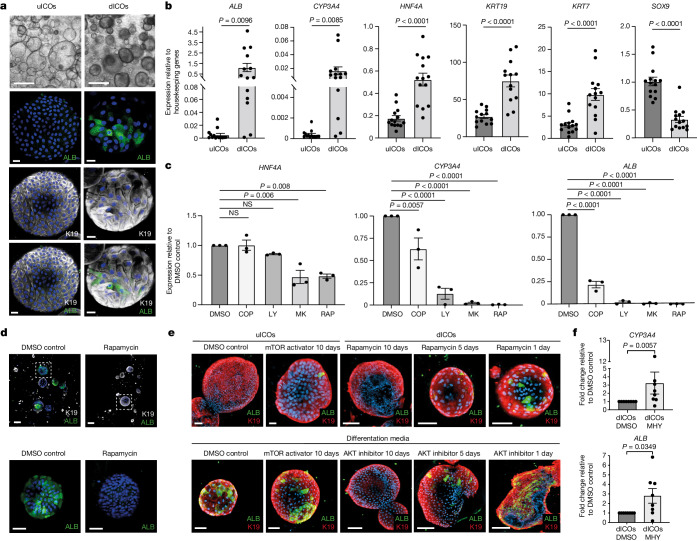
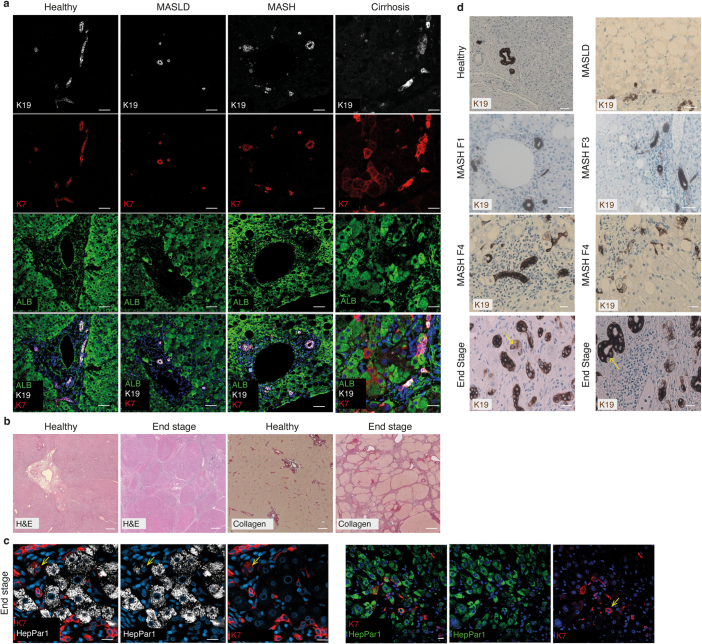
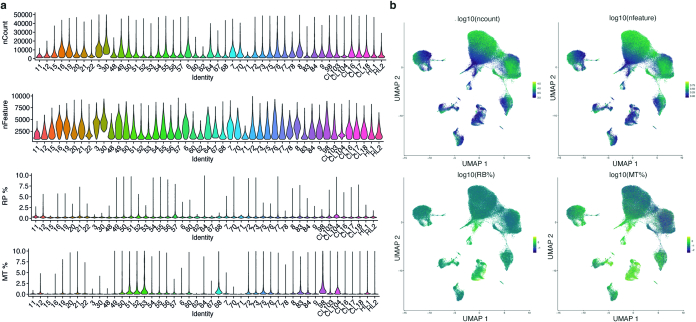
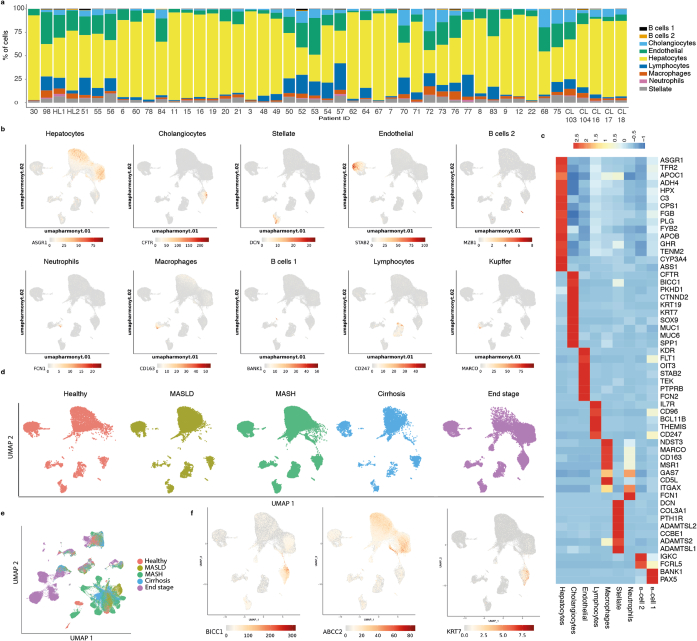
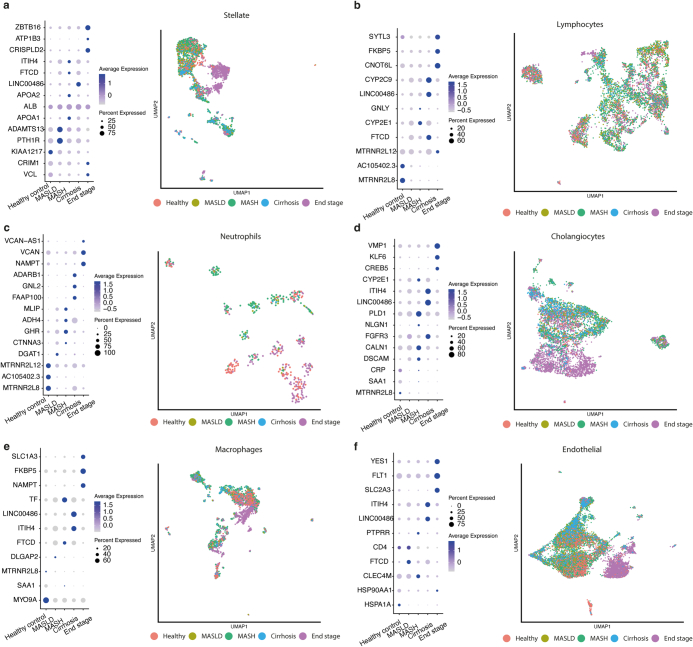
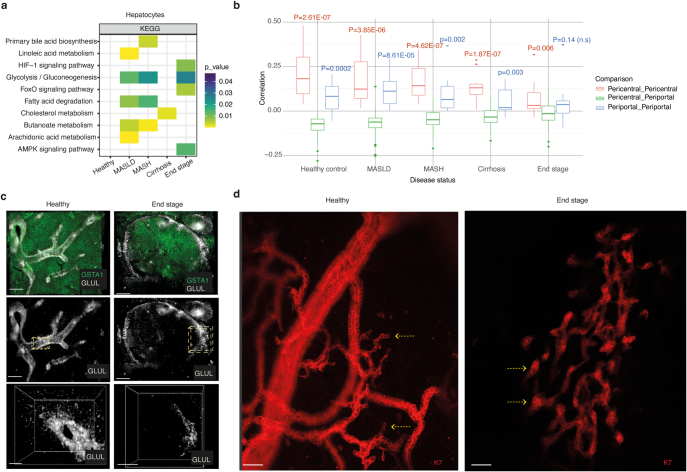
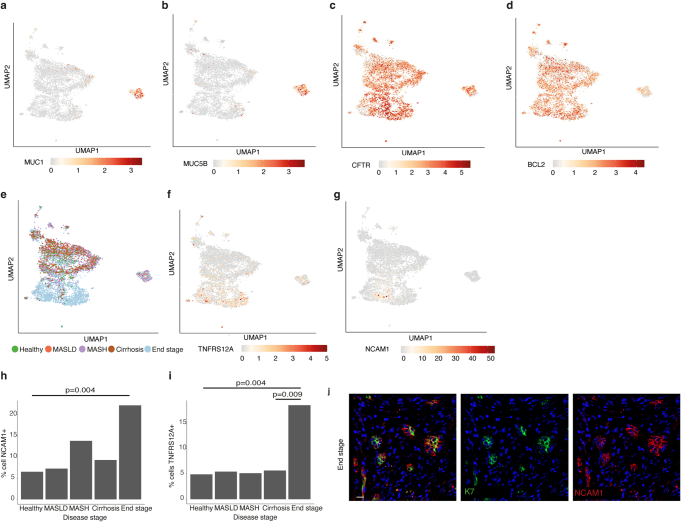
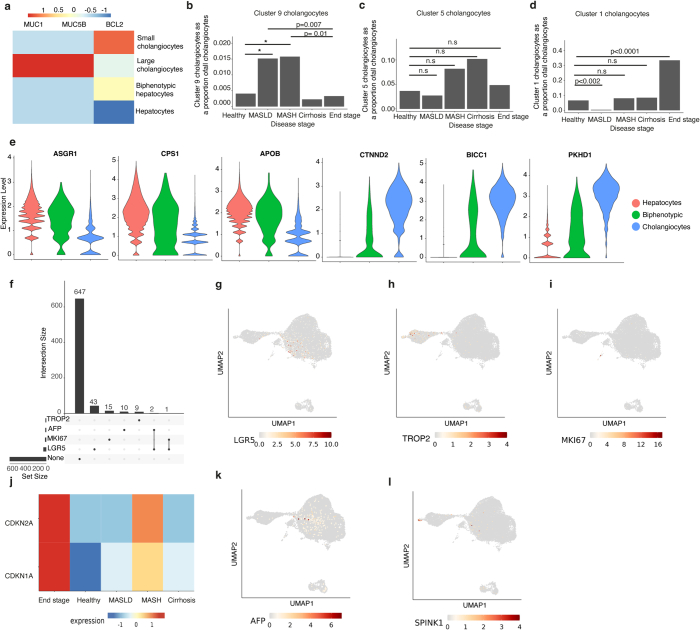
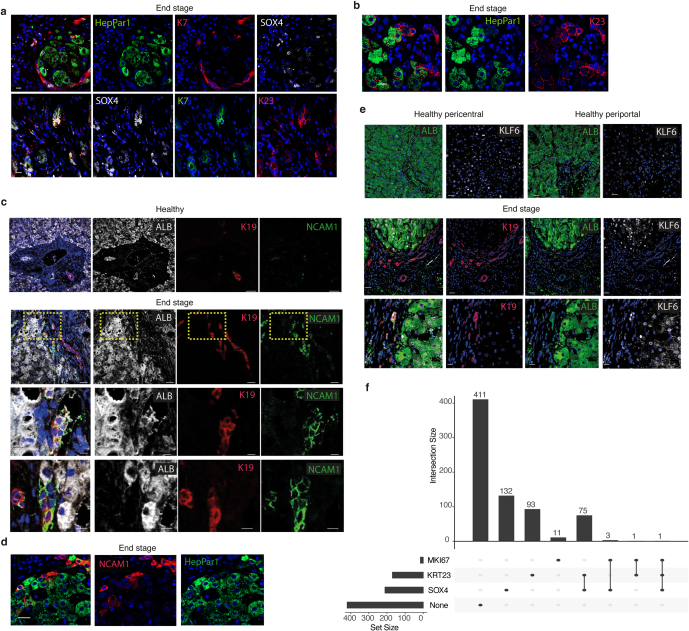
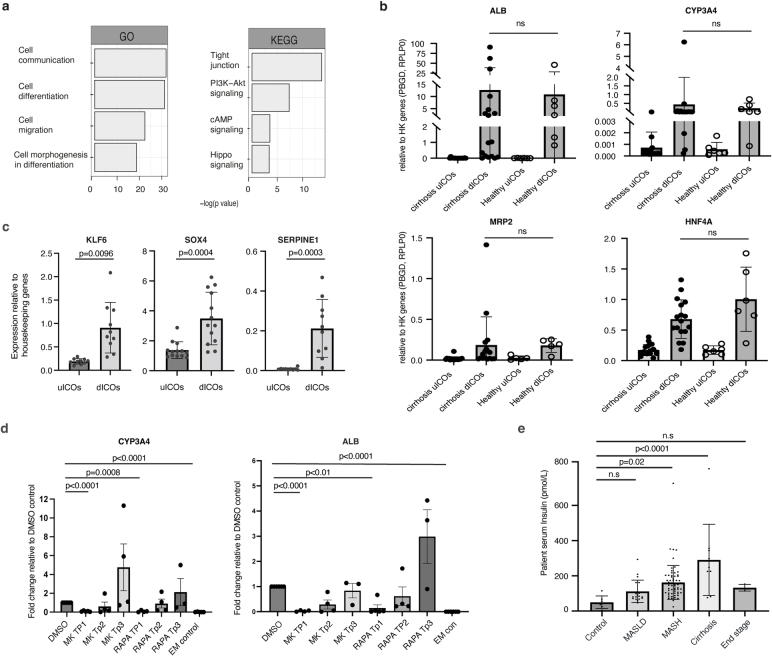
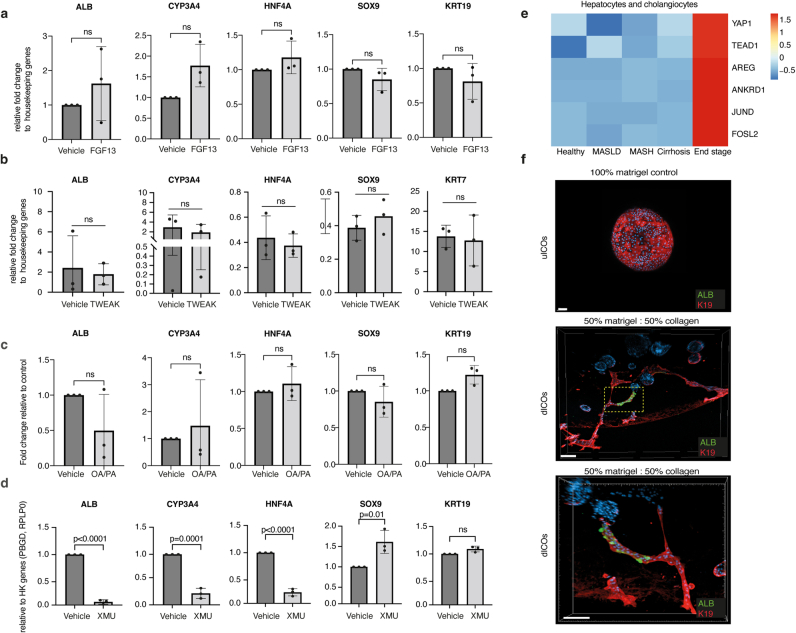
For many adult human organs, tissue regeneration during chronic disease remains a controversial subject. Regenerative processes are easily observed in animal models, and their underlying mechanisms are becoming well characterized1-4, but technical challenges and ethical aspects are limiting the validation of these results in humans. We decided to address this difficulty with respect to the liver. This organ displays the remarkable ability to regenerate after acute injury, although liver regeneration in the context of recurring injury remains to be fully demonstrated. Here we performed single-nucleus RNA sequencing (snRNA-seq) on 47 liver biopsies from patients with different stages of metabolic dysfunction-associated steatotic liver disease to establish a cellular map of the liver during disease progression. We then combined these single-cell-level data with advanced 3D imaging to reveal profound changes in the liver architecture. Hepatocytes lose their zonation and considerable reorganization of the biliary tree takes place. More importantly, our study uncovers transdifferentiation events that occur between hepatocytes and cholangiocytes without the presence of adult stem cells or developmental progenitor activation. Detailed analyses and functional validations using cholangiocyte organoids confirm the importance of the PI3K-AKT-mTOR pathway in this process, thereby connecting this acquisition of plasticity to insulin signalling. Together, our data indicate that chronic injury creates an environment that induces cellular plasticity in human organs, and understanding the underlying mechanisms of this process could open new therapeutic avenues in the management of chronic diseases.


Conflict of interest statement

The authors declare no competing interests.

Figures

Fig. 1
Fig. 1. Using snRNA-seq of MASLD progression to analyse cholangiocyte and hepatocyte plasticity.
a, Immunofluorescence staining for K7 and ALB in liver sections from healthy donors and those with end stage disease, with high magnification of the areas in the dashed boxes underneath. Scale bars: 1,000 μm for low magnifications and 100 μm for high magnifications; n = 3 healthy and n = 3 end-stage-disease tissue samples. b, Immunofluorescence staining of end-stage MASLD tissue sections. High magnification of the dashed boxes shows examples of cells that are double-positive for K19 or K7 and for ALB in the hepatocyte nodule and in the surrounding ductal structures. An example is indicated by the yellow arrows; n = 3 tissue samples. Scale bars: left, 100 μm; middle, 10 μm; right, 15 μm. c, Schematic of the snRNA-seq experimental workflow; n shows the number of samples at each stage. d, Overall UMAP showing cell annotation from all disease stages after quality control. e, Bubble plot of the expression of cell-type markers. f, Overall UMAP shown by disease stage.
Fig. 2
Fig. 2. Major changes in hepatocyte zonation and biliary-tree remodelling in end-stage MASLD.
a, UMAP of hepatocytes annotated by disease stage. b, Correlation analysis examining expression of pericentral and periportal hepatocyte markers across disease progression. c, Immunofluorescence staining for pericentral marker GLUL, periportal marker ASS1 and pan-hepatocyte marker ALB in healthy and end-stage MASLD tissue sections. The yellow dashed arrow indicates the central vein; n = 3 healthy and n = 3 end-stage tissue samples. Scale bars: 50 μm (healthy) and 10 μm (end stage). d, 3D projections of cleared healthy and end-stage MASLD liver samples. Staining with K7 for cholangiocytes and MRP2 for hepatocytes; n = 3 healthy and n = 3 end-stage tissue samples. Scale bars: 100 μm (healthy), 50 μm (end stage). e, The area in the yellow box (left) is shown in higher magnification in the other three boxes, highlighting an example of a MRP2–K19 co-positive cell at the end of a duct; n = 3 healthy and n = 3 end-stage tissue samples. Scale bars: 30 μm (left), 10 μm (the other panels). See also Supplementary Videos 3 and 4.
Fig. 3
Fig. 3. Using snRNA-seq identifies cholangiocyte and hepatocyte plasticity.
a, Subclustering of hepatocytes. b, Relative expression of hepatocyte and cholangiocyte markers across hepatocyte subclusters. c, Subclustering of cholangiocytes. d, Relative expression of hepatocyte and cholangiocyte markers across cholangiocyte subclusters. e, Proportion of hepatocytes classified as cholangiocyte-like hepatocytes (identified by subclustering hepatocyte cluster 9 in b) that are expressing cholangiocyte markers, by disease stage. Statistical significance was calculated using two-sided Welch’s t-test (n = 47 biologically independent donors: healthy, 4; NAFLD, 7; NASH, 27; cirrhosis, 4; end stage, 5). The P value was 0.03058 (significant under a 0.05 threshold). The mid-point, minimum and maximum of the boxplot summary correspond to the median, first and third quartiles. The extent of the whiskers corresponds to the largest and smallest values no further than 1.5 IQR from the inter-quartile range. f, UMAP of cholangiocytes and hepatocytes from end-stage MASLD disease only. g, Cholangiocyte-like hepatocytes and hepatocyte-like cholangiocytes (identified by subclustering hepatocyte cluster 9 in b and subclustering cholangiocyte cluster 1 in d, respectively) that express hepatocyte markers are plotted to show their location on the UMAP. h, RNA velocity using cholangiocyte-like hepatocytes. i, RNA velocity using hepatocyte-like cholangiocytes. j, Pseudotime trajectory across the connected region of the two cell types. k, Heat map of DEGs (differentially expressed genes) across the trajectory. l, Immunofluorescence staining of the cholangiocyte-like hepatocyte markers SOX4 and K23 alongside ALB and K19 in healthy and end-stage sections; n = 3 healthy and n = 3 end-stage tissue samples. Scale bars: 30 μm in the SOX4 images (top); 10 μm in the K23 images (bottom).
Fig. 4
Fig. 4. The PI3K–AKT–mTOR pathway is a key regulator of cholangiocyte-to-hepatocyte plasticity.
a, Bright-field images and immunofluorescence staining of organoids treated with cholangiocyte organoid medium (uICO) or with differentiation medium (dICO) for ALB and K19; n = 6 patient-derived organoid lines. Scale bars: 500 μm, bright-field; 20 μm, immunofluorescence. b, mRNA expression of hepatocyte markers (ALB, CYP3A4 and HNF4A) and cholangiocyte markers (KRT19, KRT7 and SOX9) in uICOs and dICOs; n = 14 biologically independent experiments (unpaired two-tailed t-test; errors bars indicate s.e.m.). c, mRNA expression of hepatocyte markers in organoids differentiated in the presence of DMSO, copanlisib (a PI3K inhibitor), LY294002 (a PI3K inhibitor), MK2206 (an AKT inhibitor) or rapamycin (an mTOR inhibitor); n = 3 biologically independent experiments (P values indicated, ordinary one-way ANOVA, adjusted for multiple comparisons; errors bars show mean ± s.d.). d, Immunofluorescence staining for K19 and ALB in organoids differentiated in the presence of DMSO or the mTOR inhibitor rapamycin (top); bottom image shows high magnification of the area in the white box; n = 3 patient-derived organoid lines. Scale bars: 100 μm, top; 50 μm, bottom. e, Immunofluorescence staining for K19 and ALB in uICOs and dICOs treated with DMSO, an mTOR activator (MHY1485), an AKT inhibitor (MK2206) or an mTOR inhibitor (rapamycin) for the number of days indicated; n = 3 patient organoid lines. Scale bars: top, left to right: 100 μm, 40 μm, 100 μm, 70 μm, 70 μm; bottom, left to right: 40 μm, 80 μm, 100 μm, 100 μm, 100 μm. f, mRNA expression of the hepatocyte markers ALB and CYP3A4 in dICOs treated for 10 days with DMSO or an mTOR activator (MHY); n = 8 biologically independent experiments (P values indicated, two-tailed t-test; error bars indicate s.e.m.). Source Data
Extended Data Fig. 1
Extended Data Fig. 1. Biphenotypic cells are observed in late stages of the disease progression.
a) Immunofluorescent staining for ALB, K19 and K7 on tissue sections from healthy, MASLD, MASH and Cirrhosis staging. Scale bars = 50 um for Healthy MASLD and MASH panels and 20um for cirrhosis panels b) H&E and collagen staining of healthy and end stage MASLD tissue sections. Scale bars = 500 um Healthy H&E, 1000 um End stage H&E, 2000 um for Healthy and End stage collagen staining. c) Staining for KRT7 and HepPar1 in end stage liver. An example of a double positive cell is indicated (yellow arrow). Scale bars = 20 um. d) Immunohistochemistry staining for K19 on tissue section of the indicated disease stage. In end stage (bottom panels), a cell with hepatocyte morphology expressing low levels of K19 is indicated in the left panel (yellow arrow) and a cell negative for K19 within a duct with hepatocyte morphology is indicated in the right panel (yellow arrow). Scale bars = 50 um (4 upper panels) and 20 um (4 lower panels). n = 3 patient samples from each indicated disease stage in (a-d).
Extended Data Fig. 2
Extended Data Fig. 2. QC showing that snRNAseq protocol generates high quality data.
a) Violin plots summarising the number of UMIs detected per cell (nCount), number of genes per cell (nFeature), proportions of reads incident to ribosomal genes (rp%) and mitochondrial genes (mt%) per patient. b) gradient of ncount, nfeatures, mt%, rp%, all presented on log10 scale displayed on the expression-driven UMAP, for all samples.
Extended Data Fig. 3
Extended Data Fig. 3. snRNAseq captures all liver cell types across disease progression.
a) Proportions of cells, captured per patient, assigned to each cell type. b) Expression UMAPs of cell type markers corresponding to Fig. 1e shown on overall UMAP. c) Heatmap of relative expression of various markers used in the annotation of the cell types. d) Overall UMAP facetted by disease stage. e) Uncorrected overall UMAP show by disease stage. f) Expression UMAPs for cholangiocyte markers KRT7 and BICC1, and hepatocyte marker ABCC2 (MRP2) on overall umap.
Extended Data Fig. 4
Extended Data Fig. 4. Hepatic cell types display different disease signature.
Bubble plot of examples of significantly differential gene expression across disease stages with corresponding UMAPs for a) Stellate cells b) Lymphocytes c) Neutrophils d) Cholangiocytes e) Macrophages f) Endothelial.
Extended Data Fig. 5
Extended Data Fig. 5. Hepatocytes and cholangiocytes are strongly affected by disease progression.
a) GSEA analysis of hepatocytes across disease stages. Examples of significantly enriched terms are shown for each disease stage. Benjamini-Hochberg corrected values shown. b) Statistical analysis corresponding to Fig. 3b. Expression-based correlations for pericentral and periportal genes, compared within groups (pericentral vs pericentral and periportal vs periportal) or between groups (pericentral vs periportal) across disease stages. P-values corresponding to comparisons of distributions for within-group and between-group correlations are indicated. Statistical significance was calculated using two-sided Welch’s t-test. Per disease stage n = 66 pairwise correlations between unique pairs of genes were compared (Pericentral_Pericentral: 15, Pericentral_Periportal: 36, Periportal_Periportal: 15). Mid-point, minimum and maximum of the boxplot summary correspond to the median, first and third quartiles. The extent of the whiskers correspond to the largest/smallest value no further than 1.5*IQR from the inter-quartile range. Points beyond this range are defined as outliers and are plotted individually. c) FLASH imaging of cleared healthy and end-stage liver tissue, with staining for pan-hepatocyte marker GSTA1 and pericentral hepatocyte marker GLUL. In healthy the high magnification (yellow box and right panel) highlights a region of the central vein with a view displayed through the lumen of the vessel. In end-stage the high magnification examines one side of a hepatocyte nodule. See also supplementary videos 1 and 2. Scale bars = 400 um low magnifications and 200 um high magnifications (right panels). d) FLASH imaging of highlighting ductal endings in healthy and end stage samples. Yellow arrows indicate single cell endings in healthy and bulkier endings in end stage samples. Scale bars = 50 um. n = 3 healthy and 3 end stage patient tissue samples (c-d).
Extended Data Fig. 6
Extended Data Fig. 6. snRNAseq confirms cholangiocyte diversity and ductal reaction in late-stage disease.
a-b) Cholangiocyte UMAP with overlaid gradient of expression of large cholangiocyte markers MUC5B and MUC1 c-d) Cholangiocyte UMAP with overlaid gradient of expression cholangiocyte marker CFTR and small cholangiocyte marker BCL2. e) UMAP indicating disease stage of cells. f-g) Cholangiocyte UMAP with overlaid gradient of expression of ductal reaction markers TNFRS12A and NCAM1. h-i) Quantification of the proportion of cholangiocytes expressing ductal reaction markers TNFRS12A and NCAM1 across disease stages. p-values indicated (two-sided Fisher exact test). j) Immunostaining of K7 and NCAM1 in end stage tissue sections. Scale bar = 15 um.
Extended Data Fig. 7
Extended Data Fig. 7. Characterisation of biphenotypic cells suggests an absence of an adult stem or foetal progenitor population.
a) Heatmap of relative expression of large cholangiocyte markers MUC1 and MUC5b and small cholangiocyte marker BCL2 across the indicated cell types. b) Cluster 9 cholangiocytes identified in Fig. 3d plotted as a proportion of cholangiocytes from each disease stage. c) Cluster 5 cholangiocytes identified in Fig. 3d plotted as a proportion of cholangiocytes from each disease stage. d) Cluster 1 cholangiocytes identified in Fig. 3d plotted as a proportion of cholangiocytes from each disease stage. P-values indicated. (Binomial Generalized Linear Mixed- Effects Model (BOBYQA optimiser, maxfun = 2e5) with patient ID as a random effect). e) Violin plots of expression of indicated hepatocyte and cholangiocyte markers comparing the hepatocyte, cholangiocyte and biphenotypic populations. f) Upset plot displaying the number of biphenotypic hepatocytes co-expressing the indicated stem/ progenitor cell genes. g-i) End stage hepatocyte and cholangiocyte UMAP with overlaid gradient of expression for indicated stem cell markers. j) Heatmap of relative expression of senescence markers CDKN2A and CDKN1A in bi- phenotypic hepatocytes across disease progression. k-i) End stage hepatocyte and cholangiocyte UMAP with overlaid gradient of expression for indicated liver progenitor cell markers.
Extended Data Fig. 8
Extended Data Fig. 8. Plasticity markers are expressed in end stage liver.
a) Immunofluorescence staining for HepPar1, K7 and SOX4 (upper panel) K23, K7 and SOX4 (lower panel) in end stage tissue sections. Scale bars = 15 um (lower panel) and 10um (upper panel). b) Immunofluorescence staining for HepPar1 and K23 in end stage tissue sections. Scale bar = 15 um. c) Immunofluorescence staining for ALB, K19 and NCAM1 in healthy and end stage tissue sections. Yellow box indicates the region shown in higher magnification. Scale bars = 50 um upper 2 panels and 10 um lower 2 panels. d) Immunofluorescence staining for HepPar1 and K23 in end stage tissue sections. Scale bar = 20 um. e) Immunofluorescence staining for ALB, K19 and KLF6 in healthy and end stage tissue sections. Scale bars = 30 um upper 2 panels and 10 um lower panel. n = 3 healthy and 3 end stage patient tissue samples (a-e). f) Upset plot displaying the number of biphenotypic hepatocytes co-expressing the indicated plasticity and proliferative genes.
Extended Data Fig. 9
Extended Data Fig. 9. Intrahepatic cholangiocyte organoids (ICOs) differentiation provides a model to study cellular plasticity.
a) GSEA analysis of cholangiocyte-like-hepatocytes and hepatocyte-like-cholangiocytes from in vivo data (Fig. 3) combined. Top significantly enriched terms are shown. b) qPCR of hepatocyte marker expression in uICOs and dICOs derived from cirrhotic (end stage) livers or healthy donor livers. n = 17 biologically independent experiments for cirrhosis and n = 6 for healthy. Errors bars indicate mean with SD. c) qPCR of KLF6, SOX4 and SERPINE1, which were identified in Fig. 3k as markers of biphenotypic cells, in uICOs and dICOs. n = 10 biologically independent experiments. P-values indicated, two-tailed unpaired t-test. Errors bars indicate SEM). d) qPCR for hepatocyte markers dICOs treated with either DMSO, MK2206 (AKT inhibitor) or rapamycin (mTOR inhibitor) for indicated time. Untreated uICOs included as a control. For CYP3A4 expression n = 6 biologically independent experiments for DMSO, 5 for MK TP1, 4 for MK TP2 and TP3, RAPA TP1 and TP2, 3 for RAPA TP3, 5 for EM control. For ALB expression n = 6 biologically independent experiments for DMSO, 4 for MK TP1 and TP3, 3 for MK TP3, 5 for RAPA TP1, 4 for RAPA TP2, 3 for RAPA TP3, 6 for EM control. P-values are indicated, ordinary one-way ANOVA adjusted for multiple comparisons. Error bars indicate mean with SE. e) Serum insulin levels of patients diagnosed from different MASLD stages. n = 7 biologically independent patients (control), 19 (MASLD), 63 (MASH), 9 (cirrhosis), 3 (end stage). P-values indicated, ordinary one-way ANOVA adjusted for multiple comparisons. Errors bars indicate mean with SD.
Extended Data Fig. 10
Extended Data Fig. 10. Extracellular matrix composition alters ICOs branching and differentiation.
a-d) qPCR for hepatocyte and cholangiocyte marker expression in dICOs treated with wither vehicle or indicated treatment for the duration of the differentiation. n = 3 biologically independent experiments, P-values are indicated unpaired t-test. Errors bars indicate mean with SD. e) Heatmap showing relative expression of YAP signalling genes across disease stages in hepatocytes and cholangiocytes combined. f) Examples of dICOs differentiated in a mixture of 50:50 collagen I: Matrigel (lower 2 panels). Immunofluorescence staining for ALB and K19. White box indicates region shown in high magnification (lower panel). uICOs grown in 100% Matrigel included as a control (upper panel). n = 3 patient organoid lines. Scale bars = 100 um upper, 200 um middle and 150 um lower panel. Source Data

Similar articles

Cited by

References

    1. Raven A, et al. Cholangiocytes act as facultative liver stem cells during impaired hepatocyte regeneration. Nature. 2017;547:350–354. doi: 10.1038/nature23015. - DOI - PMC - PubMed
    1. Clayton E, et al. A single type of progenitor cell maintains normal epidermis. Nature. 2007;446:185–189. doi: 10.1038/nature05574. - DOI - PubMed
    1. Wang B, Zhao L, Fish M, Logan CY, Nusse R. Self-renewing diploid Axin2+ cells fuel homeostatic renewal of the liver. Nature. 2015;524:180–185. doi: 10.1038/nature14863. - DOI - PMC - PubMed
    1. Barker N, et al. Identification of stem cells in small intestine and colon by marker gene Lgr5. Nature. 2007;449:1003–1007. doi: 10.1038/nature06196. - DOI - PubMed
    1. Ben-Moshe S, et al. The spatiotemporal program of zonal liver regeneration following acute injury. Cell Stem Cell. 2022;29:973–989. doi: 10.1016/j.stem.2022.04.008. - DOI - PubMed

MeSH terms