. 2024 May 22;19(5):e0303945.
doi: 10.1371/journal.pone.0303945. eCollection 2024.

KLRG1-expressing CD8+ T cells are exhausted and polyfunctional in patients with chronic hepatitis B

Affiliations

KLRG1-expressing CD8+ T cells are exhausted and polyfunctional in patients with chronic hepatitis B

Li Wang et al. PLoS One. .

Abstract

Killer cell lectin-like receptor G1 (KLRG1) has traditionally been regarded as an inhibitory receptor of T cell exhaustion in chronic infection and inflammation. However, its exact role in hepatitis B virus (HBV) infection remains elusive. CD8+ T cells from 190 patients with chronic hepatitis B were analyzed ex vivo for checkpoint and apoptosis markers, transcription factors, cytokines and subtypes in 190 patients with chronic hepatitis B. KLRG1+ and KLRG1- CD8+ T cells were sorted for transcriptome analysis. The impact of the KLRG1-E-cadherin pathway on the suppression of HBV replication mediated by virus-specific T cells was validated in vitro. As expected, HBV-specific CD8+ T cells expressed higher levels of KLRG1 and showed an exhausted molecular phenotype and function. However, despite being enriched for the inhibitory molecules, thymocyte selection-associated high mobility group box protein (TOX), eomesodermin (EOMES), and Helios, CD8+ T cells expressing KLRG1 produced significant levels of tumour necrosis factor (TNF)-α, interferon (IFN)-γ, perforin, and granzyme B, demonstrating not exhausted but active function. Consistent with the in vitro phenotypic assay results, RNA sequencing (RNA-seq) data showed that signature effector T cell and exhausted T cell genes were enriched in KLRG1+ CD8+ T cells. Furthermore, in vitro testing confirmed that KLRG1-E-cadherin binding inhibits the antiviral efficacy of HBV-specific CD8+ T cells. Based on these findings, we concluded that KLRG1+ CD8+ T cells are not only a terminally exhausted subgroup but also exhibit functional diversity, despite inhibitory signs in HBV infection.


Conflict of interest statement

The authors have declared that no competing interests exist.

Figures
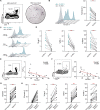
Fig 1
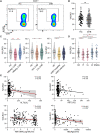
Fig 1. KLRG1 expression was linked to HBV-specific CD8+ T cell exhaustion in chronic HBV infection.
(A) Representative plots of HBc18−27-specific CD8+ T cells and HBcAg-specific CD8+ T cells. (BD) Representative flow cytometric histograms and expression of annexin V and inhibitory molecules (Lag-3, PD-1, and TIM-3) in KLRG1+ versus KLRG1− HBc18−27-specific CD8+ T cell populations. ***p < 0.001, **p < 0.01, paired Student’s t-test. (EF) Representative dot plots of cytokines (TNF-α and IFN-γ) production and their correlation with KLRG1 expression. **p < 0.01, *p < 0.05, Pearson R correlation. (G) Expression of KLRG1 in HBV-specific CD8+ T cells versus non-specific CD8+ T cells. ***p < 0.001, paired Student’s t-test. (H) Expression of Annexin V and inhibitory molecules (Lag-3, PD-1, and TIM-3) in KLRG1+ HBV-specific CD8+ T cells versus KLRG1+ non-specific CD8+ T cells. ***p < 0.001, paired Student’s t-test.
Fig 2
Fig 2. KLRG1 expression in CD8+ T cells was associated with different phases of chronic HBV infection.
(A) Representative flow cytometric plots showing the data from one healthy control (HC) and one chronic hepatitis B (CHB) patient. The plots show the frequency of peripheral blood CD8+ T cells based on the surface expression of KLRG-1. (B) KLRG1 expression in CD8+ T cells from HCs and CHB patients. Data are shown as median values with IQRs. ns, not significant (p > 0.05), Wilcoxon test. (C) KLRG1 expression in CD8+ T cells according to a single indicator: HBeAg, HBV DNA, or ALT. Data are shown as median values with IQRs. ***p < 0.001, *p < 0.05, Kruskal−Wallis test with Dunnett’s multiple comparison test. (D) Analysis of KLRG1 expression in CD8+ T cells obtained from HCs and patients with different phases of CHB. Data are shown as median values with IQRs. **p < 0.01, *p < 0.05, Kruskal−Wallis test with Dunnett’s multiple comparison test (E) Correlation analysis of serum ALT, AST, HBV DNA, and HBsAg and the frequency of KLRG1-expressing CD8+ T cells from the CHB patients are depicted, respectively. **p < 0.01, *p < 0.05, Pearson R correlation.
Fig 3
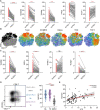
Fig 3. KLRG1-expressing CD8+ T cells exhibited a phenotypic profile of T cell exhaustion.
(A) Differential expression of the transcription factors T-bet, EOMES, Helios, TOX, and TCF-1 in KLRG1+ and KLRG1− CD8+ T cells. ****p < 0.0001, paired Student’s t-test. (B) t-SNE representation analysis of concatenated flow cytometry data obtained from KLRG1+ and KLRG1− CD8+ T cells. Expression levels of T-bet, EOMES, Helios, TOX, and TCF-1 are plotted on the t-SNE plot. (C) The expression of membrane surface molecules (CD69, PD-1, TIM-3, and Lag-3) in KLRG1+ and KLRG1− CD8+ T cell was assessed. Representative flow cytometric histograms are shown that include the gating of the individual markers. ns, not significance (p > 0.05), ****p < 0.0001, paired Student’s t-test. (D) KLRG1 expression was determined in subsets of CD8+ T cells based on CD127 and PD-1 expression using flow cytometry. Representative flow density plots are shown. NMNE, CD127+ PD-1− non-memory non-exhausted T cells; ML, CD127+ PD-1+ memory like T cells; TE, CD127− PD-1+ terminally exhausted T cells. Data are shown as median values with IQRs. ****p < 0.0001, Kruskal−Wallis test with Dunnett’s multiple comparison test. (E) Correlation analysis of the frequency of the CD127/PD-1 subsets and the frequency of KLRG1-expressing CD8+ T cells from the CHB patients. Each dot represents one CD8+ T cell population. ***p < 0.001, Pearson R correlation. t-SNE, t-distributed stochastic neighbor embedding.
Fig 4
Fig 4. KLRG1 expression induced strong cytotoxic activity via increased release of proinflammatory cytokines in chronic HBV infection.
(A) Expression of TNF-α, IFN-γ, IL-2, perforin, and granzyme B in KLRG1+ and KLRG1− CD8+ T cell populations from all the CHB patients. Representative flow cytometric histograms, with gating of the individual markers, are displayed. (B) Expression of TNF (i.e., TNF-α), IFNG (i.e., IFN-γ), IL2 (i.e., IL-2), PRF1 (i.e., perforin), GZMB (i.e., granzyme B) was assessed in KLRG1+ and KLRG1− CD8+ T cells at the mRNA level. (C) Expression of TNF-α, IFN-γ, IL-2, perforin, and granzyme B in KLRG1+ and KLRG1− CD8+ T cells from patients classified with HBeAg+ CHB, HBeAg+ cHBV, HBeAg− cHBV, and HBeAg− CHB. ns (p > 0.05), not significance, **p < 0.01, *p <0.05, ****p <0.0001, paired Student’s t-test.
Fig 5
Fig 5. Elevated expression of KLRG1 prompted the acquisition of effector and memory functions in CD8+ T cells.
(A) CD45RA/CCR7 expression was determined during four phases of CHB. A representative flow cytometry contour plot is shown. Teff, CD45RA+ CCR7− cells; Tn, CD45RA+ CCR7+ Tn cells; TEM, CD45RA− CCR7− cells; and TCM, CD45RA− CCR7+ cells. Data are shown as median values with IQRs. *p < 0.05, Kruskal−Wallis test with Dunnett’s multiple comparison test. (B) Alteration of ML cells in different stages of hepatitis B infection. Data are shown as median values with IQRs. *p < 0.05, Kruskal−Wallis test with Dunnett’s multiple comparison test. (C) CD127/KLRG1 expression was detected during four phases of CHB. A representative flow cytometry contour plot is shown. MPEC, CD127+ KLRG1− cells; DPEC, CD127+ KLRG1+ cells; and SLEC, CD127− KLRG1+ cells. Data are shown as median values with IQRs. *p < 0.05, Kruskal−Wallis test with Dunnett’s multiple comparison test. (D) Data from one patient was used to produce the representative histogram, and data from 78 CHB patients was used to produce the second plot. The results showed elevated expression of KLRG1 in the TCM, TEM, and Teff subsets compared to the Tn subset. ****p < 0.0001, paired Student’s t-test. (E) Correlation analysis of the frequency of CD127/PD-1 or CD45RA/CCR7 CD8+ T cell subsets and the frequency of KLRG1-expressing CD8+ T cells obtained from all the CHB patients. Each dot represents one CD8+ T cell population. ****p < 0.0001, Pearson R correlation.
Fig 6
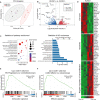
Fig 6. KLRG1+ CD8+ T cells from CHB patients exhibited a distinctive transcriptional profile.
Whole-transcriptome sequencing and analysis were performed using sorted KLRG1+ and KLRG1− CD8+ T cells from four strictly paired CHB patients. (A) Principal component analysis (PCA) of transcriptomic data (KLRG1 + = 4, KLRG1 − = 4). (B) Volcano plot (log10 P-values vs. log2 fold changes in expression) of transcripts differentially expressed in KLRG1+ CD8+ T cells and KLRG1− CD8+ T cells. sig, significant. (C) Gene Ontology (GO) and Kyoto Encyclopedia of Genes and Genomes (KEGG) analyses of the 1,947 differentially expressed genes (DEGs). (D) Heat map of genes representing apoptosis, cell cycle processes, and negative regulation of proliferation. (E) Enrichment of a previously published gene signature of CD8+ T cell exhaustion (described in ref. (36)) was assessed in KLRG1+ and KLRG1− CD8+ T cells from CHB patients by gene set enrichment analysis (GSEA). (F) Enrichment of a previously published gene signature of effector CD8+ T cells (described in ref. (37)) was assessed in KLRG1+ and KLRG1− CD8+ T cells from CHB patients by GSEA. NES, normalized enrichment score.
Fig 7
Fig 7. The combination of sE-cadherin and KLRG1 antagonized the inhibitory effect of KLRG1+ CD8+ T cells on HBV replication.
E-cadherin expression was higher in HepG2.2.15 cells than in HepG2 cells, as shown by the Western blotting (A) and immunofluorescence (B) results. (C) The representative histogram was produced using data from eight CHB patients. The results showed reduced IFN-γ secretion by global CD8+ T cells in the presence of sE-cadherin. *p < 0.05, paired Student’s t-test. (D) Effect of using siRNA to knockdown E-cadherin in HepG2.2.15 cells. Reduction in level of HBV core protein (E), HBV DNA in supernatant (F), and HBV DNA copies/cells (G) in HepG2.2.15 cells after co-culture with HBc18−27-stimulated PBMCs. Data are shown as mean ± SD, **p < 0.01, *p < 0.05, unpaired Student’s t-test.

Similar articles

References

    1. Fung S, Choi HSJ, Gehring A, Janssen HLA. Getting to HBV cure: The promising paths forward. Hepatology. 2022;76(1):233–50. doi: 10.1002/hep.32314 - DOI - PubMed
    1. Tsai KN, Kuo CF, Ou JJ. Mechanisms of Hepatitis B Virus Persistence. Trends Microbiol. 2018;26(1):33–42. doi: 10.1016/j.tim.2017.07.006 - DOI - PMC - PubMed
    1. Fanning GC, Zoulim F, Hou J, Bertoletti A. Therapeutic strategies for hepatitis B virus infection: towards a cure. Nat Rev Drug Discov. 2019;18(11):827–44. doi: 10.1038/s41573-019-0037-0 - DOI - PubMed
    1. Wong GLH, Gane E, Lok ASF. How to achieve functional cure of HBV: Stopping NUCs, adding interferon or new drug development? J Hepatol. 2022;76(6):1249–62. doi: 10.1016/j.jhep.2021.11.024 - DOI - PubMed
    1. Bertoletti A, Ferrari C. Adaptive immunity in HBV infection. J Hepatol. 2016;64(1 Suppl):S71–S83. doi: 10.1016/j.jhep.2016.01.026 - DOI - PubMed

Grants and funding

WXC received National Natural Science Foundation of China (81672080, 81873971).