. 2024 May;14(5):e1686.
doi: 10.1002/ctm2.1686.

Rictor/mTORC2 signalling contributes to renal vascular endothelial-to-mesenchymal transition and renal allograft interstitial fibrosis by regulating BNIP3-mediated mitophagy

Affiliations

Rictor/mTORC2 signalling contributes to renal vascular endothelial-to-mesenchymal transition and renal allograft interstitial fibrosis by regulating BNIP3-mediated mitophagy

Dengyuan Feng et al. Clin Transl Med. 2024 May.

Abstract

Background: Renal allograft interstitial fibrosis/tubular atrophy (IF/TA) constitutes the principal histopathological characteristic of chronic allograft dysfunction (CAD) in kidney-transplanted patients. While renal vascular endothelial-mesenchymal transition (EndMT) has been verified as an important contributing factor to IF/TA in CAD patients, its underlying mechanisms remain obscure. Through single-cell transcriptomic analysis, we identified Rictor as a potential pivotal mediator for EndMT. This investigation sought to elucidate the role of Rictor/mTORC2 signalling in the pathogenesis of renal allograft interstitial fibrosis and the associated mechanisms.

Methods: The influence of the Rictor/mTOR2 pathway on renal vascular EndMT and renal allograft fibrosis was investigated by cell experiments and Rictor depletion in renal allogeneic transplantation mice models. Subsequently, a series of assays were conducted to explore the underlying mechanisms of the enhanced mitophagy and the ameliorated EndMT resulting from Rictor knockout.

Results: Our findings revealed a significant activation of the Rictor/mTORC2 signalling in CAD patients and allogeneic kidney transplanted mice. The suppression of Rictor/mTORC2 signalling alleviated TNFα-induced EndMT in HUVECs. Moreover, Rictor knockout in endothelial cells remarkably ameliorated renal vascular EndMT and allograft interstitial fibrosis in allogeneic kidney transplanted mice. Mechanistically, Rictor knockout resulted in an augmented BNIP3-mediated mitophagy in endothelial cells. Furthermore, Rictor/mTORC2 facilitated the MARCH5-mediated degradation of BNIP3 at the K130 site through K48-linked ubiquitination, thereby regulating mitophagy activity. Subsequent experiments also demonstrated that BNIP3 knockdown nearly reversed the enhanced mitophagy and mitigated EndMT and allograft interstitial fibrosis induced by Rictor knockout.

Conclusions: Consequently, our study underscores Rictor/mTORC2 signalling as a critical mediator of renal vascular EndMT and allograft interstitial fibrosis progression, exerting its impact through regulating BNIP3-mediated mitophagy. This insight unveils a potential therapeutic target for mitigating renal allograft interstitial fibrosis.

Keywords: Rictor/mTORC2; mitophagy; renal allograft interstitial fibrosis; vascular endothelial cells.


Conflict of interest statement

The authors declare no conflict of interest.

Figures
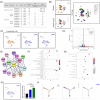
FIGURE 1
FIGURE 1
The upregulation of Rictor in allogeneic renal vascular endothelial cells of CAD patients was unveiled through single‐cell transcriptomic analysis. (A) The information on patients and renal tissues for single‐cell RNA sequencing, including healthy adult kidney tissue samples from three individuals (native group), normal renal allograft tissues from three stable renal transplanted patients (normal allograft group), and fibrotic renal allograft tissues from six CAD patients (fibrotic allograft group). (B) Uniform manifold approximation and projection (UMAP) visualization of cell subclusters from three groups. Different cell subclusters are differently color‐coded. (C) UMAP shows the expressions of classical markers for endothelial cells (PECAM1 and CD34). (D) Volcano plot showing the differential expressed genes (DEGs) in endothelial cells between the native and fibrotic allograft groups, with 1771 upregulated genes and 1008 downregulated genes. (E) Graphical visualization of hub genes and their protein–protein interaction analysis. (F, G) Gene ontology (GO) analysis (F) and Kyoto Encyclopedia of Genes and Genomes (KEGG) analysis (G) of DEGs in endothelial cells between the native and fibrotic allograft group. (H) UMAP shows the scaled expression of Rictor in endothelial cells. (I) Pseudotime analysis showing dynamic changes of Rictor expression in endothelial cells from kidneys in three groups.
FIGURE 2
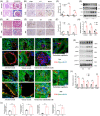
FIGURE 2
Rictor/mTORC2 signalling is activated in renal vascular endothelial cells from CAD patients and renal allogeneic transplanted mice. (A) Representative images of HE and Masson staining in renal allograft tissues from normal and CAD patients. (B, C) Representative IHC images (B) and statistical graphs of semi‐quantitative analyses (C) of CD31, FN, and Rictor expression in renal allograft tissues from the normal and CAD patients. (n = 4; bar = 20 μm). (D) Representative images of HE and Masson staining in transplanted kidney tissues from the Syn and Allo groups. (E, F) Representative IHC images (E) and statistical graphs of semi‐quantitative analyses(F) of CD31, FN, and αSMA expression in transplanted kidney tissues from the Syn and Allo groups. (n = 3; bar = 20 μm). (G, H) The results of western blot analyses (G) and quantitative analyses of the relative abundance (H) of CD31, Collagen I, and αSMA expression in transplanted kidney tissues from the Syn (n = 3) and Allo (n = 3) groups. (I) Representative images of colocalization of CD31 and Rictor (White arrows) in transplanted kidney tissues from the Syn and Allo groups by indirect immunofluorescence double staining (n = 3, bar = 20 μm). (J) Result of semi‐quantitative analysis of Rictor expression in transplanted kidney tissues from the Syn and Allo groups by indirect immunofluorescence staining. (K, L) The results of western blot analyses (K) and quantitative analyses of the relative abundance (L) of Rictor, p‐PKCα, p‐SGK1, p‐AktThr308, and p‐AktSer473 expression in transplanted kidney tissues from the Syn (n = 3) and Allo (n = 3) groups. *p < 0.05, **p < 0.01, ***p < 0.001.
FIGURE 3
FIGURE 3
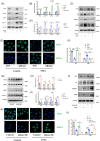
Effects of changes of Rictor/mTORC2 signalling activity to EndMT induced by TNFα in HUVECs. HUVECs were transfected with siNC or siRictor for 24 h. After transfection, part of HUVECs were treated with 100 ng/mL; TNFα for 48 h. (A, B) The results of western blot analyses (A) and quantitative analyses of the relative abundance (B) of Rictor, p‐PKCα, p‐SGK1, p‐AktThr308, and p‐AktSer473 expression in HUVECs transfected with siNC or siRictor. (C, D) The results of western blot analyses (C) and quantitative analyses of the relative abundance (D) of CD31, FN, Collagen I, and αSMA expression in HUVECs treated by TNFα or not after transfected with siNC or siRictor. (E, F) Representative images (E) and statistical graphs of semi‐quantitative analyses (F) for IF staining of CD31 and αSMA expression in HUVECs treated by TNFα or not after transfected with siNC or siRictor (bar = 20 μm). HUVECs were transfected with control or Rictor plasmids for 24 h. After transfection, HUVECs were treated with 100 ng/mL TNFα for 48 h. (G, H) The results of western blot analyses (G) and quantitative analyses of the relative abundance (H) of Rictor, p‐PKCα, p‐SGK1, and p‐AktSer473 expression in HUVECs transfected with control or Rictor plasmids. (I, J) The results of western blot analyses (I) and quantitative analyses of the relative abundance (J) of CD31, FN, Collagen I, and αSMA expression in HUVECs treated by TNFα or not after transfected with control or Rictor plasmids. (K, L) Representative images (K) and statistical graphs of semi‐quantitative analyses (L) for IF staining of CD31 and αSMA expression in HUVECs treated by TNFα or not after transfected with control or Rictor plasmids (bar = 20 μm). *p < 0.05, **p < 0.01, ***p < 0.001.
FIGURE 4
FIGURE 4
Knockout of Rictor gene can activate mitophagy and enhance mitophagy induced by TNFα in BNIP3‐dependent manner in HUVECs. Stable Rictor gene knockout (KO) of the HUVEC line was generated using CRISPR/Cas9‐mediated gene editing. (A, B) The results of western blot analyses (A) and quantitative analyses of the relative abundance (B) of Rictor, p‐PKCα, p‐SGK1, and p‐AktSer473 expression in the control and Rictor KO HUVECs under TNFα treatment. (C) KEGG pathway analysis of differentially expressed genes from the RNA‐seq assay in the control and Rictor KO HUVECs. (D) Representative images of colocalization of mitochondrial marker (MitoTracker) and LC3 expression in HUVECs from the control and Rictor KO group by IF double staining. (n = 6; bar = 5 μm). € Result of semi‐quantitative analysis of LC3 expression in HUVECs from the control and Rictor KO group by IF staining. (n = 6; bar = 5 μm). (F, G) Representative TEM images (F) and statistical graph of quantitative analysis (G) of mitophagosomes in the control and Rictor KO HUVECs (bar = 1 μm). (Green arrowheads: normal mitochondria; yellow arrowhead: autophagosome; red arrowhead: mitophagosome). (H, I) The results of western blot analyses (H) and quantitative analyses of the relative abundance (I) of VDAC1, TIM23, and LC3 expression in the control and Rictor KO HUVECs treated by 100 ng/mL TNFα or not for 48 h. (J, K) The results of western blot analyses (J) and quantitative analyses of the relative abundance (K) of PINK1, NIX, FUNDC1, and BNIP3 expression in the control and Rictor KO HUVECs treated by 100 ng/mL TNFα or not for 48 h. (L, M) The results of western blotting analysis (L) and quantitative analysis of the relative abundance (M) of BNIP3 expression in the mitochondrial and cytosolic fractions of HUVECs from the control and Rictor KO group. (N–Q) Representative images and statistical graphs of semi‐quantitative analyses of IF double staining‐labeling MitoTracker and BNIP3, LC3, and BNIP3. (n = 6, bar = 5 μm). Data were presented as mean ± SEM. *p < 0.05, **p < 0.01, ***p < 0.001.
FIGURE 5
FIGURE 5
Changes in mitophagy activity and BINP3 expression can influence TNFα‐induced EndMT in HUVECs. HUVECs were pretreated with 20 μM CCCP or control solvent for 2 h and then treated with 100 ng/mL TNFα or control solvent for 24 h. (A, B) The results of western blot analyses (A) and quantitative analyses of the relative abundance (B) of CD31, Collagen I, and αSMA expression in different groups. HUVECs were pretreated with 10 μM Mdivi‐1 or control solvent for 24 h and then treated with 100 ng/mL TNFα or control solvent for 24 h. (C, D) The results of western blot analyses (C) and quantitative analyses of the relative abundance (D) of CD31, Collagen I, and αSMA expression in different groups. HUVECs from the control and Rictor KO groups were transfected with control or BNIP3 siRNA and then treated with 100 ng/mL TNFα for 24 h. (E, F) The results of western blot analysis (E) and quantitative analyses of the relative abundance (F) of BNIP3, TOMM20, and LC3 expression in different groups. (G, H) The results of western blot analysis (G) and quantitative analyses of the relative abundance (H) of CD31, FN, and Collagen I expression in different groups. Data were presented as mean ± SEM. *p < 0.05, **p < 0.01, ***p < 0.001.
FIGURE 6
FIGURE 6
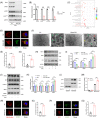
Rictor promotes the proteasome‐dependent degradation of BNIP3 at the K130 site through K48‐linked ubiquitination. (A) RT‐PCR analysis results of BNIP3 mRNA expression in the control and Rictor KO HUVECs. (B, C) The results of cycloheximide (CHX) chase assay for BNIP3 expression in the control and Rictor KO HUVECs treated with CHX (200 μg/mL) for the indicated time points. (D, E) The results of western blot analysis (D) and quantitative analysis of the relative abundance (E) of BNIP3 in the control and Rictor KO HUVECs treated with 10 μM CQ for 24 h. (F, G) The results of western blot analysis (F) and quantitative analysis of the relative abundance (G) of BNIP3 in the control and Rictor KO HUVECs treated with 10 μM MG132 for 6 h. (H) The results of co‐immunoprecipitation assay for the ubiquitination of BNIP3 in the control and Rictor KO HUVECs treated by MG132. (I) The results of co‐immunoprecipitation assay for the ubiquitination of BNIP3 in the control and Rictor overexpression HUVECs treated by MG132. (J) The results of co‐immunoprecipitation assays for the ubiquitination of BNIP3 in the control and Rictor KO HUVECs treated by MG132 after transfection with WT‐BNIP3, K63‐linked BNIP3, or K48‐linked BNIP3 plasmids for 48 h. (K) The results of co‐immunoprecipitation assay for the ubiquitination of BNIP3 in the control and Rictor overexpression HUVECs treated by MG132 after transfection with WT‐BNIP3, K63R‐linked BNIP3, or K48R‐linked BNIP3 plasmids for 48 h. (L) The predictive result of BNIP3 ubiquitination site by using CKSAAP_UbSite. (M) The results of co‐immunoprecipitation assay for the ubiquitination of BNIP3 in HUVECs transfected with Myc‐ubiquitin and different mutant BNIP3 plasmids. (N, O) The results of western blot analysis (N) and quantitative analysis of the relative abundance (O) of Rictor and BNIP3 expression in the control and Rictor overexpression HUVECs transfected with either WT BNIP3 or K130R BNIP3 plasmids. Data were presented as mean ± SEM. *p < 0.05, ***p < 0.001.
FIGURE 7
FIGURE 7
MARCH5 is the E3 ubiquitin ligase that specifically regulates the proteasome‐dependent degradation of BNIP3 mediated by the Rictor/mTORC2 signalling pathway. (A) The predictive result of the E3 ubiquitin ligases interacting with BNIP3 by using the UbiBrowser platform. (B, C) The results of western blot analyses (B) and quantitative analyses of the relative abundance (C) of MARCH5 expression in the control and Rictor KO HUVECs. (D) Co‐immunoprecipitation assay was performed to detect the association between BNIP3 and MARCH5. (E, F) The results of CHX chase assays for BNIP3 expression in HUVECs (transfected with control or MARCH5 siRNAs) treated with CHX (200 μg/mL) for the indicated time points. (G, H) The results of western blot analyses (G) and quantitative analyses of the relative abundance (H) of BNIP3 in siNC or siMARCH5 transfected HUVECs treated with 10 μM CQ for 24 h or 10 μM MG132 for 6 h. (I) The results of co‐immunoprecipitation assays for the ubiquitination of BNIP3 in the siNC or siMARCH5 transfected HUVECs treated by MG132. (J) After transfection of HUVECs with the indicated plasmids for 48 h, co‐immunoprecipitation assay for the ubiquitination of BNIP3 with the indicated antibodies was performed. (K) Co‐immunoprecipitation assay for the ubiquitination of HA‐BNIP3 was performed in HUVECs transfected with the indicated plasmids. (L) After transfection of control or MRACH5 siRNA in the control or Rictor overexpression HUVEECs, co‐immunoprecipitation assay for the ubiquitination of BNIP3 was performed with the indicated antibodies. Data were presented as mean ± SEM. *p < 0.05, **p < 0.01, ***p < 0.001.
FIGURE 8
FIGURE 8
Ablation of Rictor gene in endothelial cells alleviates EndMT and renal allograft interstitial fibrosis in renal allogeneic transplanted mice. (A) The diagram illustrates the strategy for generating mice with a specific deletion of Rictor gene in endothelial cells. (B) Representative PCR results of genotyping the mice by PCR analysis of genomic DNA. Lane 1: Rictor wt/wt, Tie2‐ Cre+/− ; Lane 2: Rictor fl/fl, Tie2‐ Cre−/− ; Rictor fl/wt, Tie2‐ Cre+/− ; Rictor fl/fl, Tie2‐ Cre+/− . (C) The schematic diagram for the surgery procedure of mice renal allogeneic transplantation model for the WT Allo and Rictor−/− Allo groups. (D) Representative IF double staining images of colocalization of CD31 and Rictor (White arrows) in transplanted kidney tissues from the WT Allo and Rictor−/− Allo groups (bar = 10 μm). (E, F) The results of western blot analyses (D) and quantitative analyses of the relative abundance (E) of Rictor, p‐PKCα, p‐SGK1, p‐AktThr308, and p‐AktSer473 expression in the WT Allo and Rictor−/− Allo groups. (G) Representative images of HE and Masson staining in renal allograft tissues from the WT Allo and Rictor−/− Allo groups. (H, I) The results of western blot analyses (H) and quantitative analyses of the relative abundance (I) of CD31, Collagen I, and αSMA expression in transplanted kidney tissues from the WT Allo and Rictor−/− Allo groups. (J, K) Representative IHC images (I) and statistical graphs of semi‐quantitative analyses (J) of CD31, FN, and αSMA expression in transplanted kidney tissues from the WT Allo and Rictor−/− Allo groups. (n = 3, bar = 20 μm). Data were presented as mean ± SEM. *p < 0.05, **p < 0.01, ***p < 0.001.
FIGURE 9
FIGURE 9
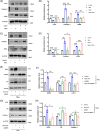
Rictor gene ablation activates BNIP3‐mediated mitophagy in renal allogeneic transplanted mice. (A–D) The results of western blot analyses (A, C) and quantitative analyses of the relative abundance (B, D) of TOMM20, LC3, MARCH5, and BNIP3 expression in transplanted kidney tissues from the WT Allo and Rictor−/− Allo groups. (E, G) Representative images of IF double staining‐labeling CD31 and LC3 (E) (White arrows), CD31 and BNIP3 (G) (White arrows) in transplanted kidney tissues from the WT Allo and Rictor−/− Allo groups. (F, H) Statistical graphs of IF staining semi‐quantitative analyses of LC3 (F) and BNIP3 (H) expression in transplanted kidney tissues from the WT Allo and Rictor−/− Allo groups. (n = 3; bar = 10 μm). Data were presented as mean ± SEM. *p < 0.05, **p < 0.01, ***p < 0.001.
FIGURE 10
FIGURE 10
Downregulation of BNIP3 expression reverses mitophagy activation, alleviated EndMT and renal allograft interstitial fibrosis caused by Rictor gene ablation in renal allogeneic transplanted mice. Mice from the WT Allo and Rictor−/− Allo groups were injected with adeno‐associated virus (AAV) encoding PHB2 shRNA (AAV‐shBNIP3) or negative control AAV (AAV‐shNC) by tail veins at the third week after kidney transplantation. Transplanted kidney tissues were used for further analyses. (A, B) The results of western blot analysis (A) and quantitative analyses of the relative abundance (B) of BNIP3 and LC3 expression in the transplanted kidney tissues from the WT Allo and Rictor−/− Allo groups injected with AAV‐shBNIP3 or AAV‐shNC. (C) Representative images of IF double staining‐labeling CD31 and BNIP3 (White arrows), CD31 and LC3 (White arrows) in the transplanted kidney tissues from the WT Allo and Rictor−/− Allo groups injected with AAV‐shBNIP3 or AAV‐shNC. (n = 3; bar = 10 μm). (D) Statistical graphs of IF staining semi‐quantitative analyses of LC3 and BNIP3 expression in the transplanted kidney tissues from four groups. (E, F) The results of western blot analysis (E) and quantitative analyses of the relative abundance (F) of CD31, FN, and αSMA expression in the transplanted kidney tissues from four groups. (G) Representative images of HE and Masson staining in transplanted kidney tissues from four groups. (H) The results of semi‐quantitative analyses of fibrosis positive area by Masson's staining in different groups. (I, J) Representative IHC images (I) and statistical graphs of semi‐quantitative analyses (J) of CD31 and FN expression in transplanted kidney tissues from four groups. Data were presented as mean ± SEM. *p < 0.05, **p < 0.01, ***p < 0.001.
FIGURE 11
FIGURE 11
The Rictor/mTORC2 signalling pathway inhibits BNIP3‐mediated mitophagy and subsequently promotes renal vascular EndMT and renal allograft interstitial fibrosis by regulating ubiquitin‐proteasome‐depended degradation of BNIP3 (by Figdraw). Activation of the Rictor/mTORC2 signalling pathway promotes the ubiquitin‐proteasome‐depended degradation of BNIP3, thus hindering BNIP3‐mediated mitophagy, ultimately leading to the development of renal vascular EndMT and renal allograft interstitial fibrosis.

Similar articles

References

    1. Voora S, Adey DB. Management of kidney transplant recipients by general nephrologists: core Curriculum 2019. Am J Kidney Dis.. 2019;73(6):866‐879. - PubMed
    1. Davis S, Mohan S. Managing patients with failing kidney allograft: many questions remain. Clin J Am Soc Nephrol. 2022;17(3):444‐451. - PMC - PubMed
    1. McDaniels JM, Shetty AC, Kuscu C, et al. Single nuclei transcriptomics delineates complex immune and kidney cell interactions contributing to kidney allograft fibrosis. Kidney Int. 2023;103(6):1077‐1092. - PMC - PubMed
    1. Yang C, Qi R, Yang B. Pathogenesis of chronic allograft dysfunction progress to renal fibrosis. Adv Exp Med Biol. 2019;1165:101‐116. - PubMed
    1. Granata S, Benedetti C, Gambaro G, et al. Kidney allograft fibrosis: what we learned from latest translational research studies. J Nephrol. 2020;33(6):1201‐1211. - PubMed

MeSH terms