[Preprint]. 2024 Jun 20:2023.10.15.562437.
doi: 10.1101/2023.10.15.562437.

The guide RNA sequence dictates the slicing kinetics and conformational dynamics of the Argonaute silencing complex

Affiliations

The guide RNA sequence dictates the slicing kinetics and conformational dynamics of the Argonaute silencing complex

Peter Y Wang et al. bioRxiv. .

Update in

Abstract

The RNA-induced silencing complex (RISC), which powers RNA interference (RNAi), consists of a guide RNA and an Argonaute protein that slices target RNAs complementary to the guide. We find that for different guide-RNA sequences, slicing rates of perfectly complementary, bound targets can be surprisingly different (>250-fold range), and that faster slicing confers better knockdown in cells. Nucleotide sequence identities at guide-RNA positions 7, 10, and 17 underlie much of this variation in slicing rates. Analysis of one of these determinants implicates a structural distortion at guide nucleotides 6-7 in promoting slicing. Moreover, slicing directed by different guide sequences has an unanticipated, 600-fold range in 3'-mismatch tolerance, attributable to guides with weak (AU-rich) central pairing requiring extensive 3' complementarity (pairing beyond position 16) to more fully populate the slicing-competent conformation. Together, our analyses identify sequence determinants of RISC activity and provide biochemical and conformational rationale for their action.

Keywords: AGO2; Argonaute; RISC; RNAi; RNA–protein interactions; kinetic analysis; microRNA; siRNA; slicing.


Conflict of interest statement

DECLARATION OF INTERESTS D.P.B. has equity in Alnylam Pharmaceuticals, where he is a co-founder and advisor. D.P.B. is a member of Molecular Cell’s advisory board. P.Y.W. declares no competing interests.

Figures
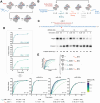
Figure 1.
Figure 1.. Precise measurement of RISC-catalyzed slicing kinetics
(A) Schematic of the four-step model for RISC engagement with fully complementary targets. See text for description. (B) Minimal kinetic scheme of binding (teal) and slicing (orange). Colors are as in (A). E represents RISC; S represents target; P represents sliced product, and the orange caret represents the AGO2 active site. For single-turnover reactions, RISC is at high concentrations, in large excess over target, such that product release and substrate dissociation (both gray) have negligible impact. (C) Representative results of miR-7-directed slicing of a perfectly complementary target. Site of slicing is indicated (orange caret); colors otherwise as in (A). Initial target concentration was 0.05 nM. (D) Results of slicing assays evaluating four different miRNAs. Data points and reaction curves from ODE model fitting are plotted in a gradient from green to purple for increasing RISC concentrations. The extrapolated reaction curve at infinite RISC concentration, which represents a reaction rate determined purely by slicing kinetics, is in black. Time points beyond the limits of the x-axes are not shown. N indicates the number of data points measured for each miRNA. Values of kon and kslice obtained from ODE model fitting are shown for each miRNA. Ranges in parentheses indicate 95% CIs from model-fitting. Binding rate for miR-451a was too fast to resolve in our assays and was thus set to the diffusion limit (60 Nm−1 min−1). All miRNAs were 22-nt long, unless stated otherwise. (E) Simplified ODE model describing the reaction in (B), with a schematic kinetic plot demonstrating the contribution from each kinetic parameter. Colors are as in (B) and (D). See also Figures S1, S2, S3, and S4, Table S1, and Video S1.
Figure 2.
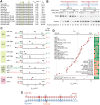
Figure 2.. Sequence determinants of slicing rates
(A) A broad range in kslice values. The 13 initially tested miRNAs, listed in order of their kslice and τslice values. Positions of candidate sequence determinants are highlighted in green. (B) Effect of substituting the base pair at position 10. Shown are representative results for a wildtype miRNA (miR-124) and its mutant (miR-124.M1), in which the C at position 10 was substituted with A (C10A). Initial concentration of target RNA was 0.1 nM in these assays; otherwise, as in Figure 1C. (C) Validation of sequence determinants through base-pair substitutions and additions. Results for wildtype–mutant pairs used to interrogate each sequence determinant are grouped together, with the sequence determinant indicated on the left. kslice values are plotted, with error bars indicating 95% CIs from model-fitting. Wildtype values are in black; those for substitutions expected to increase or decrease kslice are in green and orange, respectively. Relative fold-change values observed between wildtype and mutants are on the right; a value smaller than the 95% CI of biological replicates is in gray (Figure S5A). (D) Replotting of kslice values for perfectly complementary targets for all 29 guides tested in this study. kslice values are plotted as in (C), with the top axis also showing the corresponding τslice values, labeling the minimum, maximum, and median values. For reference, kslice values from a previous study are shown at the bottom. On the right, green indicates the presence of a favorable determinant, and orange its absence. (E) Summary of determinants identified for kslice of perfectly complementary targets. Colors are as in (B). See also Figure S5 and Table S1.
Figure 3.
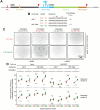
Figure 3.. Favorable sequence determinants confer stronger knockdown in cells
(A) Schematic of reporter constructs. Thicker bars indicate ORFs; thinner bars indicate RNA elements; AUGs indicate start codons; stop signs indicate stop codons, and orange caret points to the perfectly complementary target site in yellow. The target site resided in one of two different ORF contexts—either context A, in which it was positioned between a region coding for the 3xFLAG-tag and a region coding for superfolder GFP (sfGFP), or context B, in which it was positioned between a region coding for the 3xHA-tag and a region coding for human-orthogonal SUMO protein (SUMOEu1). (B) Sequences of four guides tested with reporter assays, shown as two pairs of wildtype and mutant sequences. Key features of the slower-slicing variant are in orange, and those of the faster-slicing variant in green. (C) Representative fluorescent microscopy images of HEK293T cells transfected with reporter constructs containing ORF context A, which included sfGFP. Cells were imaged after 17 h of treatment with either iron chelation (desferroxamine; DFO) or iron (ferric ammonium citrate; FAC). Scale bar is in the bottom right; all images were acquired at the same magnification. Colors were inverted for visibility. (D) Greater knockdown by guides with more favorable slicing determinants. Plotted are reporter knockdown efficacies observed with the indicated cell lines, treatments, and reporter contexts. Fold differences observed between mean knockdown values of the slow and fast guide variants are shown above each set of data points. Each error bar indicates 95% CIs of the geometric mean across six biological replicates. Significance, as measured using unpaired two-sample t-test, calculated in log-scale for fold-change values, is indicated below each set of data points (**** p < 0.0001, *** p < 0.001, ** p < 0.01, * p < 0.05, n.s. not significant). Colors are as in (B).
Figure 4.
Figure 4.. Formation of central pairing does not limit kslice of fully complementary targets
(A) Expanded kinetic scheme illustrating how conformational dynamics of the RISC–target complex could influence slicing kinetics; otherwise, as in Figure 1B. Under thermodynamic conformational control, kslice is a function of Kcon (i.e., kcon+/kcon−); under kinetic conformational control kslice is a function of kcon+. If not under conformational control, kslice is under control of kc. (B) Schematic of the hydroxyl-radical footprinting experiment. 32P label of the guide is indicated with a yellow star, and the D669A mutation is represented as a broken gray caret; otherwise colors are as in (A). (C) Schematic of changes in solvent accessibility of the guide upon conformational change to the slicing-competent state, as probed by hydroxyl radicals. Exposed guide backbone positions predicted to be readily cleaved by hydroxyl radicals are indicated with purple carets. Otherwise, colors are as in (B). (D) Evidence that thermodynamics of conformational change do not influence slicing rates of fully complementary targets. Footprinting reactivity values measured after RISC was bound to either no target or fully complementary target are plotted for each of four guide RNAs spanning the range of kslice for perfectly complementary targets (Figure 2D). Reactivity values were normalized to those of naked-guide or quenched-reagent samples (dashed lines). The band for cleavage after position 21 was not cleanly separated from the full-length band, and bands for cleavage after positions 1–3 were not resolved from the salt front. Cleavage after positions 15–20 of miR-430a could not be confidently quantified (N.D.) due to minor trimmed isoforms of the guide in the input (Figure S6B). Error bars indicate 95% CIs. Positions 9–11 are shaded. Number of replicates for each condition is shown as N in the corresponding color. (E) Evidence that kinetics of conformational change do not influence slicing rates of fully complementary targets. Footprinting reactivity values measured after RISC was incubated with fully complementary target for the indicated amount of time are plotted for each of two guide RNAs with relatively slow kslice values; otherwise, as in (D). See also Figure S6.
Figure 5.
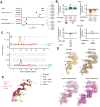
Figure 5.. Enhancement of slicing by weak pairs or mismatches at positions 6–7 aligns with local backbone distortion
(A) Effects of mismatches at positions 6–7. Schematics on the right illustrate pairing at positions 5–8; otherwise, as in Figure 2C. Values with perfectly complementary targets are replotted from Figure 2C. (B) Comparisons of kslice values observed in (A), plotted in log-scale. Left panels show the fold change in kslice due to different mismatches in the target, in the context of different guide RNAs. Nucleotide identity at the position-7 sequence determinant is indicated for each guide. Right panels show the fold change in kslice due to substitutions introduced at position 7, in the context of either perfectly complementary targets or targets harboring a mismatch at position 6. Fold-change values are also indicated above or below the bar plots. Error bars indicate 95% CIs after propagating uncertainty from model-fitting for the two kslice values compared. Colors are as in (A) and Figure 2C. 95% CI of expected background variation is indicated with gray shading (Figure S5A). (C) Changes in δ and γ torsion angles observed in the guide backbone as RISC assumes different conformational states. Measurements are from structure models in which the guide RNA has either no target (4W5N, yellow), seed-pairing (4W5R, brown), seed and supplementary-pairing (6N4O, light pink), seed and extensive 3′-pairing (6MDZ, magenta), or full pairing from position 2 to 16 (7SWF, deep pink). Values are only shown for base-paired nucleotides or, in the case of the no-target state, positions 2–7, which are pre-organized into an A-form-like helix by AGO. Six values corresponding to unexpected conformation outliers, indicating possible poor model-fit, were found in positions 13–19 of states with either seed and supplementary pairing or seed and extensive 3′-pairing; these were not plotted (Figure S7D). Expected ranges of angles for canonical conformers are shown in gray, and expected ranges of angles for A-form helices are indicated in turquoise on the right. (D) Distortion of the guide backbone as RISC assumes different conformational states. Shown are structure models of the guide backbone at positions 4–8 for each of the structures in (C) solved using crystallography, overlaid with electron density omit maps (2mFoDFc) contoured at 1.6 σ, shown in mesh. The 2′-hydroxyl of position 6 is indicated with a black triangle for each model. Position 8 in the no-target state was not resolved and thus is not shown. Colors are as in (C). (E) As in (D) but for all five structure models and without the electron density maps. Models were overlaid and aligned at AGO MID and PIWI domains. Displacement of the position 7 phosphate observed as RISC shifts from the no-target state to the slicing state is indicated with an arrow. See also Figure S7 and Table S1.
Figure 6.
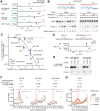
Figure 6.. Strong central pairing compensates for terminal mismatches, which otherwise reduce the fraction of complexes in the slicing configuration
(A) The importance of pairing to position 17. Measured are kslice values for perfectly complementary targets (black) or targets harboring a mismatch at position 17 (cyan); otherwise, as in Figure 2C. Values with perfectly complementary targets are replotted from Figure 2C. (B) The importance of pairing to positions 17–22. Shown are pairing diagrams and representative results for miR-196a.M1-directed slicing of its perfectly complementary and 16-bp targets. Target nucleotides changed to introduce terminal mismatches are highlighted in blue; otherwise, as in Figure 2B. (C) Relationship between fold change in kslice observed for 16-bp targets and predicted base-pairing energy at positions 9–12. Error bars indicate 95% CIs based on propagated uncertainty from model-fitting for the two kslice values considered. Curve shows the nonlinear least-squares best fit of a thermodynamic equation involving one fitted parameter (ΔG°thres); its fitted value is shown with its 95% CI and p value as calculated by a t-test. (D) Mutational evidence supporting the relationship between predicted strength of central pairing and the effect of terminal mismatches. Measured are kslice values for perfectly complementary or 16-bp targets, for miR-124 and its mutant (miR-124.M2), in which the central G/C nucleotides of miR-124 were replaced with A/U nucleotides. Substituted positions are highlighted in the schematic. Values from 16-bp targets are plotted in purple; otherwise, as in (A). Values with perfectly complementary targets are replotted from Figure 2D. (E) Evidence that slowly sliced 16-bp targets are nonetheless fully bound. Shown are results of slicing assays with 16-bp targets, in which the RISC-bound and free RNA species were separated by filter binding after 1.5 hours of incubation. RISC and target were initially at 1.0 and 0.05 nM, respectively. (F) Evidence that forming the centrally paired conformation limits kslice when guides with weak central pairing are slicing targets with terminal mismatches. Footprinting reactivity values observed when RISC was bound to no target, 16-bp target, or perfectly complementary target, are plotted for each of three miRNAs. Results for miR-196a with no target and with perfectly complementary target are replotted from Figure 4D. Positions 15–20 of miR-124 and miR-124.M2 could not be confidently quantified (N.D.) due to minor trimmed isoforms of the guide in the input (Figure S6B). Otherwise, as in Figure 4D. (G) Evidence that the conformational change thermodynamically limits kslice when guides with weak central pairing are slicing targets with terminal mismatches. This panel is as in Figure 4E, except it shows reactivity values for miR-7 RISC as it engages with either perfect or terminally mismatched target. Results for miR-7 RISC after incubation with either no target or for 30 min with perfectly complementary target are replotted from Figure 4D. See also Figure S6 and Table S1.
Figure 7.
Figure 7.. Sequence and conformational determinants of slicing by AGO2
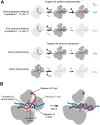
(A) Schematic of the proposed relationships between guide-RNA sequence determinants, conformational dynamics, and kslice for either perfectly or partially complementary targets. When RISC is bound to perfectly complementary targets, the slicing-competent conformation is always well-populated. RNA sequence determinants appear to confer subtle structural changes that affect the efficiency of chemistry (kc). When RISC is bound to targets mismatched after position 16, only guides with strong central pairing fully populate the centrally paired, slicing-competent configuration. (B) The concerted, mutually reinforcing movements proposed to occur as target-bound RISC reaches the slicing conformation.

Similar articles

References

    1. Jonas S., and Izaurralde E. (2015). Towards a molecular understanding of microRNA-mediated gene silencing. Nat. Rev. Genet. 16, 421–433. 10.1038/nrg3965. - DOI - PubMed
    1. Bartel D.P. (2018). Metazoan MicroRNAs. Cell 173, 20–51. 10.1016/j.cell.2018.03.006. - DOI - PMC - PubMed
    1. Elbashir S.M., Lendeckel W., and Tuschl T. (2001). RNA interference is mediated by 21- and 22-nucleotide RNAs. Genes Dev. 15, 188–200. 10.1101/gad.862301. - DOI - PMC - PubMed
    1. Hutvágner G., and Zamore P.D. (2002). A microRNA in a Multiple-Turnover RNAi Enzyme Complex. Science 297, 2056–2060. 10.1126/science.1073827. - DOI - PubMed
    1. Song J.-J. (2004). Crystal Structure of Argonaute and Its Implications for RISC Slicer Activity. Science 305, 1434–1437. 10.1126/science.1102514. - DOI - PubMed

Publication types