. 2024 May 18;10(1):241.
doi: 10.1038/s41420-024-02025-z.

NUP43 promotes PD-L1/nPD-L1/PD-L1 feedback loop via TM4SF1/JAK/STAT3 pathway in colorectal cancer progression and metastatsis

Affiliations

NUP43 promotes PD-L1/nPD-L1/PD-L1 feedback loop via TM4SF1/JAK/STAT3 pathway in colorectal cancer progression and metastatsis

Fan Wu et al. Cell Death Discov. .

Abstract

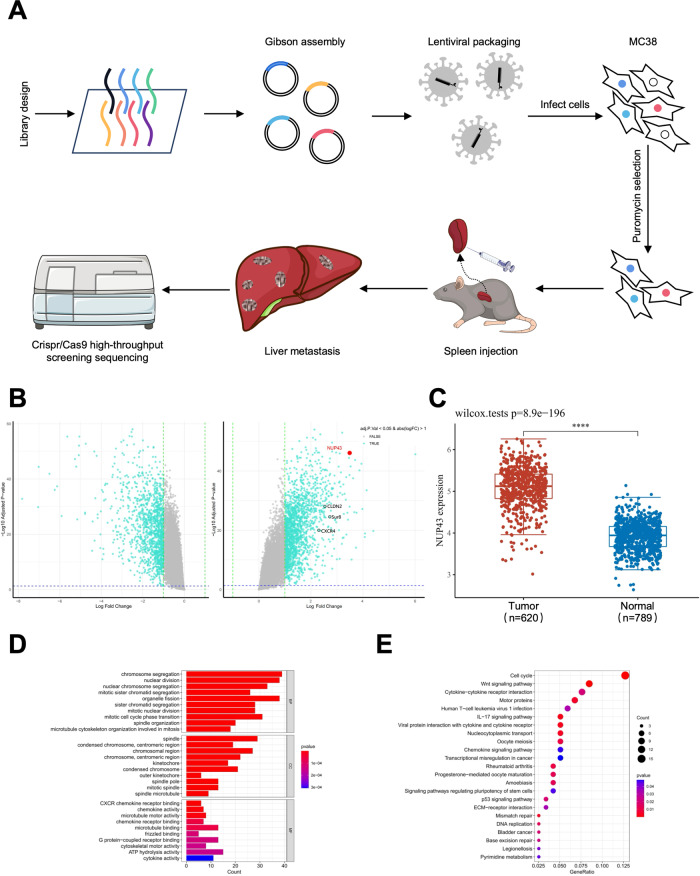
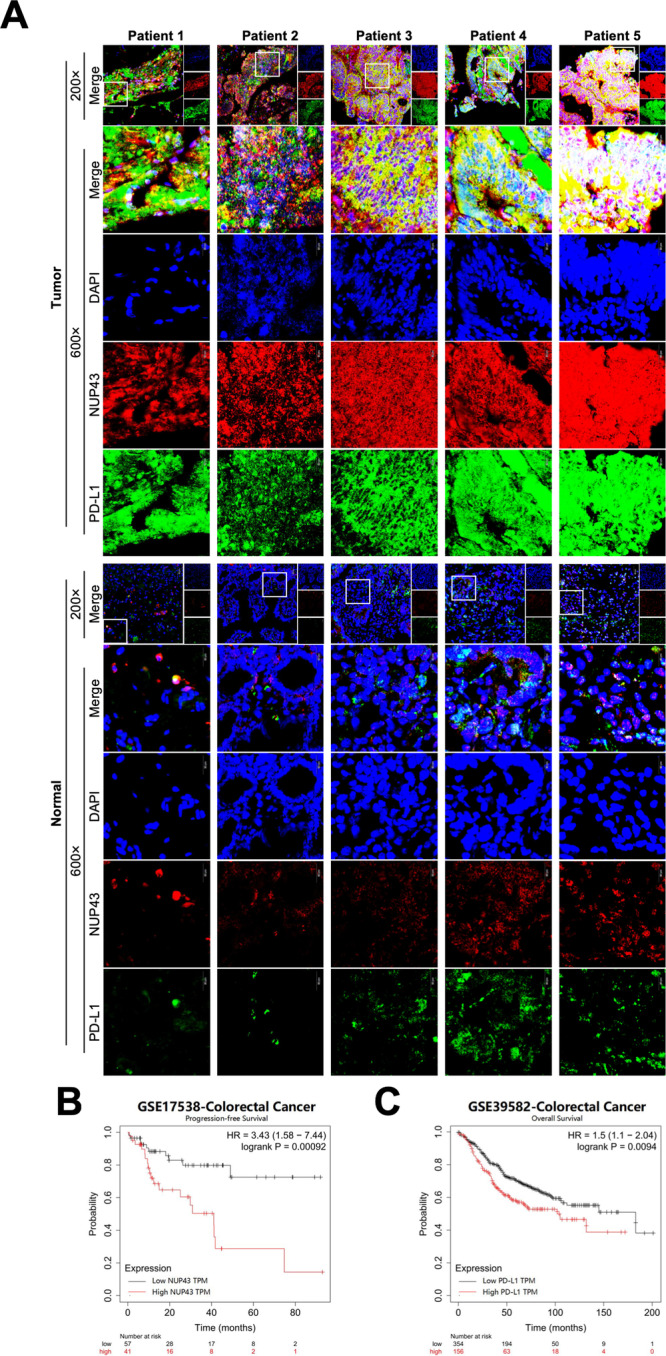
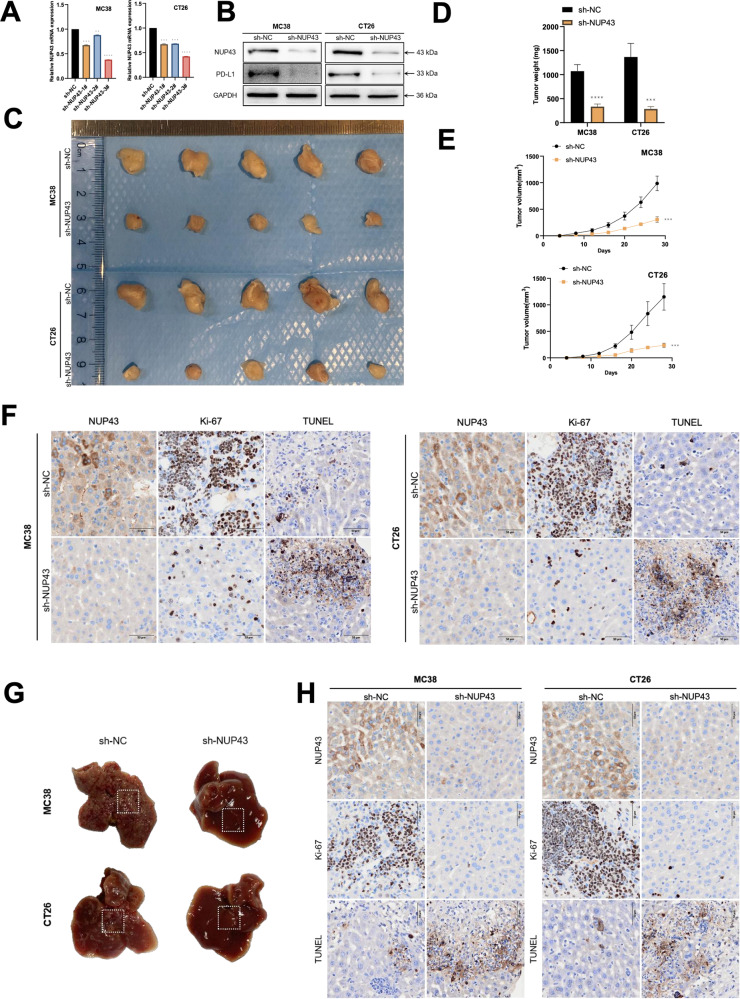
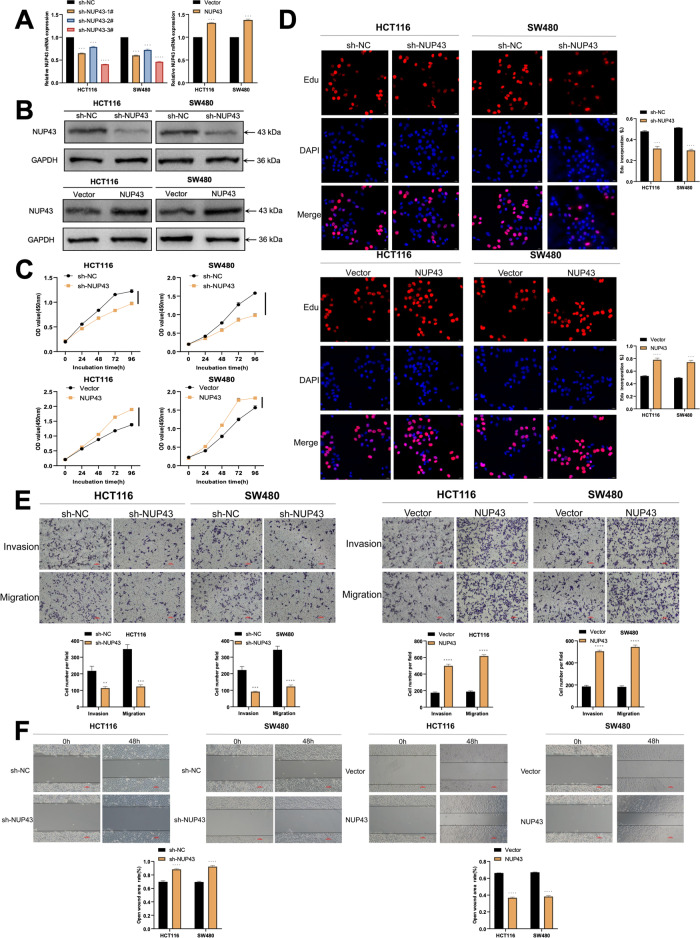
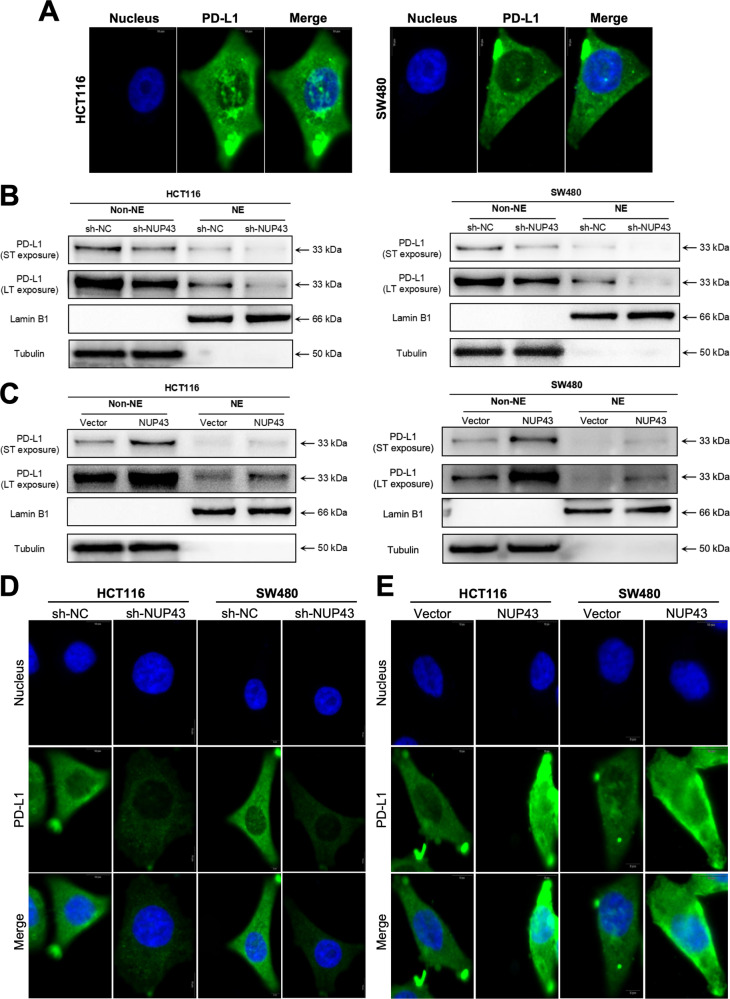
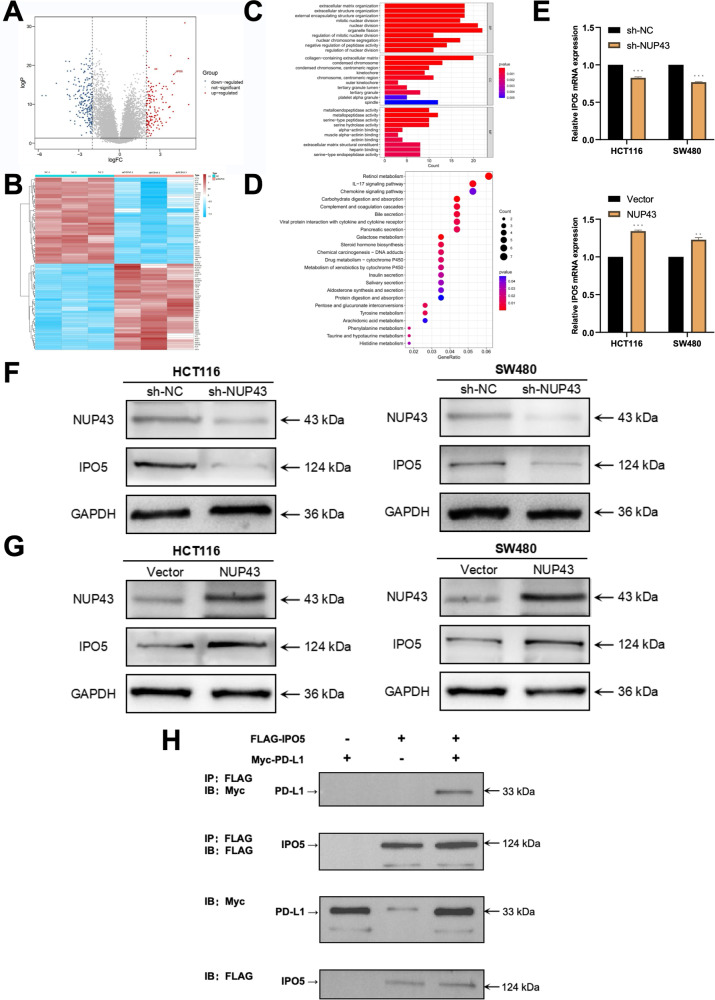
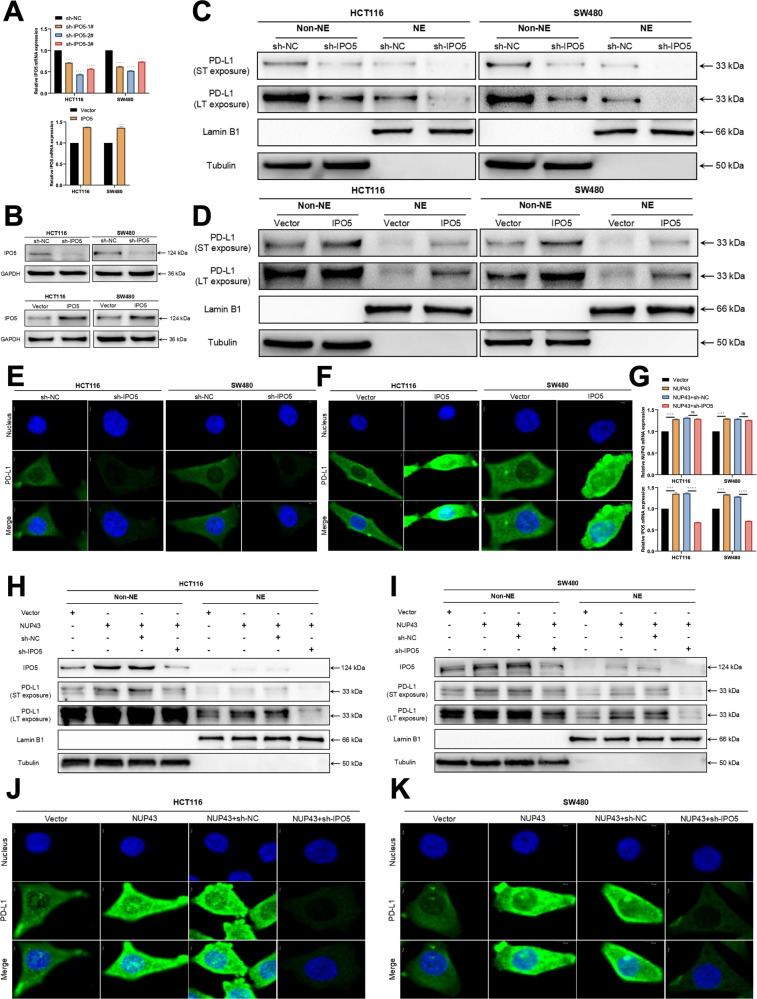
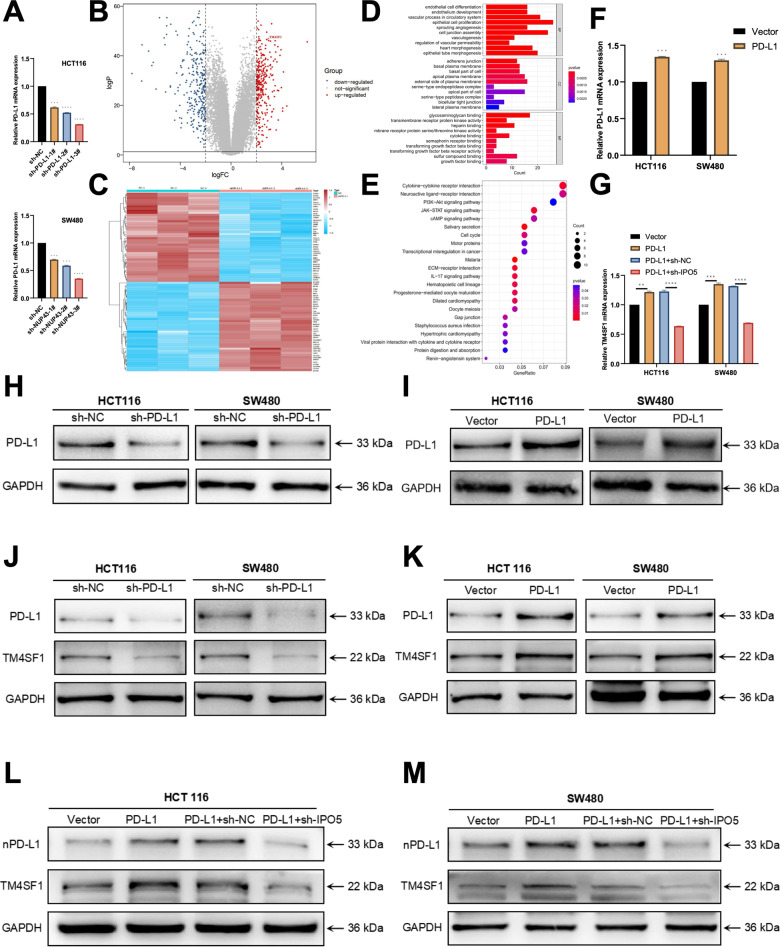
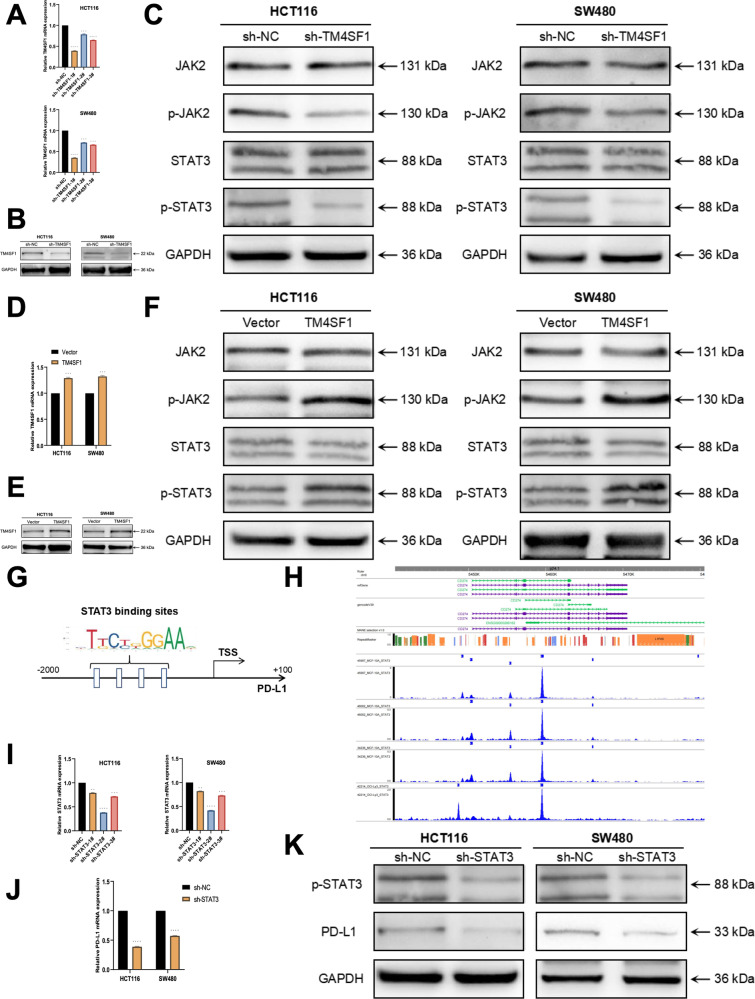
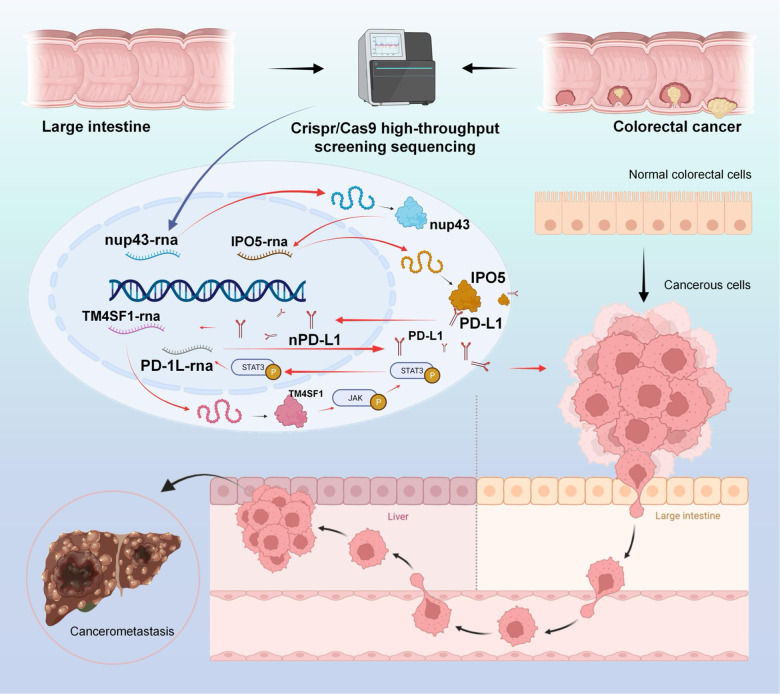
Programmed cell death-ligand 1 (PD-L1) has a significant role in tumor progression and metastasis, facilitating tumor cell evasion from immune surveillance. PD-L1 can be detected in the tumor cell nucleus and exert an oncogenic effect by nuclear translocation. Colorectal cancer (CRC) progression and liver metastasis (CCLM) are among the most lethal diseases worldwide, but the mechanism of PD-L1 nuclear translocation in CRC and CCLM remains to be fully understood. In this study, using CRISPR-Cas9-based genome-wide screening combined with RNA-seq, we found that the oncogenic factor NUP43 impacted the process of PD-L1 nuclear translocation by regulating the expression level of the PD-L1 chaperone protein IPO5. Subsequent investigation revealed that this process could stimulate the expression of tumor-promoting factor TM4SF1 and further activate the JAK/STAT3 signaling pathway, which ultimately enhanced the transcription of PD-L1, thus establishing a PD-L1-nPD-L1-PD-L1 feedback loop that ultimately promoted CRC progression and CCLM. In conclusion, our study reveals a novel role for nPD-L1 in CRC, identifies the PD-L1-nPD-L1-PD-L1 feedback loop in CRC, and provides a therapeutic strategy for CRC patients.


Conflict of interest statement

The authors declare no competing interests.

Figures

Fig. 1
Fig. 1. Genome-wide CRISPR/Cas9 screen analysis reveals that NUP43 plays a role in promoting oncogenesis and liver metastasis in CRC.
A Genome-wide CRISPR screen has identified genes that might control the formation and progression of CRC. B Volcano plot displaying the genes that exhibit differential expression. The left side is characterized by positivity, whereas the right side is characterized by negativity. The identification of NUP43 is indicated by the color red. C Analysis of NUP43 expression in both healthy tissues and CRC tissues using data from the TCGA database. D GO analysis of the negative group. E KEGG pathway analysis of the negative group.
Fig. 2
Fig. 2. Analysis of NUP43 and PD-L1 expression in human tissues and their influence on prognosis.
A Immunofluorescence analysis was performed to determine the expression of NUP43 (red) and PD-L1 (green) in cancerous tissue and the comparable surrounding tissue of five patients with CRC. B, C Analysis of survival time using the TCGA and GEO databases.
Fig. 3
Fig. 3. Suppression of NUP43 hampers the progression of CRC and liver metastasis in vivo.
A, B Three shRNAs (sh-NUP43-1#, sh-NUP43-2#, and sh-NUP43-3#) were designed to silence CRC cells (MC38 and CT26) and verified by qRT-PCR and Western blotting. We used sh-NUP43-3# to downregulate NUP43. C Illustrative photos of subcutaneous tumors from both the sh-NC and sh-NUP43 groups. D, E Statistics of weight (D) and volume (E) of subcutaneous tumors in each group. F Immunohistochemical findings of NUP43, Ki-67, and TUNEL expression were seen in each group. G Illustrative visuals of liver metastases in both the sh-NC and sh-NUP43 groups. H Immunohistochemical findings of NUP43, Ki-67, and TUNEL expression were seen in each group. *P < 0.05; **P < 0.01; ***P < 0.001; ****P < 0.0001.
Fig. 4
Fig. 4. NUP43 enhances the growth and infiltration of CRC cells.
A, B Three shRNAs (sh-NUP43-1#, sh-NUP43-2#, and sh-NUP43-3#) were designed to silence CRC cells (HCT116 and SW480) and verified by qRT-PCR and Western blotting. We used sh-NUP43-3# to downregulate NUP43. NUP43 overexpression was verified in CRC cells (HCT116 and SW480) by qRT-PCR and Western blotting. C The growth curve of cells transfected with sh-NUP43/NUP43 was drawn according to the CCK-8 method. The upper figure shows the cell proliferation results after NUP43 knockdown, and the lower figure shows the cell proliferation results after NUP43 overexpression. D The EdU assay is used to assess the proliferation capacity of CRC cells that have been transfected with sh-NUP43/NUP43. The left panel depicts cellular proliferation following the manipulation of NUP43 through knockdown or overexpression. The findings of the cell counting analysis are displayed in the right section. E Transwell test was used to assess the invasive and metastatic properties of CRC cells that were transfected with sh-NUP43/NUP43. The upper panel displays the outcomes of cell invasion and metastasis following the manipulation of NUP43 through knockdown or overexpression. The lower panel displays the findings of migration and metastatic cell count assessments. F A scratch experiment was conducted to assess the invasive capacity of CRC cells that were transfected with sh-NUP43/NUP43. *P < 0.05; **P < 0.01; ***P < 0.001; ****P < 0.0001.
Fig. 5
Fig. 5. NUP43 facilitates the nuclear translocation of PD-L1.
A The location of PD-L1 in CRC cells (HCT116 and SW480) was studied using immunofluorescence labeling and confocal imaging. The scale bar used was 5 μm. B, C Following the separation of cells into several groups (sh-NUP43, sh-NC, Vector, NUP43), a PD-L1 Western blot analysis was conducted.ST exposure refers to a brief duration of exposure, while LT exposure refers to a prolonged duration of exposure. Lamin B1 serves as a marker for nuclear proteins, while tubulin serves as a marker for cytoplasmic proteins. D, E The cellular localization of PD-L1 was examined in each group using confocal microscopy and immunofluorescence labeling.
Fig. 6
Fig. 6. IPO5 plays a role in the NUP43-facilitated movement of PD-L1 into the nucleus.
A RNA sequencing was employed to assess the differential expression of mRNAs in the sh-NUP43 and sh-NC groups. In the Volcano plot, the color red represents a higher gene expression level in the sh-NC group compared to the sh-NUP43 group, while the color blue represents a lower expression level. An arrow denotes IPO5. B Heatmap illustrating the expression levels of mRNAs that are differently expressed between the sh-NUP43 and sh-NC groups. The intensity of the color red directly correlates with the degree of expression. C Performing GO analysis on the mRNA in CRC cells treated with sh-NUP43 and sh-NC. D Performing KEGG pathway analysis on mRNA in CRC cells treated with sh-NUP43 and sh-NC. E The expression of IPO5 mRNA was detected by qRT-PCR in cells from each group, namely sh-NUP43, sh-NC, Vector, and NUP43. F, G Performing Western blot analysis to detect the presence of NUP43 and IPO5 proteins in each cell group. H The HEK293T cells were transfected with the specified plasmids. The interaction between PD-L1 and IPO5 was assessed using Western blotting and co-IP techniques. *P < 0.05; **P < 0.01; ***P < 0.001; ****P < 0.0001.
Fig. 7
Fig. 7. IPO5 is an indispensable key molecule during the NUP43-mediated nuclear translocation of PD-L1.
A, B Three shRNAs (sh-IPO5-1#, sh-IPO5-2#, and sh-IPO5-3#) were designed to silence CRC cells (HCT116 and SW480) and verified by qRT-PCR and Western blotting. We used sh-IPO5-2# to downregulate IPO5. IPO5 overexpression was verified in CRC cells (HCT116 and SW480) by qRT-PCR and Western blotting. C, D Following the division of cells into several groups (sh-IPO5, sh-NC, Vector, IPO5) based on nucleocytoplasmic distribution, PD-L1 Western blot analysis was conducted. E, F Confocal microscopy was used to assess the immunofluorescence staining of PD-L1 in cells from each group. G qRT-PCR was conducted to identify the presence of NUP43 and IPO5 mRNA in cells from each experimental group (Vector, NUP43, NUP43+sh-NC, and NUP43+sh-IPO5). H, I Perform Western blot analysis to examine the expression levels of IPO5 and PD-L1 in each cell group. J, K Confocal microscopy was used to assess the immunofluorescence staining of PD-L1 in cells from each group. *P < 0.05; **P < 0.01; ***P < 0.001; ****P < 0.0001.
Fig. 8
Fig. 8. Once PD-L1 penetrates the nucleus, it stimulates the activation of the cancer-promoting factor TM4SF1.
A, H Three shRNAs (sh-PD-L1-1#, sh-PD-L1-2#, and sh-PD-L1-3#) were designed to silence CRC cells (HCT116 and SW480) and analyzed by qRT-PCR and Western blotting for verification. We used sh-PD-L1-3# to downregulate PD-L1. B RNA sequencing was employed to assess the differential expression of mRNAs in the sh-PD-L1 and sh-NC groups. In the Volcano plot, the color red signifies that the gene expression level of the sh-NC group is greater than that of the sh-PD-L1 group, while the color blue suggests a lower expression level. TM4SF1 is denoted by an arrow. C Heatmap displaying the mRNAs that are expressed differently between the sh-PD-L1 and sh-NC groups. Greater intensity of the color red corresponds to a higher degree of expression. D Performing GO analysis on mRNA in CRC cells treated with sh-PD-L1 and sh-NC. E Performing KEGG pathway analysis on mRNA in CRC cells treated with sh-PD-L1 and sh-NC. F, I PD-L1 overexpression in CRC cells (HCT116 and SW480) was confirmed using qRT-PCR and Western blotting techniques. G The expression of TM4SF1 mRNA in cells from each group (Vector, PD-L1, PD-L1+sh-NC, and PD-L1+sh-IPO5) was detected by qRT-PCR. J, K Western blot analysis was performed to examine the expression of TM4SF1 and PD-L1 in each experimental group, including sh-NC, sh-PD-L1, Vector, and PD-L1. L, M Western blot analysis was performed on cells from each group, namely Vector, PD-L1, PD-L1+sh-NC, and PD-L1+sh-IPO5, to detect TM4SF1 protein expression. Following the separation of cells into nuclear and cytoplasmic fractions, the nuclear protein fraction was subjected to PD-L1 Western blot analysis. *P < 0.05; **P < 0.01; ***P < 0.001; ****P < 0.0001.
Fig. 9
Fig. 9. TM4SF1 enhances the process of PD-L1 gene transcription by stimulating the JAK/STAT3 signaling pathway.
A, B, D, E Three shRNAs (sh-TM4SF1-1#, sh-TM4SF1-2#, and sh-TM4SF1-3#) were designed to silence CRC cells (HCT116 and SW480) and were analyzed by qRT-PCR and Western blotting. We used sh-TM4SF1-1# to downregulate TM4SF1. TM4SF1 overexpression was verified in CRC cells (HCT116 and SW480) by qRT-PCR and Western blotting. C, F The Western blot analysis reveals the levels of JAK2, phospho-JAK2, STAT3, and phospho-STAT3 expression in CRC cells with either reduced or increased TM4SF1 expression. G According to the JASPAR database, it was anticipated that the promoter of the PD-L1 gene contains the binding site for STAT3. H The ChIP data for GSM935457, GSM935399, GSM935551, and GSM1227206 revealed a distinct peak of STAT3 located upstream of PD-L1. I Three shRNAs (sh-STAT3-1#, sh-STAT3-2#, and sh-STAT3-3#) were designed to silence CRC cells (HCT116 and SW480) and verified by qRT-PCR. We used sh-STAT3-2# to downregulate STAT3. J The expression of PD-L1 mRNA in cells of each group (sh-NC, sh-STAT3) was detected by qRT-PCR. K Western blot analysis was conducted to assess the efficacy of sh-STAT3 silencing in each group, and to analyze the expression of PD-L1 in cells from each group. *P < 0.05; **P < 0.01; ***P < 0.001; ****P < 0.0001.
Fig. 10
Fig. 10
The schematic picture demonstrates that the oncogenic factor NUP43 enhances the nuclear transport of PD-L1 by controlling the expression of the PD-L1 chaperone protein IPO5. Nuclear PD-L1 stimulates the expression of the tumor-promoting factor TM4SF1 and activates the JAK/STAT3 signaling pathway. This ultimately leads to increased transcription of PD-L1, establishing a cyclic enhancement system involving PD-L1, nPD-L1, and PD-L1. Consequently, this system promotes the occurrence and progression of CRC and liver metastasis.

Similar articles

References

    1. Biller LH, Schrag D. Diagnosis and treatment of metastatic colorectal cancer: a review. JAMA. 2021;325:669–85. doi: 10.1001/jama.2021.0106. - DOI - PubMed
    1. Cho YH, Ro EJ, Yoon JS, Mizutani T, Kang DW, Park JC, et al. 5-FU promotes stemness of colorectal cancer via p53-mediated WNT/beta-catenin pathway activation. Nat Commun. 2020;11:5321. doi: 10.1038/s41467-020-19173-2. - DOI - PMC - PubMed
    1. Keum N, Giovannucci E. Global burden of colorectal cancer: emerging trends, risk factors and prevention strategies. Nat Rev Gastroenterol Hepatol. 2019;16:713–32. doi: 10.1038/s41575-019-0189-8. - DOI - PubMed
    1. Bai X, Wei H, Liu W, Coker OO, Gou H, Liu C, et al. Cigarette smoke promotes colorectal cancer through modulation of gut microbiota and related metabolites. Gut. 2022;71:2439–50. doi: 10.1136/gutjnl-2021-325021. - DOI - PMC - PubMed
    1. Wu Y, Yang S, Ma J, Chen Z, Song G, Rao D, et al. Spatiotemporal immune landscape of colorectal cancer liver metastasis at single-cell level. Cancer Discov. 2022;12:134–53. doi: 10.1158/2159-8290.CD-21-0316. - DOI - PubMed