. 2024 May 17;15(1):3812.
doi: 10.1038/s41467-024-48088-5.

High-throughput mechanical phenotyping and transcriptomics of single cells

Affiliations

High-throughput mechanical phenotyping and transcriptomics of single cells

Akifumi Shiomi et al. Nat Commun. .

Abstract

The molecular system regulating cellular mechanical properties remains unexplored at single-cell resolution mainly due to a limited ability to combine mechanophenotyping with unbiased transcriptional screening. Here, we describe an electroporation-based lipid-bilayer assay for cell surface tension and transcriptomics (ELASTomics), a method in which oligonucleotide-labelled macromolecules are imported into cells via nanopore electroporation to assess the mechanical state of the cell surface and are enumerated by sequencing. ELASTomics can be readily integrated with existing single-cell sequencing approaches and enables the joint study of cell surface mechanics and underlying transcriptional regulation at an unprecedented resolution. We validate ELASTomics via analysis of cancer cell lines from various malignancies and show that the method can accurately identify cell types and assess cell surface tension. ELASTomics enables exploration of the relationships between cell surface tension, surface proteins, and transcripts along cell lineages differentiating from the haematopoietic progenitor cells of mice. We study the surface mechanics of cellular senescence and demonstrate that RRAD regulates cell surface tension in senescent TIG-1 cells. ELASTomics provides a unique opportunity to profile the mechanical and molecular phenotypes of single cells and can dissect the interplay among these in a range of biological contexts.


Conflict of interest statement

The authors declare no competing interests.

Figures
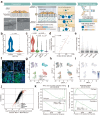
Fig. 1
Fig. 1. ELASTomics enables simultaneous detection of single-cell surface tension coupled with transcriptomes.
a Workflow of ELASTomics. (Preparation) Cells are cultured on the track-etched membrane coated by fibronectin. The lower left panel is field emission scanning electron microscopy (FE-SEM) images of MCF7 cells on a track-etched membrane, and the lower right panel is zoom-up views of the dotted box in the lower left panel. An independent duplicate experiment has verified similar results at a different angle of FE-SEM imaging. Scale bars, 2 μm. (Nanopore-electroporation) Cells are subjected to pulsed electric fields that are created in the vicinity of nanopores to import DNA-tagged dextran (DTD) into the cells. The cell surface tension of the lipid bilayer affects the diameter of the pore formed in a lipid bilayer. The amount of imported DTD thus dictates the surface tension of individual cells. (Single-cell RNA-seq) Single-cell RNA-sequencing (scRNA-seq) workflow creates libraries of transcriptomics (mRNA library) and cell surface tension (DTD library). b Centered log ratios of 4 kDa DTD imported into MCF10A cells with or without cytochalasin D treatment. c Centered log ratios of 4 kDa DTD imported into four cell lines (MCF10A, MCF7, MDA-MB-231, and PC-3). For boxplot overlaid on a violin plot (b and c), the center line is the median, the box indicates the first and third quartiles, whiskers are minimum/maximum values excluding outliers, and dots are outliers. d Normalized intensity of FITC-labeled bovine serum albumin (FITC-BSA) and cell surface tension measured by atomic force microscopy in each nanopore-electroporated MCF10A cell (n = 28 independent cells examined in four independent experiments). The coefficient of Pearson’s correlation (two-tailed) is r = 0.648. Error bars of surface tension are presented as mean ± SE for n = 2 to 44 times of each cell. The red line represents the regression curve. e Relative permeability of different DTDs (4, 10, 70, and 500 kDa) imported into MCF10A cells. Counts are respectively normalized by concentration and the mobility of each DTD. f Fluorescence images of nanopore-electroporated cells with FITC-BSA (green). Cell nuclei are stained by Hoechst 33342 (blue). An independent duplicate experiment has verified the similar heterogeneity across cell types in FITC-BSA measurements by flow cytometry. Scale bar, 10 μm. g–i Uniform manifold approximation and projection (UMAP) of cells. The color indicates the cell types (purple: PC-3; blue: MDA-MB-231; green: MCF7; red: MCF10A) (g) and the applied voltages (red: 0 V; blue: 40 V) of nanopore-electroporation (h), and centered log ratios of 4 kDa DTD imported into cells by nanopore-electroporation (i). j Coefficient of correlation between centered log ratio of DTD and the expression of individual genes (Correlation) plotted against the log fold-change of the gene expression between MCF7 and MDA-MB-231 (Cell type). Red points are genes with the log fold-change in average expression is >2.5 or <−2.5. k, l Gene set enrichment analysis (GSEA) showing enriched pathways with genes ordered by correlation and cell type shown in j. The P values (p) are indicated in the graph (b: two-tailed Student’s t-test; c: Tukey’s t-test). Source data are provided as a Source Data file.
Fig. 2
Fig. 2. ELASTomics analysis of mouse hematopoietic stem/progenitor cell (mHSPCs).
a Schematic image of ELASTomics with CITE-seq for mHSPCs. c-kit+ bone marrow (BM) cells were isolated from a C57BL/6 J mouse femur using antibody-conjugated magnetic beads. After DTDs were imported into the c-kit+ BM cells by nanopore-electroporation, the cells were incubated with antibodies conjugated with antibody-derived tag (ADT). The DTDs, ADTs, and mRNA expression were measured by scRNA-seq. b–e UMAP of mHSPCs. The color and color gradient indicates the identified cell types (Gra: granulocyte n = 5786; GMP: granulocyte-macrophage progenitor n = 857; Mono: monocyte n = 730; CLP: common lymphoid progenitor n = 113; MPP: multipotential progenitors n = 394; HSC: hematopoietic stem cell n = 131; MkP: megakaryocyte progenitors n = 126; BaP: basophil progenitors n = 69; CMP: common myeloid progenitor n = 206; EryP/MEP, erythroid progenitors / megakaryocyte-erythrocyte progenitors n = 573; Erythroid n = 463; Erythrocyte n = 115; Bcell n = 356; other n = 92) (b), Cd48 gene expression (c), centered log ratios of Cd48 ADT (d), and centered log ratio of 4 kDa DTD (e), respectively. f–i Comparison of the erythroid lineage cells (HSC, MPP, CMP, MEP/EryP, erythroid, and erythrocyte) with centered log ratios of 4 kDa DTD f, centered log ratios of Cd48 ADT (g), percent fractions of mitochondrial mRNA (h), and gene expressions of Sptb (i), respectively. f The percentage indicates the ratio of cells higher than 1 of the centered log ratio of the 4 kDa DTD.
Fig. 3
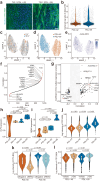
Fig. 3. ELASTomics analysis of cellular senescence.
a Fluorescence images of nanopore-electroporated TIG-1 cells at different population doubling levels (PDL) = 42 and 59. FITC-BSA (green) was imported into cells by nanopore-electroporation. Nuclei were stained by Hoechst 33342 (blue). Similar results were observed in independent duplicate experiments. Scale bar, 50 μm. b Centered log ratio of 4 kDa DTD in TIG-1 cells at PDL = 42 and 59. Dots indicate individual cells. c-e UMAP of relatively young (PDL = 42) and senescent (PDL = 59) TIG-1 cells. The colors respectively indicate the applied voltages (c), PDLs (d), and centered log ratio of 4 kDa DTD (e). f The coefficients of correlation between the centered log ratio of 4 kDa DTD and expression of individual genes. Red points are the genes with Pearson’s |r | > 0.15. g The coefficients of variables (s) and the coefficients of correlation between DTD counts and gene expression. Red points are genes with Pearson’s r > 0.3 or < −0.2 (P < 0.001) and |s | > 0.1. h, i Comparison of bulk TIG-1 cells at different PDLs (PDL = 33, 44, 52, and 65) with the expression levels of KLF2 (h) and RRAD (i) (n = 3 biologically independent samples). J-l Fluorescence intensity of imported FITC-BSA by nanopore-electroporation to TIG-1 cells with different PDLs (PDL = 33 n = 11,008; PDL = 44 n = 11,050; PDL = 52 n = 11,171; PDL = 65 n = 9365 independent cells) (j), with or without the suppression of RRAD by siRNA (PDL = 40 with siNegative n = 9711; PDL = 40 with siRRAD n = 11,012; PDL = 56 with siNegative n = 10,636; PDL = 56 with siRRAD n = 4894 independent cells) (k), and treated with vehicle or 2-deoxy-D-glucose (2-DG) (PDL = 40 with 0 mM 2-DG n = 10,931; PDL = 40 with 1 mM 2-DG n = 11,076; PDL = 60 with 0 mM 2-DG n = 2861; PDL = 60 with 1 mM 2-DG n = 6083 independent cells) (l). In the boxplots (j–l), the center lines are the median, the box indicates the first and third quartiles, whiskers are the minimum and the maximum excluding outliers, and dots are outliers. Similar results were observed in independent duplicate experiments. The P values (p) are indicated in the graph (h-l: Tukey’s t-test). Source data are provided as a Source Data file.

Similar articles

References

    1. Pajerowski JD, Dahl KN, Zhong FL, Sammak PJ, Discher DE. Physical plasticity of the nucleus in stem cell differentiation. P Natl Acad. Sci. USA. 2007;104:15619–15624. doi: 10.1073/pnas.0702576104. - DOI - PMC - PubMed
    1. Titushkin I, Cho M. Modulation of cellular mechanics during osteogenic differentiation of human mesenchymal stem cells. Biophys. J. 2007;93:3693–3702. doi: 10.1529/biophysj.107.107797. - DOI - PMC - PubMed
    1. Chowdhury F, et al. Material properties of the cell dictate stress-induced spreading and differentiation in embryonic stem cells. Nat. Mater. 2010;9:82–88. doi: 10.1038/nmat2563. - DOI - PMC - PubMed
    1. Bergert M, et al. Cell Surface Mechanics Gate Embryonic Stem Cell Differentiation. Cell Stem Cell. 2021;28:209–216.e204. doi: 10.1016/j.stem.2020.10.017. - DOI - PMC - PubMed
    1. Gensbittel V, et al. Mechanical Adaptability of Tumor Cells in Metastasis. Dev. Cell. 2021;56:164–179. doi: 10.1016/j.devcel.2020.10.011. - DOI - PubMed