Function of NEK2 in clear cell renal cell carcinoma and its effect on the tumor microenvironment
- PMID: 38758909
- PMCID: PMC11098263
- DOI: 10.1097/MD.0000000000037939
Function of NEK2 in clear cell renal cell carcinoma and its effect on the tumor microenvironment
Abstract
Background: Previous studies have revealed the critical functions of NEK2 in controlling the cell cycle which is linked to poor prognosis in multiple tumor types, but less research has been devoted to clear cell renal cell carcinoma (ccRCC).
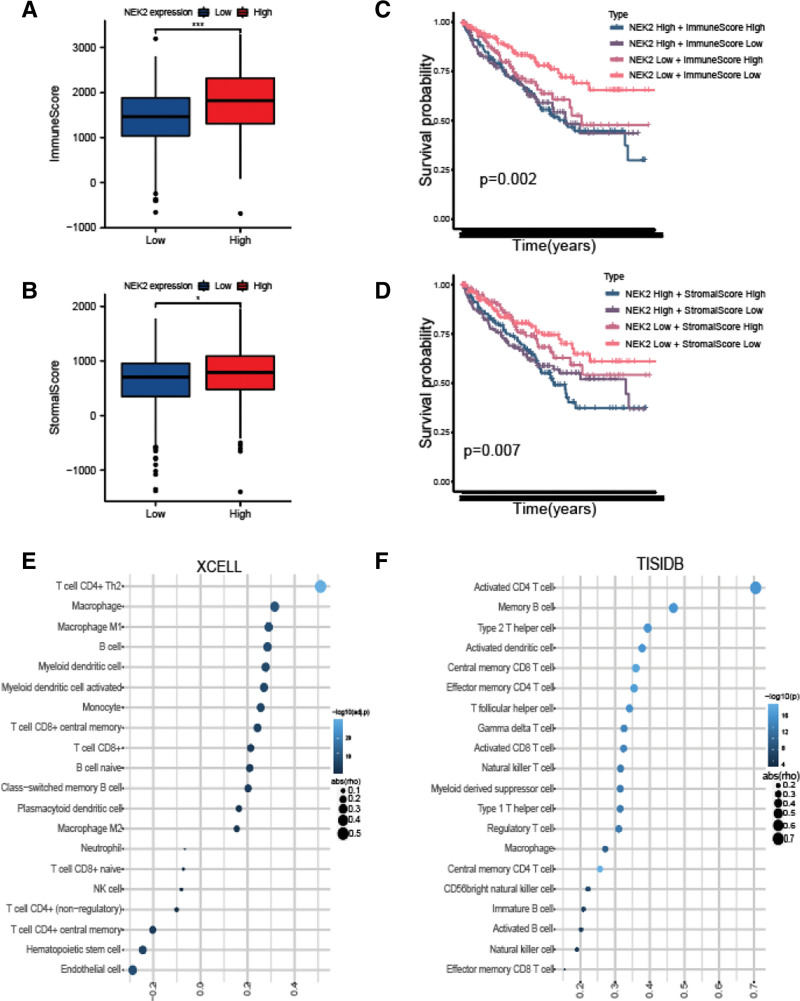
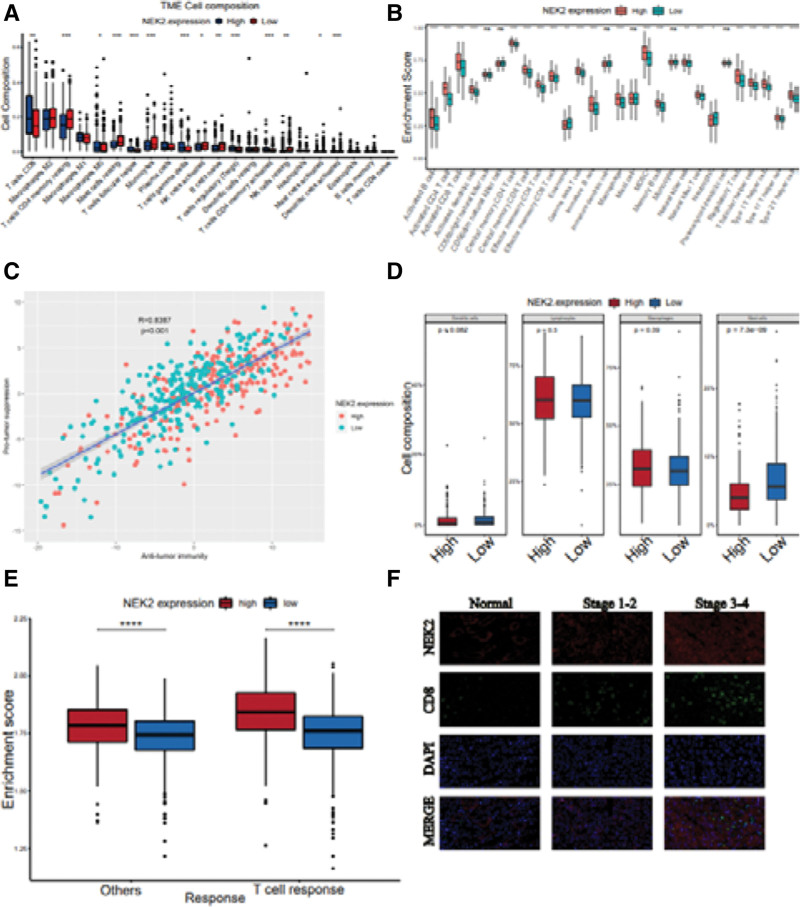
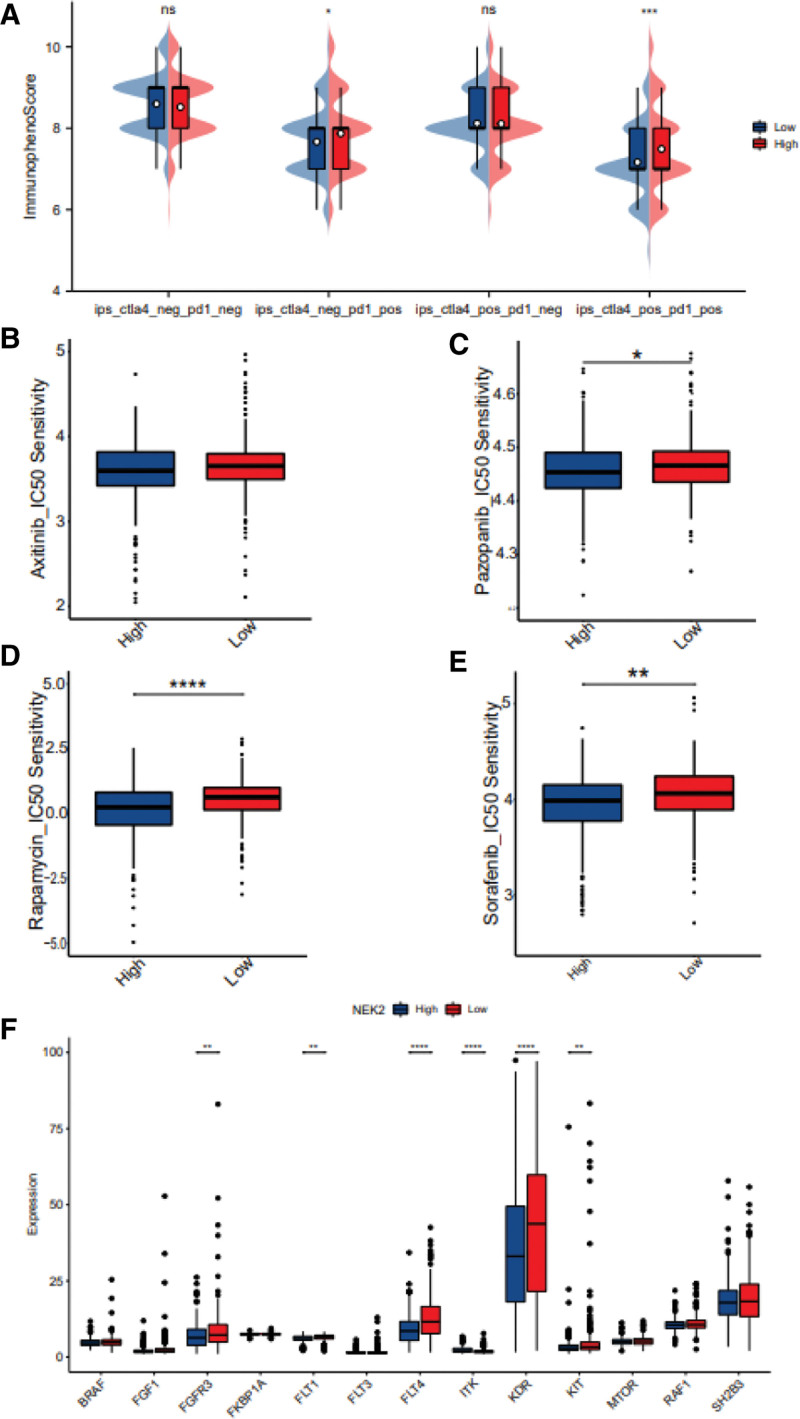
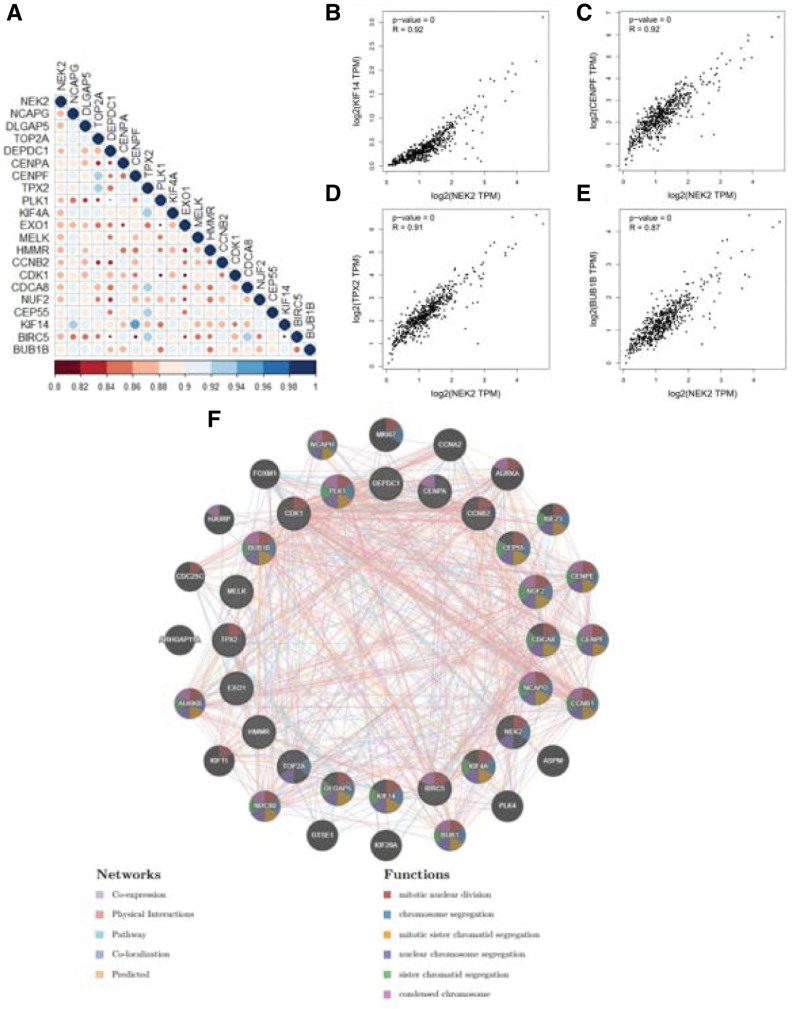
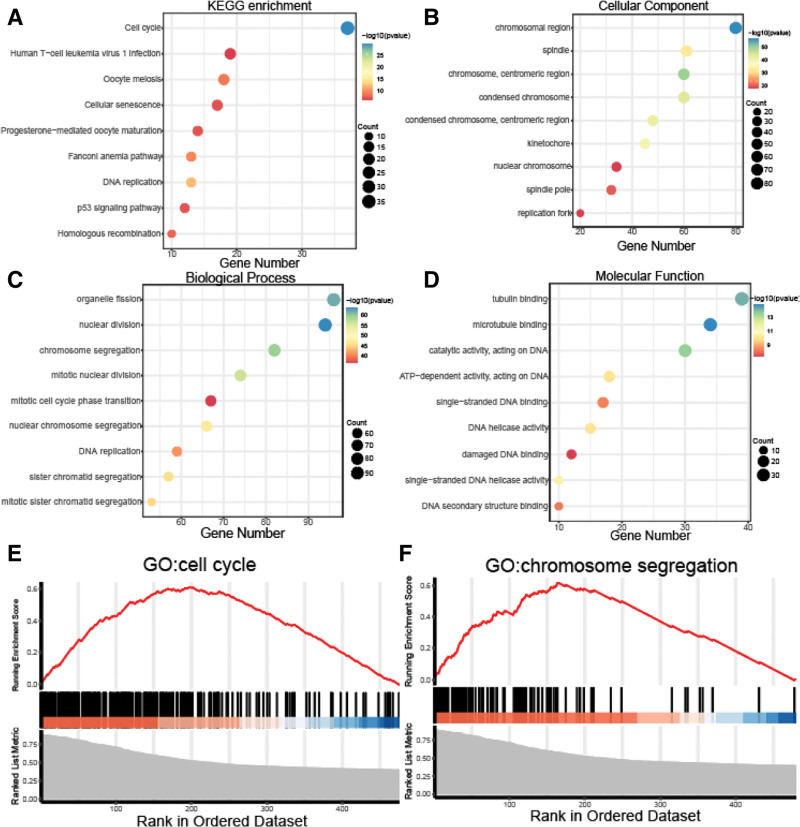
Methods: We downloaded clinical data from the gene expression omnibus (GEO) and TCGA databases together with transcriptional and mutational datasets. Strongly coexpressed genes with NEK2 were extracted from TCGA-KIRC cohort, and were submitted to Gene Ontology (GO) and Kyoto Encyclopedia of Genes and Genomes (KEGG) for functional analyses. According to NEK2 levels, the survival status, mutational characteristics, response to immunotherapy and sensitivity to drugs of the patients were studied. The potential correlations between NEK2 levels and immune cell state as well as immune cell infiltration were examined using the GEPIA, TIMER and TISIDB databases. Double immunofluorescence (IF) was performed to identify the NEK2 overexpression and relationship with CD8 in ccRCC.
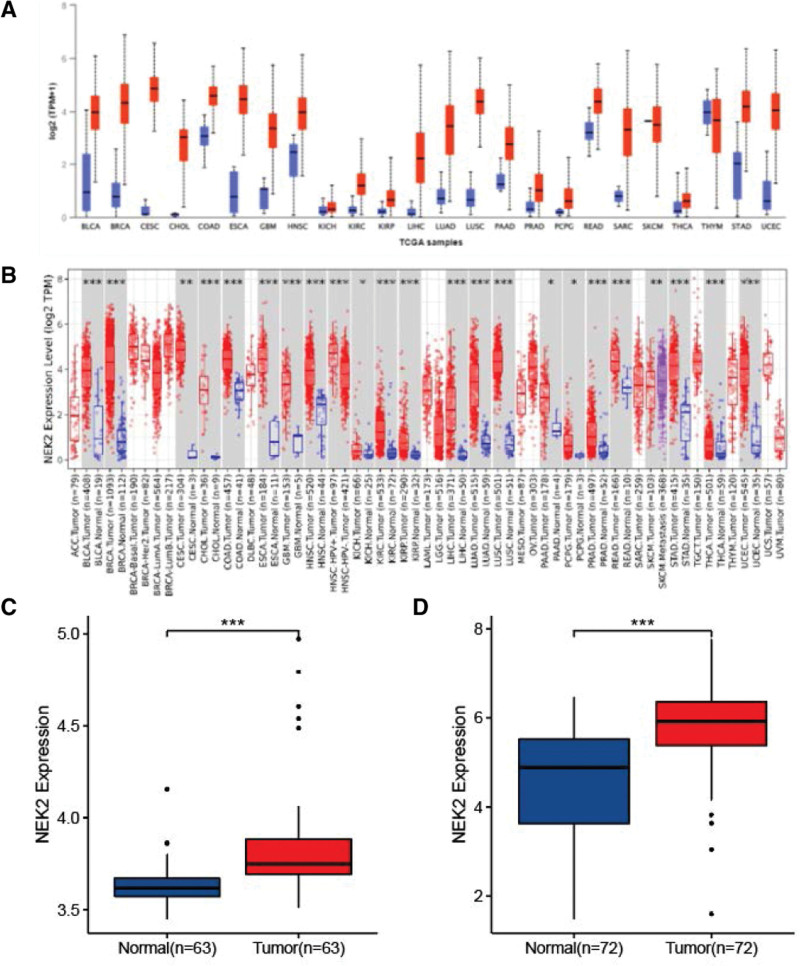
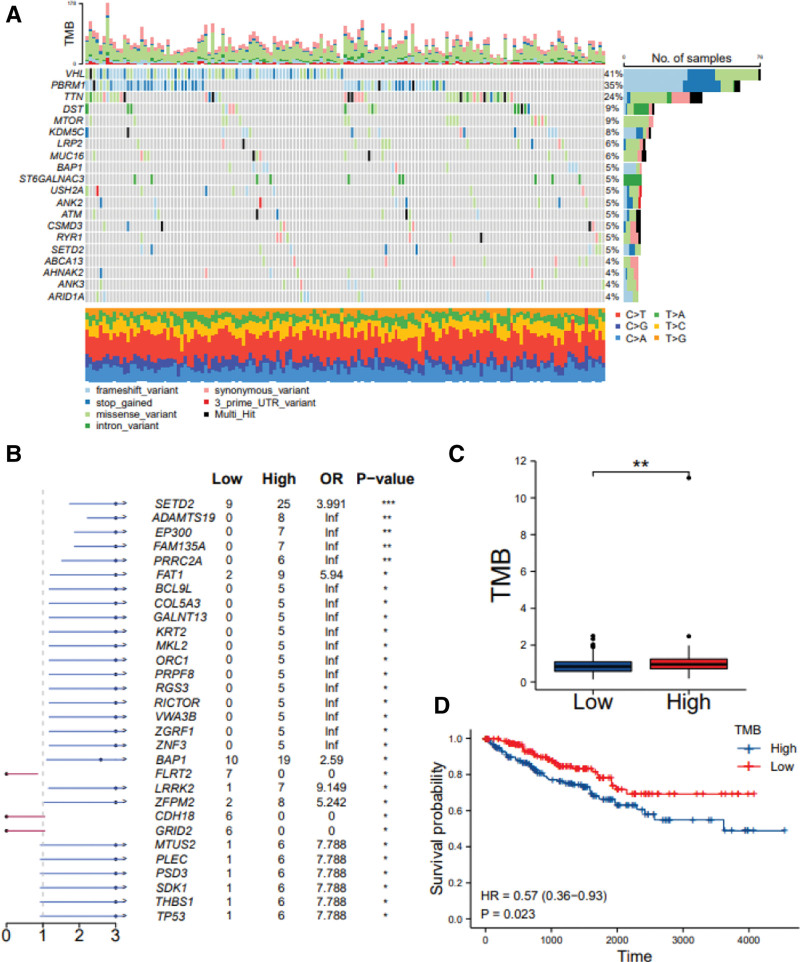
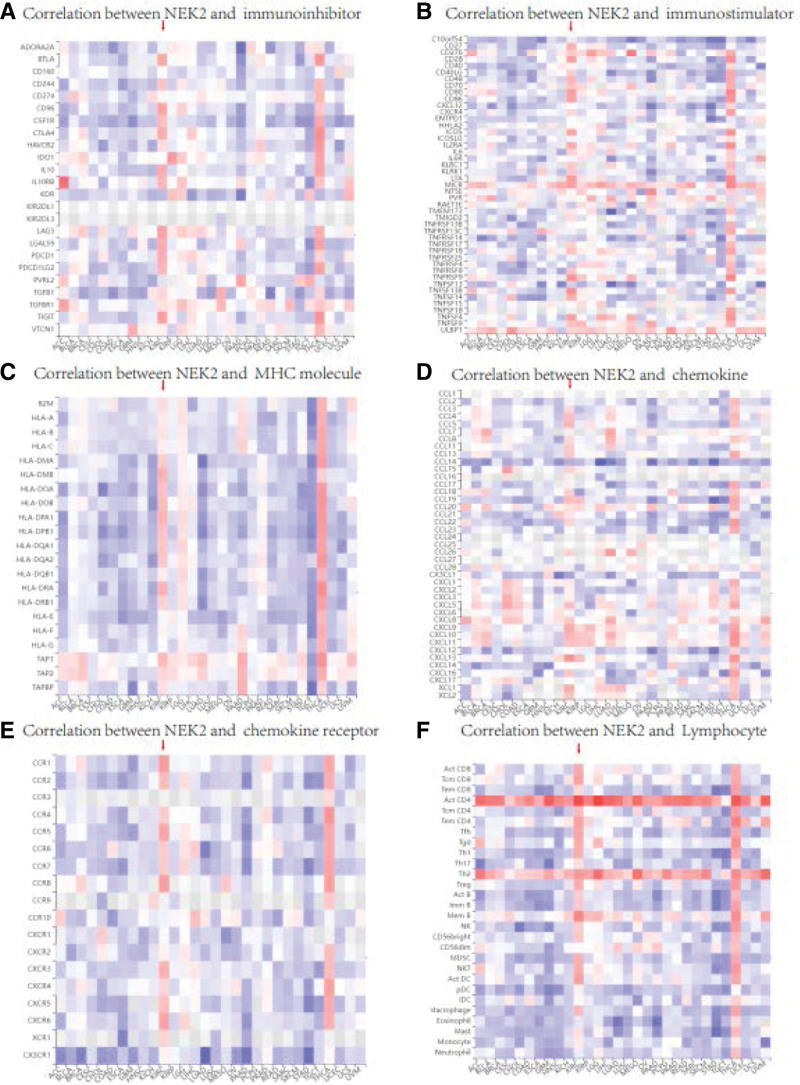
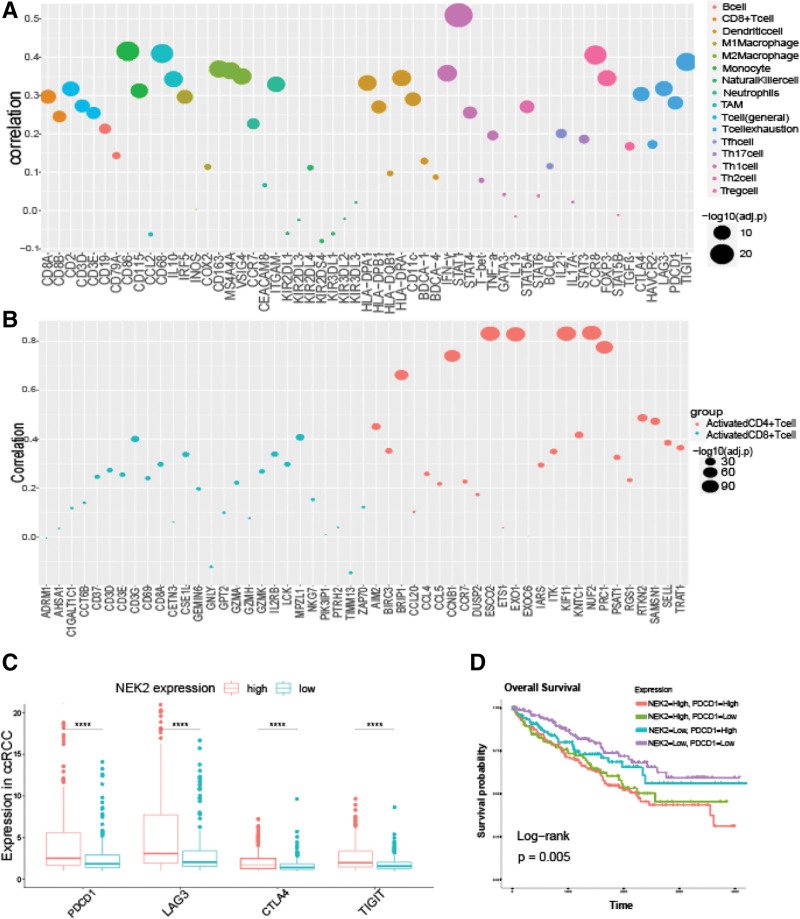
Results: The NEK2 gene was overexpressed and would enhance the nuclear division and cell cycle activities in ccRCC. ccRCC patients with high NEK2 expression had worse clinical outcomes, higher mutation burden and better therapeutic response. Moreover, NEK2 gene overexpression was positively related to various immune cell marker sets, which was also proved by validation cohort, and more infiltration of various immune cells.
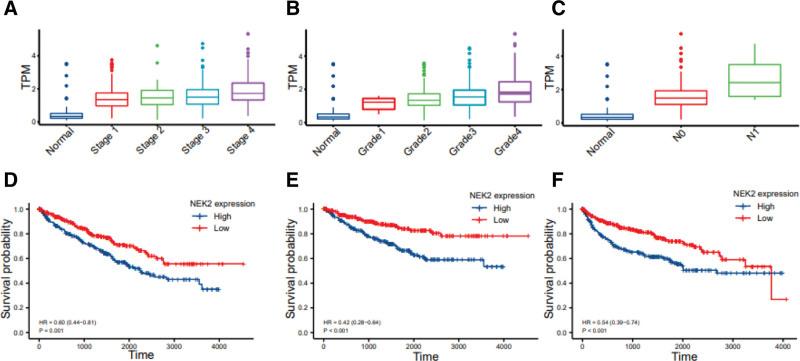
Conclusion: ccRCC patients with NEK2 high expression have a poorer prognosis than those with NEK2 low expression, resulting from its function of promoting proliferation, accompanied by increased infiltration of CD8 + T cells and Tregs and T-cell exhaustion and will respond better to proper treatments.
Copyright © 2024 the Author(s). Published by Wolters Kluwer Health, Inc.
Conflict of interest statement
The authors have no conflicts of interest to disclose.
Figures
Similar articles
-
Overexpression of NEK2 is correlated with poor prognosis in human clear cell renal cell carcinoma.Int J Immunopathol Pharmacol. 2021 Jan-Dec;35:20587384211065893. doi: 10.1177/20587384211065893. Int J Immunopathol Pharmacol. 2021. PMID: 34910592 Free PMC article.
-
Prognostic value and immune infiltration of the NEK family in clear cell renal cell carcinoma.Medicine (Baltimore). 2024 Jul 19;103(29):e38961. doi: 10.1097/MD.0000000000038961. Medicine (Baltimore). 2024. PMID: 39029088 Free PMC article.
-
Prognostic value of KLFs family genes in renal clear cell carcinoma.Sci Rep. 2024 Aug 30;14(1):20204. doi: 10.1038/s41598-024-69892-5. Sci Rep. 2024. PMID: 39215019 Free PMC article.
-
Low expression of ferritinophagy-related NCOA4 gene in relation to unfavorable outcome and defective immune cells infiltration in clear cell renal carcinoma.BMC Cancer. 2021 Jan 5;21(1):18. doi: 10.1186/s12885-020-07726-z. BMC Cancer. 2021. PMID: 33402128 Free PMC article.
-
POLD1 as a Prognostic Biomarker Correlated with Cell Proliferation and Immune Infiltration in Clear Cell Renal Cell Carcinoma.Int J Mol Sci. 2023 Apr 6;24(7):6849. doi: 10.3390/ijms24076849. Int J Mol Sci. 2023. PMID: 37047824 Free PMC article.
References
-
- Sung H, Ferlay J, Siegel RL, et al. . Global cancer statistics 2020: GLOBOCAN estimates of incidence and mortality worldwide for 36 cancers in 185 countries. CA Cancer J Clin. 2021;71:209–49. - PubMed
-
- Linehan WM, Ricketts CJ. The Cancer Genome Atlas of renal cell carcinoma: findings and clinical implications. Nat Rev Urol. 2019;16:539–52. - PubMed
-
- di Meo NA, Lasorsa F, Rutigliano M, et al. . The dark side of lipid metabolism in prostate and renal carcinoma: novel insights into molecular diagnostic and biomarker discovery. Expert Rev Mol Diagn. 2023;23:297–313. - PubMed
MeSH terms
Substances
LinkOut - more resources
Full Text Sources
Medical
Research Materials
Miscellaneous