

Quantification of healthspan in aging mice: introducing FAMY and GRAIL
- PMID: 38755467
- PMCID: PMC11336093
- DOI: 10.1007/s11357-024-01200-5
Quantification of healthspan in aging mice: introducing FAMY and GRAIL
Abstract
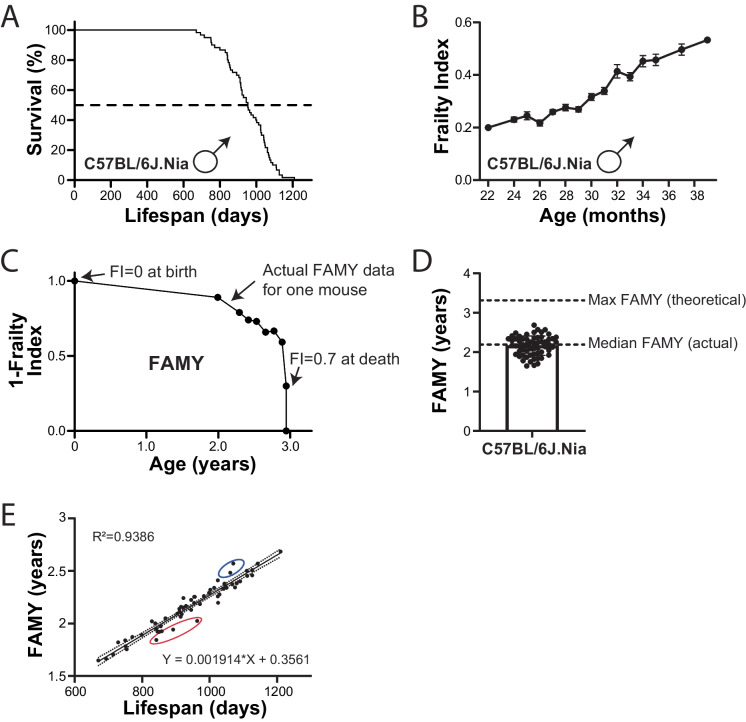
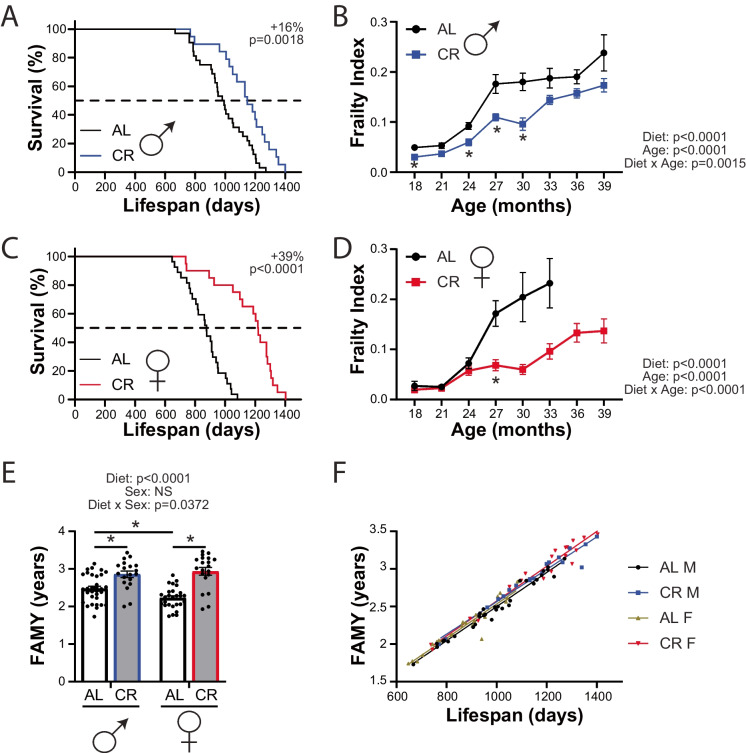
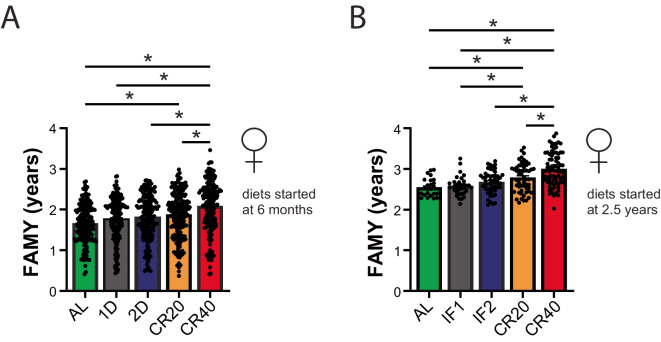
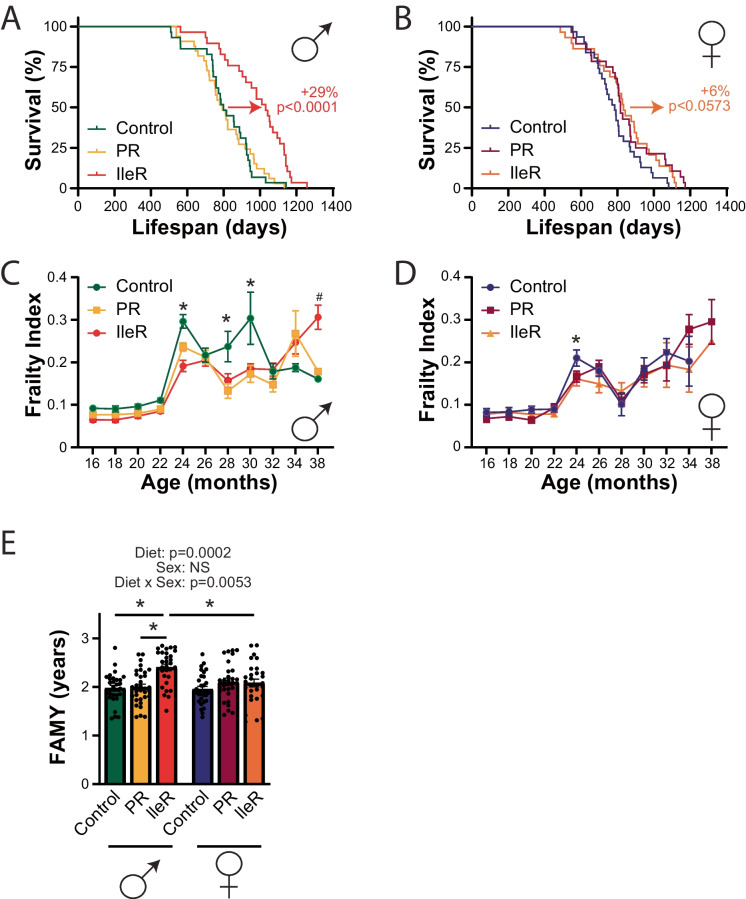
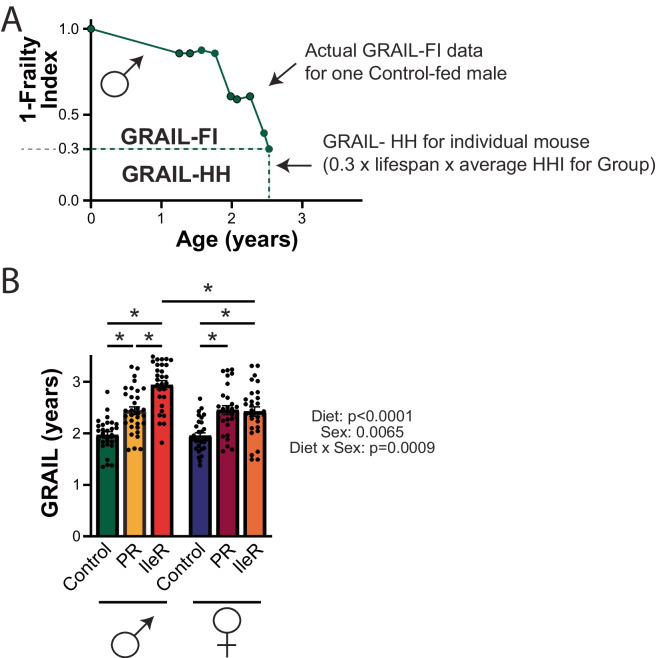
The population around the world is graying, and as many of these individuals will spend years suffering from the burdens of age associated diseases, understanding how to increase healthspan, defined as the period of life free from disease and disability, is an urgent priority of geroscience research. The lack of agreed-upon quantitative metrics for measuring healthspan in aging mice has slowed progress in identifying interventions that do not simply increase lifespan, but also healthspan. Here, we define FAMY (Frailty-Adjusted Mouse Years) and GRAIL (Gauging Robust Aging when Increasing Lifespan) as new summary statistics for quantifying healthspan in mice. FAMY integrates lifespan data with longitudinal measurements of a widely utilized clinical frailty index, while GRAIL incorporates these measures and also adds information from widely utilized healthspan assays and the hallmarks of aging. Both metrics are conceptually similar to quality-adjusted life years (QALY), a widely utilized measure of disease burden in humans, and can be readily calculated from data acquired during longitudinal and cross-sectional studies of mouse aging. We find that interventions generally thought to promote health, including calorie restriction, robustly improve healthspan as measured by FAMY and GRAIL. Finally, we show that the use of GRAIL provides new insights, and identify dietary restriction of protein or isoleucine as interventions that robustly promote healthspan but not longevity in female HET3 mice. We suggest that the routine integration of these measures into studies of aging in mice will allow the identification and development of interventions that promote healthy aging even in the absence of increased lifespan.
Keywords: Calorie restriction; Frailty; Healthspan; Isoleucine restriction; Lifespan.
© 2024. The Author(s), under exclusive licence to American Aging Association.
Conflict of interest statement
DWL has received funding from, and is a scientific advisory board member of, Aeovian Pharmaceuticals, which seeks to develop novel, selective mTOR inhibitors for the treatment of various diseases.
Figures
Update of
-
Quantification of healthspan in aging mice: Introducing FAMY and GRAIL.bioRxiv [Preprint]. 2024 Mar 17:2023.11.07.566044. doi: 10.1101/2023.11.07.566044. bioRxiv. 2024. Update in: Geroscience. 2024 Oct;46(5):4203-4215. doi: 10.1007/s11357-024-01200-5. PMID: 37986745 Free PMC article. Updated. Preprint.
Similar articles
-
Quantification of healthspan in aging mice: Introducing FAMY and GRAIL.bioRxiv [Preprint]. 2024 Mar 17:2023.11.07.566044. doi: 10.1101/2023.11.07.566044. bioRxiv. 2024. Update in: Geroscience. 2024 Oct;46(5):4203-4215. doi: 10.1007/s11357-024-01200-5. PMID: 37986745 Free PMC article. Updated. Preprint.
-
Depressing time: Waiting, melancholia, and the psychoanalytic practice of care.In: Kirtsoglou E, Simpson B, editors. The Time of Anthropology: Studies of Contemporary Chronopolitics. Abingdon: Routledge; 2020. Chapter 5. In: Kirtsoglou E, Simpson B, editors. The Time of Anthropology: Studies of Contemporary Chronopolitics. Abingdon: Routledge; 2020. Chapter 5. PMID: 36137063 Free Books & Documents. Review.
-
Using Experience Sampling Methodology to Capture Disclosure Opportunities for Autistic Adults.Autism Adulthood. 2023 Dec 1;5(4):389-400. doi: 10.1089/aut.2022.0090. Epub 2023 Dec 12. Autism Adulthood. 2023. PMID: 38116059 Free PMC article.
-
Defining the optimum strategy for identifying adults and children with coeliac disease: systematic review and economic modelling.Health Technol Assess. 2022 Oct;26(44):1-310. doi: 10.3310/ZUCE8371. Health Technol Assess. 2022. PMID: 36321689 Free PMC article.
-
The effectiveness of abstinence-based and harm reduction-based interventions in reducing problematic substance use in adults who are experiencing homelessness in high income countries: A systematic review and meta-analysis: A systematic review.Campbell Syst Rev. 2024 Apr 21;20(2):e1396. doi: 10.1002/cl2.1396. eCollection 2024 Jun. Campbell Syst Rev. 2024. PMID: 38645303 Free PMC article. Review.
Cited by
-
The Fourth Annual Symposium of the Midwest Aging Consortium.J Gerontol A Biol Sci Med Sci. 2024 Nov 1;79(11):glae236. doi: 10.1093/gerona/glae236. J Gerontol A Biol Sci Med Sci. 2024. PMID: 39498863 Free PMC article.
-
Longitudinal Fragility Phenotyping Predicts Lifespan and Age-Associated Morbidity in C57BL/6 and Diversity Outbred Mice.bioRxiv [Preprint]. 2024 Feb 8:2024.02.06.579096. doi: 10.1101/2024.02.06.579096. bioRxiv. 2024. Update in: Geroscience. 2024 Oct;46(5):4937-4954. doi: 10.1007/s11357-024-01226-9. PMID: 38370707 Free PMC article. Updated. Preprint.
References
MeSH terms
Grants and funding
LinkOut - more resources
Full Text Sources
Medical
