. 2024 May 16;7(1):584.
doi: 10.1038/s42003-024-06282-7.

B cell heterogeneity in human tuberculosis highlights compartment-specific phenotype and functional roles

Affiliations

B cell heterogeneity in human tuberculosis highlights compartment-specific phenotype and functional roles

Robert Krause et al. Commun Biol. .

Abstract

B cells are important in tuberculosis (TB) immunity, but their role in the human lung is understudied. Here, we characterize B cells from lung tissue and matched blood of patients with TB and found they are decreased in the blood and increased in the lungs, consistent with recruitment to infected tissue, where they are located in granuloma associated lymphoid tissue. Flow cytometry and transcriptomics identify multiple B cell populations in the lung, including those associated with tissue resident memory, germinal centers, antibody secretion, proinflammatory atypical B cells, and regulatory B cells, some of which are expanded in TB disease. Additionally, TB lungs contain high levels of Mtb-reactive antibodies, specifically IgM, which promotes Mtb phagocytosis. Overall, these data reveal the presence of functionally diverse B cell subsets in the lungs of patients with TB and suggest several potential localized roles that may represent a target for interventions to promote immunity or mitigate immunopathology.


Conflict of interest statement

The authors declare no competing interests.

Figures

Fig. 1
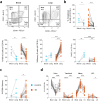
Fig. 1. Frequencies of CD19+ B cells differ between blood and lung compartments.
a Representative flow plots identifying CD19+ B cells from peripheral blood mononuclear cells (PBMC) and resected lung tissue. b B cell frequencies in the blood were compared for a set of healthy controls (HC, n = 6), patients with latent TB (LTBI, n = 10) or active TB (ATBI, n = 15), demonstrating reduced circulating B cells in active TB. c B cell frequencies were compared for lung tissue versus matched blood of cancer control patients (in cyan, n = 8) and patients with TB (in red, n = 60). B cell numbers were increased in the lung compared to the blood in patients with TB, and also relative to cancer control lung tissue. d In contrast, comparative frequencies of CD3+ T cells between lung tissue and matched blood of patients with TB showed no significant difference. Statistical analyses were performed using the Mann–Whitney test between unmatched samples and the Wilcoxon test for matched/paired samples. P values are denoted by ** <0.01.
Fig. 2
Fig. 2. Immunohistochemistry of human lung tissue resection from a patient with TB demonstrates B cell aggregates adjacent to the granuloma.
a Serial sections of lung tissue from patients with TB were stained for macrophages (anti-CD68), leucocytes (anti-CD45), B cells (anti-CD20), T cells (anti-CD3) and dendritic cells (anti-CD21). b The diaminobenzidine (DAB) stained cells were enumerated and expressed as % DAB positive cells of total nucleated (haematoxylin+) cells, per total slide area imaged. The relative frequencies from a total of five different tissue samples from patients with TB are compared.
Fig. 3
Fig. 3. B cell transitional, naive, memory and antibody-secreting cell population frequency demonstrates differences between compartments that are mainly disease-independent.
a Representative flow plots of the canonical transitional (Trans), naive, memory (Mem) and antibody-secreting cell (ASC) B cell phenotypes derived from staining CD19+ B cells with CD27 and CD38 (cancer control in cyan, n = 8; patients with TB in red, n = 60). b The relative frequencies of these four B cell phenotypes were compared between blood and lung tissue compartments. c The frequency of CD69+ memory B cells was assessed (cancer control in cyan, n = 5; patients with TB in red, n = 25). d This analysis was extended to lung draining lymph nodes (LN, n = 17) from the TB cohort for comparison. A representative gating strategy for LN derived B cells is included as Supplementary Fig. 2. Statistical analyses were performed using the Mann–Whitney test between unmatched samples, the Wilcoxon test for matched/paired samples and a three-way Kruskal–Wallis comparison. P values are denoted by * ≤0.05; ** <0.01; *** <0.001 and **** <0.0001.
Fig. 4
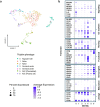
Fig. 4. Differential gene expression identifies subclusters amongst B cells isolated from human lung tissue from patients with TB.
scRNA sequencing was used to explore the differentially expressed genes in B cells isolated from human lung tissue from patients with TB (n = 9). a B cells were clustered based on their differential gene expression and visualised by UMAP with a total of seven putative clusters identified (0 to 6). b These B cell clusters were interogated for their expression of specific B cell-associated genes to delineate their likely functions.
Fig. 5
Fig. 5. tSNE plot comparison of B cell phenotypes further refines blood and lung tissue associated compartments.
In order to study the complexity of the B cell phenotypes associated with blood and lung tissue compartments of patients with TB, three separate flow cytometry phenotyping panels were used. a Assesed the level of maturation of the B cells, b the expression of different homing markers and c the relative expression of regulatory markers. The different B cell populations were clustered spatially using tSNE, with a single patient presented here, followed by a key describing the major phenotypes each of which is assigned a different colour. The relative expression of the specific markers associated with each phenotype were plotted alongside in a heatmap. Since the blood and lung samples were concatenated into a single file, the relative frequencies of cells in the blood or lung tissue compartment could be compared as shown alongside the heatmap.
Fig. 6
Fig. 6. tSNE-derived unique B cell phenotypes associated with the blood or lung compartment of patients with TB.
a Double negative (DN) B cells (CD27-IgD-) were assessed and the activated (DN2) phenotype (CD21-CD11c+) was enriched in the lungs of patients with TB. b GC homing (CXCR4+CXCR5+) transitional and naive B cells were enriched in the blood compartment. c The blood compartment was enriched for a tranistional regulatory (CD24+CD38+) population. d The lung compartment contained a unique activated B cell memory (CD27+CXCR5+CD62L-CD69+CCR6+CCR7+) population. e Lung-derived ASC populations expressed a CXCR3+CD62L- phenotype relative to the blood-derived counterparts. Other B cell phenotypes associated with regulatory functions were enriched in the lung, including f a CD5+ phenotype (CD5hiCD40-CD1d+) and g a CD27+ regulatory population (CD27+CD24+FasL+PDL1+). A set of 13 samples from patients with TB were used in these analyses. Statistical analyses were performed using the Wilcoxon test for matched/paired samples. P values are denoted by * ≤0.05 and ** <0.01.
Fig. 7
Fig. 7. B cells contribute to host control of Mtb in healthy donors in a 3D biomimetic model, but in patients with TB the effect is highly variable.
a Comparatively, Mtb grew more rapidly in PBMC derived from patients with TB. B cells were depleted from PBMCs, of which four donors were healthy and four had active TB, and compared to undepleted PBMCs. b Representative FACS plots of the depletion process. c B cell depletion leads to significantly higher Mtb growth in a healthy donor PBMC sample, representative of four healthy donors. d Mtb outgrowth data at day 7 from a total of four PBMC donors from each group are summarized, demonstrating the highly variable effect of B cell depletion in patients with TB. Data were normalized to the undepleted control group and compared by Wilcoxon matched-pairs signed rank test. Standard deviation is presented in (c). P values are denoted by * ≤0.05; ** <0.01 and **** <0.0001.
Fig. 8
Fig. 8. Mature CD138+ plasma cells are enriched in the lung tissue, resulting in an upregulated Mtb specific antibody response that enhances Mtb phagocytosis.
a The tissue residence marker CD69 was expressed on antibody-secreting cells (ASC), with the majority displaying a mature plasma cell CD138+ phenotype in both cancer controls (n = 8) and patients with TB (n = 13 to 25). b Antibodies were isolated from homogenised lung tissue supernatants using a thiophilic resin, with example elution profiles from five lungs measured at 280 nm, and then examined on a reducing 12.5% SDS-PAGE gel. The molecular weight marker (lane M), was followed by the initial lung homogenate supernatant sample (lane 1), the unbound sample (lane 2) followed by the eluted fractions 1–5 from the elution profile alongside (lanes 3–7). c Peak eluents (lane 1) were tested for the presence of IgM, IgD, IgG and IgA using class-specific secondary antibodies by western blot. d Mtb-specific antibody binding was investigated in lung samples from cancer controls (n = 6) and patients with TB (n = 10), detecting both total reactivity and e class-specific responses in a direct ELISA-based approach, expressed as area under the curve (AUC). An equal concentration range (100 to 0.8 µg/ml) of isolated antibody was used to standardize the assay and allow for comparison between patients. Antibody frequencies were compared by Mann–Whitney test. f Mtb phagocytosis by PBMCs was compared between untreated Mtb versus Mtb treated with non-specific immunoglobulin (NSIg) or lung immunoglobulin (LIg) from patients with TB. The lung-derived immunoglobulin increased phagocytosis, while non-specific immunoglobulin had no effect. Data are presented as summary data from five immunoglobulin samples from patients with TB, tested with three different PBMC donors, with each experiment done in quadruplicate and infectivity was measured by luminescence. Data were normalized to the media control and the donor matched mean differences were compared by one-way ANOVA. g Representative Mtb growth using immunoglobulin from patients with TB comparing with untreated and non-specific immunoglobulin in the 3D biomimetic model of TB. h Mtb luminescence at day 8 normalized to day 0 initial infectious load shows no overall difference in growth rate over time. P values are denoted by * ≤0.05; ** <0.01; *** <0.001 and **** <0.0001.

Similar articles

Cited by

References

    1. Organization, W. H. Global Tuberculosis Report 2022 (2022).
    1. O’Garra A, et al. The immune response in tuberculosis. Annu. Rev. Immunol. 2013;31:475–527. doi: 10.1146/annurev-immunol-032712-095939. - DOI - PubMed
    1. Swanson RV, et al. Antigen-specific B cells direct T follicular-like helper cells into lymphoid follicles to mediate Mycobacterium tuberculosis control. Nat. Immunol. 2023;24:855–868. doi: 10.1038/s41590-023-01476-3. - DOI - PMC - PubMed
    1. Choreno-Parra JA, et al. Mycobacterium tuberculosis HN878 infection induces human-like B-cell follicles in mice. J. Infect. Dis. 2020;221:1636–1646. doi: 10.1093/infdis/jiz663. - DOI - PMC - PubMed
    1. Hertz D, Dibbern J, Eggers L, von Borstel L, Schneider BE. Increased male susceptibility to Mycobacterium tuberculosis infection is associated with smaller B cell follicles in the lungs. Sci. Rep. 2020;10:5142. doi: 10.1038/s41598-020-61503-3. - DOI - PMC - PubMed

Publication types

MeSH terms