. 2024 May 17;384(6697):eadk0582.
doi: 10.1126/science.adk0582. Epub 2024 May 17.

mRNA-LNP HIV-1 trimer boosters elicit precursors to broad neutralizing antibodies

Affiliations

mRNA-LNP HIV-1 trimer boosters elicit precursors to broad neutralizing antibodies

Zhenfei Xie et al. Science. .

Abstract

Germline-targeting (GT) HIV vaccine strategies are predicated on deriving broadly neutralizing antibodies (bnAbs) through multiple boost immunogens. However, as the recruitment of memory B cells (MBCs) to germinal centers (GCs) is inefficient and may be derailed by serum antibody-induced epitope masking, driving further B cell receptor (BCR) modification in GC-experienced B cells after boosting poses a challenge. Using humanized immunoglobulin knockin mice, we found that GT protein trimer immunogen N332-GT5 could prime inferred-germline precursors to the V3-glycan-targeted bnAb BG18 and that B cells primed by N332-GT5 were effectively boosted by either of two novel protein immunogens designed to have minimum cross-reactivity with the off-target V1-binding responses. The delivery of the prime and boost immunogens as messenger RNA lipid nanoparticles (mRNA-LNPs) generated long-lasting GCs, somatic hypermutation, and affinity maturation and may be an effective tool in HIV vaccine development.


Conflict of interest statement

Competing Interests: J.S. and W.R.S are inventors on patent applications filed by TSRI and IAVI regarding the immunogens described here. S. H., A.C., S.F., and W.R.S. are current or past employees of Moderna, Inc. F.D.B. has consultancy relationships with Adimab, Third Rock Ventures, and The EMBO Journal.

Figures

Figure 1.
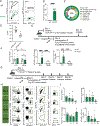
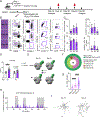
Figure 1.. N332-GT5 trimer protein can specifically and efficiently activate BG18gH B cells.
(A) Gating strategy to identify epitope-specific (N332-GT5+/N332-GT5-KO) B cells in BG18gH and WT mice. (B) Frequency of epitope-specific B cells in non-immunized BG18gH (n=12) and WT (n=5) mice. Welch’s t-test applied; error bars are SD. ****p < 0.0001. (C) Distribution of VH and VL genes in epitope-specific (GT5+KO) naive B cells in naive BG18gH mice. (D) SPR dissociation constants (KD) for N332-GT2 and GT5 trimer binding to epitope-specific Fabs derived from naive BG18gH cells. Each symbol corresponds to a different Fab and represents one or two measurements. Bars indicate geometric mean and geometric SEM; n=7. (E) Schematic of BG18gH and WT B cell adoptive transfer recipients immunized with GT5 and MD39 trimer protein. Data was collected from one experiment. (F) GC B cells, CD45.2+ B cells in GC and epitope-specific (GT5+KO) CD45.2+ cells as a percentage of total B cells in each condition 12 dpi WT (GT5 trimer), BG18gH (GT5 trimer), WT (MD39 trimer), BG18gH (MD39 trimer); n=6 in each group. 2-way ANOVA with Bonferroni multiple comparison test applied; bars indicate mean + SD, nsp >0.05, ***p < 0.001, ****p < 0.0001. (G) Schematic showing immunization with GT5 trimer protein. Samples were collected at day 7, 14, 21 and 49 for analysis. At least two independent experiments were performed, and representative data from one is shown. (H) Gating strategy showing GC B cells, CD45.2+ B cells in GC, CD45.2+ GT5 binders in GC and epitope binding specificity 7, 14, 21 and 49 dpi. (I) Frequency of GC B cells, CD45.2+ GC B cells, GT5+KO cells in GC CD45.2+ cells gated as in (H) and CD45.2+GT5+KO cells in total B cells 7, 14, 21 and 49 days after immunization with GT5 trimer protein. Each symbol represents a different mouse. Bars indicate mean + SD. n = 3 (day 49); others n=6.
Figure 2.
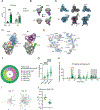
Figure 2.. N332-GT5 trimer protein drives BG18gH somatic hypermutation and affinity maturation.
(A) ELISA quantification of N332-GT5-specific IgG 16 and 42 dpi by N332-GT5 protein trimer. ΔAUC (Delta area under the curve) compared for N332-GT5 and N332-GT5-KO. Each symbol represents a different mouse: WT (triangle), BG18gH (circle). Samples are pooled from 2–3 experiments with 8–10 mice per group. 2-way ANOVA with Bonferroni multiple comparison test used; bars indicate mean + SD. *p < 0.05, **p < 0.01. (B) Composite nsEMPEM maps of serum pAb responses in immunized animals, 16 and 42 days after GT5 immunization. Sera were pooled for each timepoint: BG18gH (GT5), n=10; WT (GT5), n=8. (C) Cryo-EM reconstructions of polyclonal complexes presented in (B). pAbs from both timepoints were combined. Estimated resolutions: BG18 ~3.2 Å, WT ~ 4.2 Å. (D) Atomic models of BG18 or WT pAb backbones with their respective epitopes highlighted. V1 (HXB2 133–155) in orange, co-receptor GDIR motif (HXB2 324–327) in yellow. CDRH3 of each pAb highlighted in dark blue (BG18) or bright pink (WT). (E) Cryo-EM map of CDRH3 of BG18 mouse pAb with inferred germline BG18 monoclonal model (PDB 6dfh) relaxed into the density. (F–J) Sequencing and affinity of BCRs from epitope-specific CD45.2+ cells. (F) Nested pie chart of paired single-cell BCR sequences 42 dpi. Outer layer shows BG18 IGHV; inner layer murine IGKV. (G) Heavy chain AA mutations across all sites 14, 28 and 42 dpi. Statistical analysis made using Kruskal-Wallis test. Bars indicate mean; ****p < 0.0001. (H) Per site heavy chain AA mutation frequency 42 dpi. Red letters represent key BG18 mature or mature-like mutation; grey letters show other mutations on the key residue sites. CDRs are boxed in grey. (I) Phylogenetic trees of HCs 14 and 42 dpi. Tree scale (0.007 at left and 0.02 at right) indicates the number of substitutions per site. (J) SPR dissociation constants (KD) for Fabs derived from GT5+KO naive B cells in non-immunized BG18gH mice and GT5+KO GC CD45.2+ B cells in BG18gH adoptive transfer recipients 42 dpi. Each symbol corresponds to a different Fab and represents one or two measurements. Bars indicate geometric mean and geometric SEM; n=7 or 10 Fabs. The Kd values for non-immunized mice are reproduced from Fig. 1D for comparison.
Figure 3.
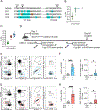
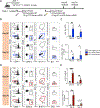
Figure 3.. Boosting with B11 or B16 protein trimers increases GC-resident BG18gH B cells.
(A) Mutations in B11 and B16 relative to BG505 are highlighted with the equivalent regions on GT5 shown for comparison. Orange indicates mutations that are only present in B16 that were selected for reduced binding to WT mouse serum that was immunized with GT2 or GT5. (B) SPR dissociation constants (KD) for GT2, GT5 and B11 trimer binding to epitope specific (GT2+KO) Fabs derived from WT GC B cells 10 dpi of GT2 trimer protein; n=6 Fabs. Dashed line indicates limit of detection (LOD). (C) SPR dissociation constants (KD) for GT5, B16 and B11 trimer binding to epitope-specific (GT5+KO) Fabs derived from GC CD45.2+ B cells 42 days after GT5 protein immunization of BG18gH B cell adoptive transfer recipient mice. Each symbol corresponds to a different Fab and represents one or two measurements. Bars indicate geometric mean and geometric SEM; n=10 Fabs. GT5 prime-only KD values are those presented in Fig. 2J. (D) Schematic showing BG18gH B cell adoptive transfer recipients primed with GT5 trimer protein on day 0, followed by boosting with B11 and B16 trimer protein on day 56. Samples from all treatments were collected on day 65 for analysis. (E) Representative flow cytometry plots of GC B cells, CD45.2+ cells in GC, B11 binders of GC CD45.2 cells and epitope binding specificity on day 65. (F) GC and B11-specific CD45.2+ GC B cells as a percentage of total B cells on day 65. Each symbol represents a different mouse: BG18gH (GT5 prime), BG18gH (B11 boost), n=11. Bars indicate mean + SD. Analyzed using Welch’s t test. *p <0.05, ****p < 0.0001. We have pooled data from two independent experiments. (G) Representative flow cytometry plots of GC B cells, CD45.2+ cells in GC, B16 binders of GC CD45.2 cells and epitope binding specificity on day 65. (H) GC and B16-specific CD45.2+ GC B cells as a percentage of total B cells on day 65. Each symbol represents a different mouse: BG18gH (GT5 prime), n=11; BG18gH (B16 boost), n=10; analysis otherwise as in (F). *p <0.05, ****p < 0.0001. We have pooled data from two independent experiments.
Figure 4.
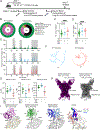
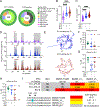
Figure 4.. B11 and B16 protein boosters increase BG18gH B cell SHM and affinity maturation.
(A) Schematic showing BG18gH B cell adoptive transfer recipients primed with GT5 trimer protein on day 0 and boosted with B11 or B16 trimer protein on day 42. Prime-only samples (green) were collected for analysis on day 42; boost samples (B16 = red; B11 = blue) were collected on day 77. Day 42 prime-only sequences are those presented in Figs. 2G & H and fig. S2G.(B) Nested pie chart showing paired BCR sequences on day 77 from Ag+ (antigen positive) KO CD45.2+ post-boost B cells. Outer layer represents BG18 IGHV; inner layer represents murine IGKV. (C–D) Heavy chain AA (C) and nt (D) mutations across all sites (source: BCRs sequenced from epitope-specific CD45.2+ B cells on day 42 for prime-only and 77 for boosted mice). Statistical analysis performed using Kruskal-Wallis test. Bars indicate mean. **p <0.01, ****p < 0.0001. (E) Per site heavy chain AA mutation frequency. Red letters represent key BG18 mature or mature-like mutation; grey letters show other mutations on the key residue sites. CDRs are boxed in grey. GT5 prime day 42 (top); B11 boost day 77 (middle); B16 boost day 77 (bottom). (F) Phylogenetic trees of post-boost HCs. Scale (values: 0.03) shows substitutions per site. (G) SPR dissociation constants (KD) for GT5, B11 and B16 trimer binding to Fabs derived from epitope-specific CD45.2+ B cells. Each symbol corresponds to a different Fab and represents one or two measurements. Bars indicate geometric mean and geometric SEM; n=10 or 12. Isolation on day 42 for prime-only and 77 for boosted mice. GT5 prime-only affinity data is as presented in Figs. 2J & 3C. (H) Cryo-EM reconstructions of Fabs derived from epitope specific CD45.2+ BG18 cells at day 77 after either B11 or B16 boost in complex with their respective immunogens. Estimated Fourier Shell Correlation resolutions are listed. (I) Comparison of cryo-EM models of B11 or B16 boost-derived Fabs with mature BG18 (PDB 6dfg). PNGS proximal to the binding epitopes and present in the trimer (B11, B16 or MD39) are highlighted.
Figure 5.
Figure 5.. Membrane-anchored N332-GT5 mRNA induces robust and durable humoral immune response in mice adoptively transferred with BG18gH B cells.
(A) Schematic showing the prime immunization regimen with membrane-anchored GT5 mRNA. FACS analyses were performed on days 14, 28, and 56 from inguinal or popliteal lymph nodes. Serum was collected on days 16 and 42. At least two independent replicates were performed on days 14, 16, 28, and 42; day 56 is from a single run. Representative data from one experiment is shown for flow cytometry below. (B) Gating strategy for GC size, CD45.2+ cells in GC, CD45.2 cells binding to GT5 probe and binding specificity. (C) Frequency of GCs, CD45.2+ B cells in GC, epitope-specific CD45.2 GC B cells and the CD45.2 epitope specific binders in total B cells. Each symbol represents a different mouse. Bars indicate mean + SD. n=5. (D) ELISA quantification of N332-GT5-epitope specific IgG in WT or BG18gH adoptively transferred mice 16 and 42 days after GT5 mRNA immunization. ΔAUC compared for N332-GT5 and N332-GT5-KO. Each symbol represents a different mouse: WT (triangle), BG18gH (circle). Samples are pooled from 2–3 experiments with 8–10 mice per group. Analysis used a 2-way ANOVA with Bonferroni multiple comparison test. Bars indicate mean + SD. ****p < 0.0001. (E) Composite figures from nsEMPEM analysis of polyclonal responses of serum collected from mice adoptively transferred with CD45.2 BG18gH or WT B cells. Antibody targeting V1/V3 (green) and base (purple) colorized. BG18gH (GT5 mRNA); WT (GT5 mRNA). Sera were pooled for each time point: BG18gH (GT5 mRNA), n=10; WT (GT5 mRNA), n=8. (F) Paired BCR V region sequence isolated from CD45.2 epitope specific binders (GT5+KO) 42 days after GT5 mRNA immunization. Outer layer represents BG18 IGHV; inner layer represents murine IGKVs. The number of sequences is in the pie chart center. (G) Heavy chain AA mutation number across all sites. Statistical analysis was made using Kruskal-Wallis test. Bars indicate mean. ****p < 0.0001. (H) Per site heavy chain AA mutation frequency 42 dpi. Red letters represent key BG18 mature or mature-like mutation; grey letters show other mutations on the key residue sites. CDRs are boxed in grey. (I) Phylogenetic trees of heavy chains 16 and 42 dpi. Tree scale (left, 0.008 and right, 0.03) indicates substitutions per site.
Figure 6.
Figure 6.. An mRNA prime followed by an mRNA boost generates a long-lasting HIV humoral immune response.
(A) Schematic of BG18gH B cell adoptive transfer recipients primed with GT5 mRNA on day 0, followed by boosting with B11 and B16 mRNA on day 42. Samples were collected on days 58 and 78 for analysis. Data was collected from one experiment. (B) Gating strategy for GC, CD45.2 cells in GC, B11-binders of CD45.2 cells in GC and epitope-binding specificity. (C) Quantification of GC size and B11-specific CD45.2+ GC B cell binders in total B cells. Each symbol represents a different mouse: BG18gH (GT5 mRNA prime), n=3; BG18gH (B11 mRNA boost), n=5 or 6. (D) Gating strategy for GC, CD45.2 cell in GC, B16 binders of CD45.2+ cells in GC and epitope-binding specificity. (E) Quantification of GC size and B16 specific CD45.2+ GC B cell binders in total B cells. Each symbol represents a different mouse: BG18gH (GT5 mRNA prime), n=3; BG18gH (B16 mRNA boost), n=5. Multiple t-tests without consistent SD assumptions used in C and E. Bars represent mean + SD, nsp >0.05, *p <0.05, **p < 0.01, ***p < 0.001, ****p < 0.0001.
Figure 7.
Figure 7.. B11 and B16 mRNA boosters drive BG18gH SHM and affinity maturation.
(A–G) BCRs isolated from epitope specific CD45.2+ B cells 42 days after GT5 (GT5+KO) mRNA prime and 36 days after B11 (B11+KO) or B16 (B16+KO) mRNA boosting (day 78). GT5 mRNA prime day 42 shown in purple; GT5 + B11 mRNA day 78 in blue; GT5 + B16 mRNA day 78 in red. (A) Day 42 prime-only BCR sequence data is as presented in Figs. 5G & H and S7E, and shown here for comparison. Outer circle represents BG18 IGHV; inner layer murine IGKVs. (B–C) Heavy chain (B) AA and (C) nt mutations across all sites. Analyzed using Kruskal-Wallis test; bars indicate mean. ****p < 0.0001 (D) Heavy chain per site AA mutation frequency. Red letters represent key BG18 mature or mature-like mutation; grey letters show other mutations on the key residue sites. CDRs are boxed in grey. (E) Phylogenetic trees of HCs. Tree scale (0.04 at top and 0.03 at bottom ) indicates substitutions per site. (F–H) SPR dissociation constants (KD) for GT5 (F), B11 (G) and B16 (H) trimer binding to Fabs derived from epitope specific CD45.2+ B cells of BG18gH B cell adoptively transferred recipient mice 42 days after GT5 protein prime or 36 days after B11 and B16 mRNA boosting. Each symbol corresponds to a different Fab and represents one or two measurements. Bars indicate geometric mean and geometric SEM; n=10; dashed lines indicate limit of detection (LOD). Prime-only affinity data used for comparison is as presented in Figs. 2J, 3C, and 4G. (I) Neutralization potency (IC50) of antibodies elicited 36 days post B11 mRNA boost against native (BG505 T332N) and V1 loop-modified pseudoviruses. IC50 is reported as the mean IC50 of two biological replicates. The positions of V1 loop PNGS on the pseudoviruses are indicated in the table. The sequences of the modified V1 loops are shown.

Comment in

  • Progress on priming HIV-1 immunity.
    Sanders RW, Moore JP. Sanders RW, et al. Science. 2024 May 17;384(6697):738-739. doi: 10.1126/science.adp3459. Epub 2024 May 16. Science. 2024. PMID: 38753801

Similar articles

Cited by

References

    1. Burton DR, Poignard P, Stanfield RL, Wilson IA, Broadly neutralizing antibodies suggest new prospects to counter highly antigenically diverse viruses. Science 337, 183–186 (2012). - PMC - PubMed
    1. Hoot S, McGuire AT, Cohen KW, Strong RK, Hangartner L, Klein F, Diskin R, Scheid JF, Sather DN, Burton DR, Stamatatos L, Recombinant HIV Envelope Proteins Fail to Engage Germline Versions of Anti-CD4bs bNAbs. PLOS Pathogens 9, e1003106 (2013). - PMC - PubMed
    1. Jardine JG, Julien J-P, Menis S, Ota T, Kalyuzhniy O, McGuire A, Sok D, Huang P-S, MacPherson S, Jones M, Nieusma T, Mathison J, Baker D, Ward AB, Burton DR, Stamatatos L, Nemazee D, Wilson IA, Schief WR, Rational HIV Immunogen Design to Target Specific Germline B Cell Receptors. Science 340, 711–716 (2013). - PMC - PubMed
    1. McGuire AT, Hoot S, Dreyer AM, Lippy A, Stuart A, Cohen KW, Jardine J, Menis S, Scheid JF, West AP, Schief WR, Stamatatos L, Engineering HIV envelope protein to activate germline B cell receptors of broadly neutralizing anti-CD4 binding site antibodies. J Exp Med 210, 655–663 (2013). - PMC - PubMed
    1. Pancera M, McLellan JS, Wu X, Zhu J, Changela A, Schmidt SD, Yang Y, Zhou T, Phogat S, Mascola JR, Kwong PD, Crystal Structure of PG16 and Chimeric Dissection with Somatically Related PG9: Structure-Function Analysis of Two Quaternary-Specific Antibodies That Effectively Neutralize HIV-1. J Virol 84, 8098–8110 (2010). - PMC - PubMed

MeSH terms

LinkOut - more resources