

This is a preprint.
Loop Catalog: a comprehensive HiChIP database of human and mouse samples
- PMID: 38746164
- PMCID: PMC11092438
- DOI: 10.1101/2024.04.26.591349
Loop Catalog: a comprehensive HiChIP database of human and mouse samples
Abstract
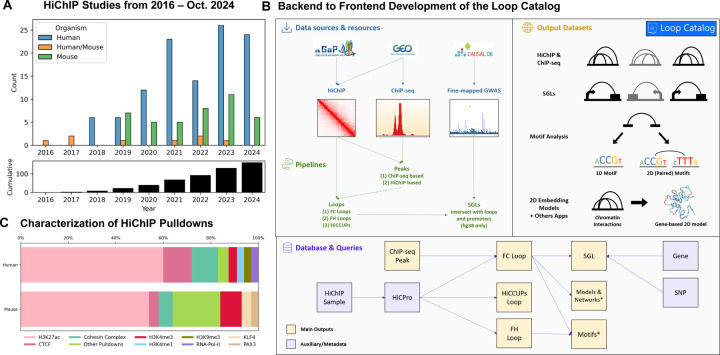
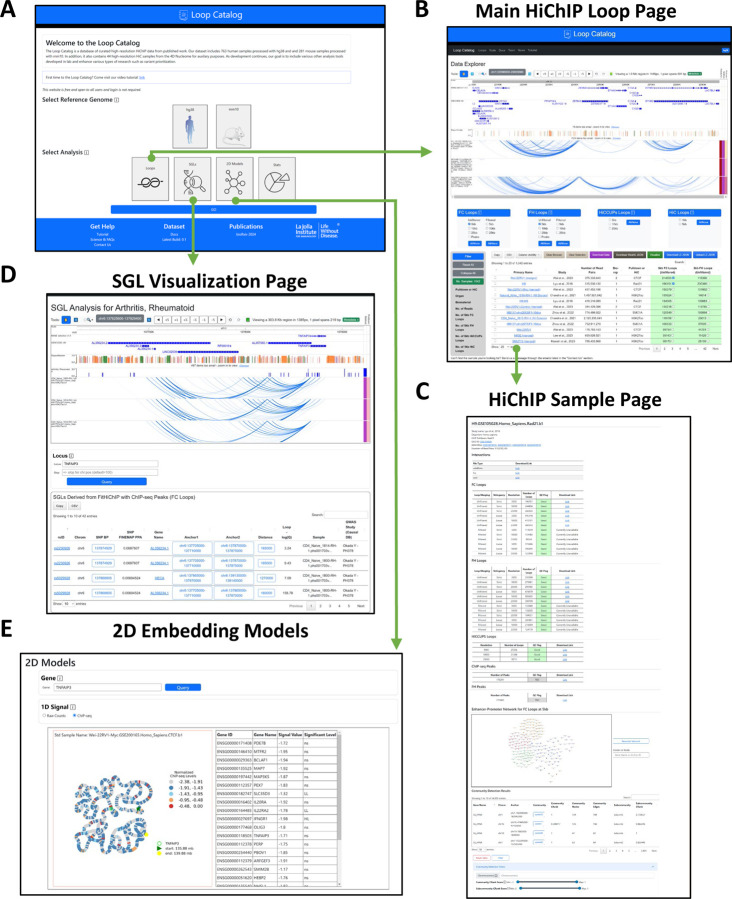
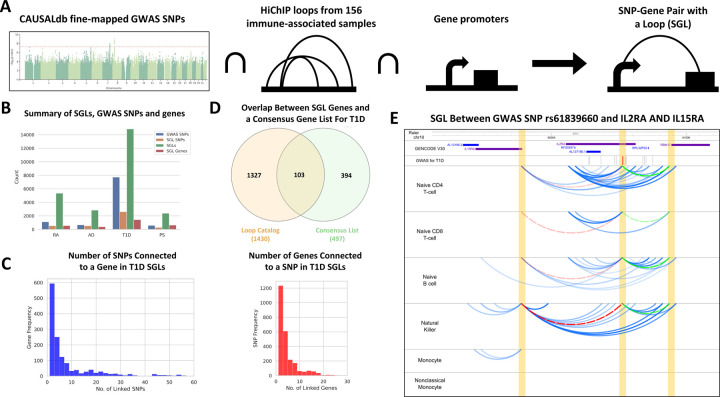
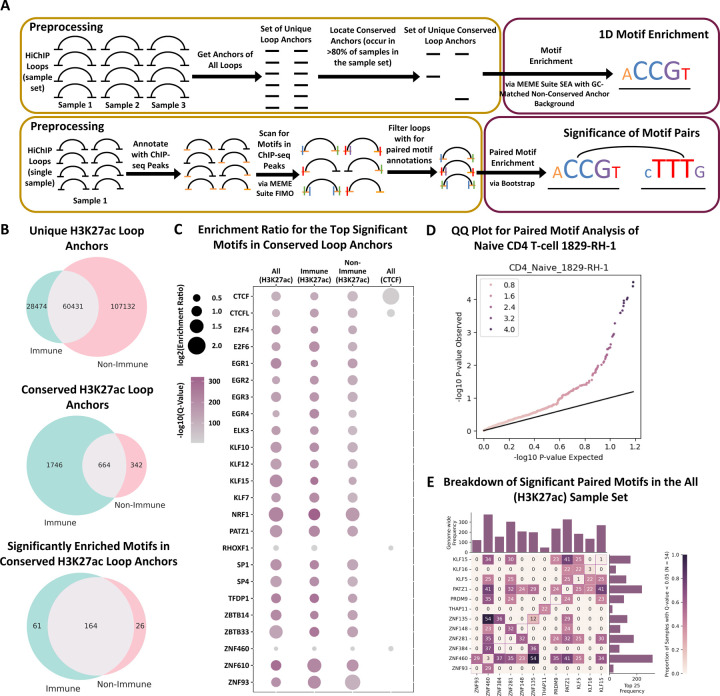
HiChIP enables cost-effective and high-resolution profiling of chromatin loops. To leverage the increasing number of HiChIP datasets, we developed Loop Catalog (https://loopcatalog.lji.org), a web-based database featuring loop calls from 1000+ distinct human and mouse HiChIP samples from 152 studies plus 44 high-resolution Hi-C samples. We demonstrate its utility for interpreting GWAS and eQTL variants through SNP-to-gene linking, identifying enriched sequence motifs and motif pairs, and generating regulatory networks and 2D representations of chromatin structure. Our catalog spans over 4.19M unique loops, and with embedded analysis modules, constitutes an important resource for the field.
Keywords: GWAS; HiChIP; SNP-to-gene linking; chromatin loops; database.
Conflict of interest statement
Competing interests: F.A. is an Editorial Board Member of Genome Biology.
Figures
Similar articles
-
EXPRESSO: a multi-omics database to explore multi-layered 3D genomic organization.Nucleic Acids Res. 2025 Jan 6;53(D1):D79-D90. doi: 10.1093/nar/gkae999. Nucleic Acids Res. 2025. PMID: 39498488 Free PMC article.
-
Primary osteoarthritis chondrocyte map of chromatin conformation reveals novel candidate effector genes.Ann Rheum Dis. 2024 Jul 15;83(8):1048-1059. doi: 10.1136/ard-2023-224945. Ann Rheum Dis. 2024. PMID: 38479789 Free PMC article.
-
A comprehensive study of common and rare genetic variants in spermatogenesis-related loci identifies new risk factors for idiopathic severe spermatogenic failure.Hum Reprod Open. 2024 Nov 13;2024(4):hoae069. doi: 10.1093/hropen/hoae069. eCollection 2024. Hum Reprod Open. 2024. PMID: 39678461 Free PMC article.
-
School-based education programmes for the prevention of unintentional injuries in children and young people.Cochrane Database Syst Rev. 2016 Dec 27;12(12):CD010246. doi: 10.1002/14651858.CD010246.pub2. Cochrane Database Syst Rev. 2016. PMID: 28026877 Free PMC article. Review.
-
Continuous infusion versus bolus injection of loop diuretics for acute heart failure.Cochrane Database Syst Rev. 2024 May 22;5(5):CD014811. doi: 10.1002/14651858.CD014811.pub2. Cochrane Database Syst Rev. 2024. PMID: 38775253 Review.
References
-
- Babbi G., Martelli P. L., Profiti G., Bovo S., Savojardo C., & Casadio R. (2017). eDGAR: A database of Disease-Gene Associations with annotated Relationships among genes. BMC Genomics, 18(Suppl 5), 554. 10.1038/s41467-018-04948-3 https://doi.org/10.1038/s41467-018-04948-5 - DOI - DOI - PMC - PubMed
-
- Barrett T., Wilhite S. E., Ledoux P., Evangelista C., Kim I. F., Tomashevsky M., Marshall K. A., Phillippy K. H., Sherman P. M., Holko M., Yefanov A., Lee H., Zhang N., Robertson C. L., Serova N., Davis S., & Soboleva A. (2013). NCBI GEO: Archive for functional genomics data sets--update. Nucleic Acids Research, 41(Database issue), D991–995. 10.1093/nar/gks1193 - DOI - PMC - PubMed
-
- Bell C. C., Balic J. J., Talarmain L., Gillespie A., Scolamiero L., Lam E. Y. N., Ang C.-S., Faulkner G. J., Gilan O., & Dawson M. A. (2024). Comparative cofactor screens show the influence of transactivation domains and core promoters on the mechanisms of transcription. Nature Genetics, 56(6), 1181–1192. 10.1038/s41588-024-01749-z - DOI - PubMed
Publication types
Grants and funding
LinkOut - more resources
Full Text Sources