

The Contribution of Scanning Force Microscopy on Dental Research: A Narrative Review
- PMID: 38730904
- PMCID: PMC11084532
- DOI: 10.3390/ma17092100
The Contribution of Scanning Force Microscopy on Dental Research: A Narrative Review
Abstract
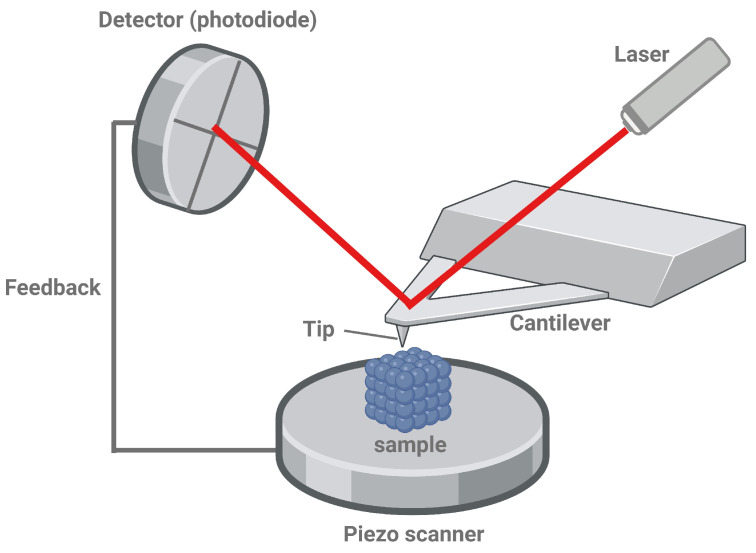
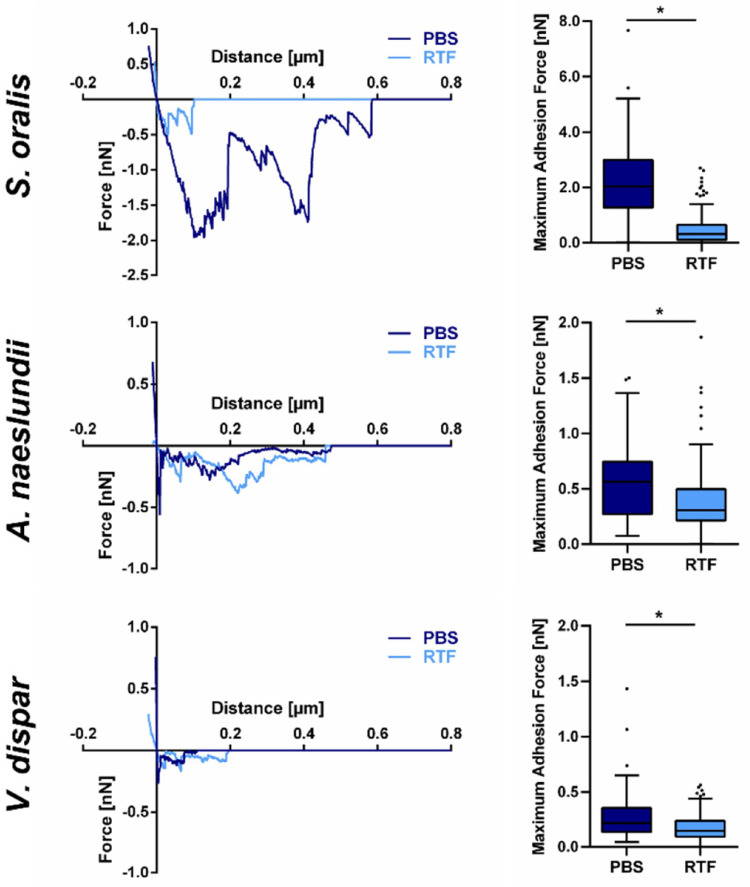
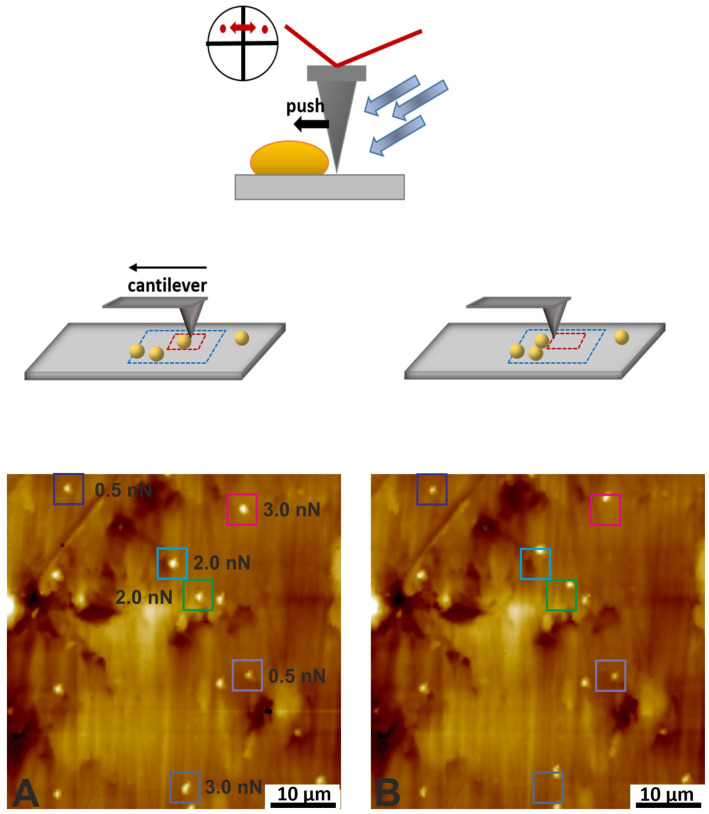
Scanning force microscopy (SFM) is one of the most widely used techniques in biomaterials research. In addition to imaging the materials of interest, SFM enables the mapping of mechanical properties and biological responses with sub-nanometer resolution and piconewton sensitivity. This review aims to give an overview of using the scanning force microscope (SFM) for investigations on dental materials. In particular, SFM-derived methods such as force-distance curves (scanning force spectroscopy), lateral force spectroscopy, and applications of the FluidFM® will be presented. In addition to the properties of dental materials, this paper reports the development of the pellicle by the interaction of biopolymers such as proteins and polysaccharides, as well as the interaction of bacteria with dental materials.
Keywords: dental biofilm; dental materials; dental research; pellicle; scanning force microscopy; scanning force spectroscopy; single-cell force spectroscopy.
Conflict of interest statement
The authors declare no conflicts of interest.
Figures
Similar articles
-
Physical-chemical interactions between dental materials surface, salivary pellicle and Streptococcus gordonii.Colloids Surf B Biointerfaces. 2020 Jun;190:110938. doi: 10.1016/j.colsurfb.2020.110938. Epub 2020 Mar 3. Colloids Surf B Biointerfaces. 2020. PMID: 32172164 Free PMC article.
-
Scanning force microscopy in the applied biological sciences.Biotechnol Adv. 2001 Oct;19(6):451-85. doi: 10.1016/s0734-9750(01)00077-5. Biotechnol Adv. 2001. PMID: 14538069
-
Calibration of the scanning (atomic) force microscope with gold particles.J Microsc. 1994 Mar;173(Pt 3):199-210. doi: 10.1111/j.1365-2818.1994.tb03442.x. J Microsc. 1994. PMID: 8189445
-
The composition of the dental pellicle: an updated literature review.Front Oral Health. 2023 Oct 12;4:1260442. doi: 10.3389/froh.2023.1260442. eCollection 2023. Front Oral Health. 2023. PMID: 37899941 Free PMC article. Review.
-
Scanning force microscopy of chromatin.Scanning Microsc. 1995 Sep;9(3):729-37; discussion 738-9. Scanning Microsc. 1995. PMID: 7501987 Review.
References
-
- Manappallil J.J. Basic Dental Materials. 4th ed. Jaypee Brothers Medical Publishers; New Delhi, India: 2015.
-
- Powers J.M., Wataha J.C., Chen Y.W. Dental Materials: Foundations and Applications. 11th ed. Elsevier; Maryland Heights, MO, USA: 2017.
Publication types
Grants and funding
LinkOut - more resources
Full Text Sources
