. 2024 May 10;15(1):3931.
doi: 10.1038/s41467-024-48258-5.

Regulation of Myc transcription by an enhancer cluster dedicated to pluripotency and early embryonic expression

Affiliations

Regulation of Myc transcription by an enhancer cluster dedicated to pluripotency and early embryonic expression

Lin Li-Bao et al. Nat Commun. .

Abstract

MYC plays various roles in pluripotent stem cells, including the promotion of somatic cell reprogramming to pluripotency, the regulation of cell competition and the control of embryonic diapause. However, how Myc expression is regulated in this context remains unknown. The Myc gene lies within a ~ 3-megabase gene desert with multiple cis-regulatory elements. Here we use genomic rearrangements, transgenesis and targeted mutation to analyse Myc regulation in early mouse embryos and pluripotent stem cells. We identify a topologically-associated region that homes enhancers dedicated to Myc transcriptional regulation in stem cells of the pre-implantation and early post-implantation embryo. Within this region, we identify elements exclusively dedicated to Myc regulation in pluripotent cells, with distinct enhancers that sequentially activate during naive and formative pluripotency. Deletion of pluripotency-specific enhancers dampens embryonic stem cell competitive ability. These results identify a topologically defined enhancer cluster dedicated to early embryonic expression and uncover a modular mechanism for the regulation of Myc expression in different states of pluripotency.


Conflict of interest statement

The authors declare no competing interests.

Figures

Fig. 1
Fig. 1. Chromosome rearrangement analysis in the 3 Mb gene desert and epigenetic landscape of the Myc locus and downstream sequences.
a Representation of the mouse genomic region containing the Myc and Pvt1 transcription units and its chromosomal location. Chromosome rearrangements and the BAC RP24-78D24 are also represented. bh Immunofluorescence against MYC protein in WT (b) and genomic rearrangement-containing E6.5 embryos, as indicated. Scale bar = 50 microns. N = 9 WT, 17 Inv1, 11 Inv1xMyc∆3 Mb, 13 ∆Cent3, 7 ∆40, 8 ∆11, 8 ∆21. Empty arrowheads indicate Myc expression in the extraembryonic visceral endoderm; solid arrowheads indicate the absence of Myc expression in the embryonic visceral endoderm. i Scaled representation of the Myc transcriptional unit (black arrow) and Pvt1 (gray arrow) in the genome and in BAC RP24-78D24. Below, H3K27ac (orange) and H3K4me1 (pink) distribution in EpiSCs (primed pluripotency), EpiLCs (formative pluripotency), and ESCs (naive pluripotency). P300 (dark green) binding in EpiLCs and ESCs (ref.). FOXD3 (light green), OCT4, NANOG and SOX2 (blue) binding in ESCs,. Putative cis-regulatory regions are shown as green boxes and classified into sub-clusters A to D.
Fig. 2
Fig. 2. Analysis of the regulatory activity of BAC RP24-78D24 sequences in mouse embryos and ESCs.
a Schemes of the WT Myc+/+; WT MycGFP/GFP and Myc+/+, Myc2TFP/2TFP genotypes. Confocal images showing the endogenous Myc expression pattern in E3.5 blastocysts revealed by GFP-MYC (b) and the transgenic Myc expression pattern revealed by TFP-MYC (b´) using simultaneous detection of native fluorescence and immunostaining against GFP/TFP. Scale bar = 30 microns. N = 5 MycGFP/GFP and 13 Myc+/+; Myc2TFP/2TFPembryos. c, c´ Confocal images showing immunostaining against GFP/TFP in GFP-MYC and TFP-MYC E6.5 embryos. Scale bar = 30 microns. N = 8 MycGFP/GFP and 9 Myc+/+; Myc2TFP/2TFP embryos. Empty arrowheads indicate Myc expression in the extraembryonic visceral endoderm; solid arrowheads indicate the absence of Myc expression in the embryonic visceral endoderm. d, d´ Confocal images showing immunostainings against GFP/TFP in GFP-MYC and TFP-MYC E9.5 embryos. Scale bar = 400 microns. N = 6 MycGFP/GFP and 10 Myc+/+; Myc2TFP/2TFP embryos. eg 3D reconstruction of the posterior embryonic buds of embryos shown in (d, d´). e, e´ Imaris 3D reconstruction show immunostaining against GFP/TFP of GFP-MYC and TFP-MYC. Scale bar = 300 microns. f, f´, Magnification of E9.5 somitic and pre-somitic region of MycGFP/GFP and Myc+/+; Myc2TFP/2TFP embryos. Scale bar = 100 microns. g, 3D reconstructions show immunostaining with anti-Brachyury + anti-SOX2 in the posterior bud. Scale bar = 300 microns. N = 3 MycGFP/GFP and 3 Myc+/+; Myc2TFP/2TFP embryos. h, h´´, Confocal images show GFP-MYC and TFP-MYC endogenous expression levels in Myc+/GFP; sMyc2TFP/+ mESCs cultured in SR + LIF (h), in SR + LIF+2i (h´) and in N2B27 + F/A (h´). Scale bar = 30 microns. Two independent clones were analyzed. i, i´´ Plots showing the correlation between GFP-MYC and TFP-MYC signals at the single-cell level in SR + LIF, SR + LIF+2i, and N2B27 + F/A culture conditions. The regression line is represented, and the coefficient of determination (R squared) is shown for each condition. The number of cells analyzed is shown in the graphs. j, k Violin plots show GFP-MYC (green) and TFP-MYC (blue) endogenous signals with median and quartiles in SR + LIF, SR + LIF+2i, and N2B27 + F/A culture conditions. Number of cells (n) is shown. Mann–Whitney test, two-sided; ns: P-value > 0,05, ****P-value < 0,0001. Source data for all graphs are available from the Source Data file and raw data from Figshare (see “Data availability” section).
Fig. 3
Fig. 3. Deletion analysis of endogenous cis-regulatory regions in the BAC RP24-78D24 region.
Confocal images showing GFP-MYC endogenous fluorescence and DAPI in control MycGFP/GFP cells cultured in SR + LIF (a), SR + LIF+2i (a´), and N2B27 + F/A (a´´). MycGFP/GFP ES cells with heterozygous deletion of sub-cluster A (b, b´´), homozygous deletion of sub-cluster B (c, c´´), homozygous deletion of sub-cluster C (d, d´´) and heterozygous deletion of Sub-cluster D (e, e´´) and WT Myc+/+ ES cells (f, f´´) cultured in the same 3 conditions. Scale bar = 30 microns. N = 3 clones for each genotype. g, g´´ Graphs showing the normalized median intensity of 3 clones for each genetic condition with 2 biological replicates for each clone. g´ 3 independent clones for all conditions except for the GFP condition in which 5 independent clones were used. The number of cells quantified per clone/replicate is available from the source data provided. GFP-MYC levels in SR + LIF and N2B27 + F/A conditions were analyzed by flow cytometry (g, g´´) and by confocal imaging in SR + LIF+2i condition (). Each dot represents the median of an individual clone/biological replicate and bars indicate the mean ± standard deviation of all clones/replicate in each condition. The number of cells quantified per clone/biological replicate is available from the Source Data in Figshare. One-way ANOVA with Dunnett’s correction; ns: P-value > 0,05; **P-value < 0,01, ***P-value < 0,001, ****P-value < 0,0001. h Violin plots with median and quartiles show GFP-MYC intensity in control MycGFP/GFP and sub-cluster C KO cell populations cultured in three conditions, as indicated. The number of cells analyzed is shown below the graphs. Mann–Whitney test, two-sided; ****P-value < 0,0001. Source data for all graphs are available from the Source Data file and raw data from Figshare (see “Data availability” section).
Fig. 4
Fig. 4. Identification of enhancers that regulate Myc in different states of pluripotency.
a Epigenetic landscapes of sub-clusters A and C in EpiSCs, EpiLCs, and ESCs-2i, as previously described. H3K27ac (orange); H3K4me1 (pink); P300 (dark green); FOXD3 (light green); OCT4-NANOG-SOX2 (blue). Data from the same sources as in Fig. 1. Putative cis-regulatory regions are represented as dark green boxes and numbered according to Fig. 1. Subdivisions of these regions into 5 putative smaller regulatory regions are represented as light green boxes: 2 (Sub-cluster A); 7-1; 7-2; 7-3; 7-4 (Sub-cluster C). Confocal images show GFP-MYC endogenous fluorescence in control MycGFP/GFP cells (b, b´´) and cells deleted for enhancer-2 (Enh2/) (c, c´´) and enhancer-7-3 (Enh-7-3/) (d, d´´) in SR + LIF (b, c, d), SR + LIF+2i (b´, c´, d´) and N2B27 + F/A (b´´, c´´, d´´). Scale bar = 30 microns. N = 3 clones per genotype. e, e´´, Dot plot with bar shows normalized median intensity of MycGFP/GFP clones. GFP-MYC endogenous levels were analyzed by FACs in SR (e) and N2B27 + F/A (e´´). In SR + LIF+2i condition (e´) GFP-MYC levels were analyzed in confocal images. Each dot represents the median of an individual clone/replicate and bars indicate the mean ± standard deviation of all clones/replicate in each condition. The number of cells quantified per clone/biological replicate is available from the source data in Figshare. e, e´´, independent clones per condition: 5 GFP, 5 Enh-2 KO, 3 Enh-2 KO, 3 WT each with two biological replicates. e´ independent clones per condition: 5 GFP, 5 Enh-2 KO, 3 Enh-2 KO, 3 WT. One-way ANOVA with Dunnett’s correction; ns: P-value > 0,05; *P-value < 0,05; ***P-value < 0,01; ****P-value < 0,0001. f Violin plots with median and quartiles show GFP-MYC endogenous signals in control MycGFP/GFP cells and in cells with homozygous deletions of enhancer-2 or enhancer-7-3 cultured in the three culture conditions, as indicated. The number of cells analyzed is shown below the graphs. Mann–Whitney test, two-sided; ****P-value < 0,0001. Source data for all graphs are available from the Source Data file and raw data from Figshare (see “Data availability” section).
Fig. 5
Fig. 5. Regulatory activity of naive versus formative pluripotency enhancers in vivo.
a Representation of enhancer-2 and enhancer-7-3 deletions in Myc GFP/GFP fertilized eggs by CRISPR-Cas9. Crosses were then set up to generate MycGFP/GFP with enhancer-2 (∆2) or enhancer-7-3 (∆7-3) deletions in the littermate embryos. Confocal images show immunostaining against GFP and DAPI in E3.5 embryos of genotypes MycGFP/GFP (b), KO for enhancer-2 (c), and KO for enhancer-7-3 (d). Scale bar = 30 microns. N = 8 MycGFP/GFP, 3 MycGFP/GFP∆2/+, 3 MycGFP/GFP∆2/∆2, 10 MycGFP/GFP∆7-3/+; 7 MycGFP/GFP∆7-3/∆7-3. Dot plots showing GFP-MYC expression levels in trophectoderm (TE) and epiblast cells (EPI) of MycGFP/GFP ∆2-heterozygous and ∆2-homozygous embryos (e) and in WT, MycGFP/GFP and MycGFP/GFP ∆7-3-heterozygous and ∆7-3-homozygous embryos (f). Each dot represents the mean intensity per cell measured in individual embryos. The number of cells analyzed by embryo/tissue is provided in Supplementary Fig. 8. For e and f, ordinary one-way ANOVA with Šídák’s multiple comparisons test and two-tailed P-values; ns: P-value > 0,05; *P-value = 0.0363; ***P-value = 0.0003; ****P-value < 0,0001. Confocal images show immunostaining against GFP and DAPI in post-implantation embryos of control MycGFP/GFP (g), complete KO for enhancer-2 (∆2) (i, j) or for enhancer-7-3 (∆7-3) (k, l). Scale bar = 30 microns. g´–l´, Heatmap representation of the anti-GFP channel of each embryo shown in gl. Scale bar = 30 microns. N = 3 MycGFP/GFP, 7 MycGFP/GFP∆2/+, 3 MycGFP/GFP∆2/∆2, 6 MycGFP/GFP∆7-3/+ and 5 MycGFP/GFP∆7-3/∆7-3 embryos. Dot plot shows GFP-MYC expression levels in extraembryonic ectoderm (EE) and epiblast cells (EPI) in Δ2 (m) and in WT, MycGFP/GFP, and Δ7-3 (n) embryos. Each dot represents the mean intensity per cell measured in individual embryos. The number of cells analyzed by embryo/tissue is provided in Supplementary Fig. 8. Ordinary one-way ANOVA with Šídák’s multiple comparisons test; ns: P-value > 0,05; **P-value = 0.0024 for EE and 0.0012 for EPI; ***P-value < 0.0006. Source data for all graphs are available from the Source Data file and raw data from Figshare (see “Data availability” section).
Fig. 6
Fig. 6. Transcription factors responsible for the regulatory activity of NPE and FPE.
a PLAC-seq data showing the interaction of the Myc promoter with H3K4me3-, H3K27Ac- and Pol2-positive regions in the whole Myc regulatory region (data from ref. downloaded from the 3D genome browser http://3dgenome.fsm.northwestern.edu/). b PLAC-seq data showing the interaction of the Myc promoter with H3K27Ac- and Pol2-positive regions and ChIPseq data for pluripotency factors in the regulatory region containing the putative NPE and FPE. Above the line that represents the genome, green color segments indicate H3K4me3 interactions with the Myc promoter, red color segments indicate interactions with H3K27-positive regions, and yellow color with both. Below, the ChIPseq meta-analysis is shown for ESCs and EpiSCs. ChIPseq data are from published studies (data retrieved from the ChIP Atlas web browser https://chip-atlas.org/peak_browser). The height of the bars is proportional to the number of independent studies that detect binding for each factor. c Enlargement of the regions in NPE and FPE that bind Pluripotency TFs. The numbers to the right of the bars indicate the number of independent studies that detected the interaction. d mapping of pluripotency TF DNA-binding motifs coinciding with the ChIPseq interactions and indication of the CRISPR deletions affecting these motifs. e Quantification of the percentage of activity that MycGFP/GFP ESCs carrying TF binding motif deletions show in comparison with control MycGFP/GFP ESCs in different culture conditions. See Fig. S10 for details on the biological replicates, number of cells analyzed, and exact P-values. Ordinary one-way ANOVA with Šídák’s multiple comparisons test; ns: P-value > 0,05; **P-value < 0,01; ***P-value < 0,001. Source data for all graphs are available from the Source Data file and raw data from Figshare (see “Data availability” section).
Fig. 7
Fig. 7. Competitive ability of ESCs defective for Myc cis-regulatory elements.
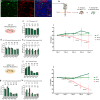
a Confocal images show co-cultures of MycGFP/GFP and MycGFP/GFP;ROSA26RTdTomato ES cells. Scale bar = 30 microns. b Scheme of the experimental procedure showing cells detached from the co-culture and analyzed by flow cytometry separating Tomato-positive (+) and -negative (–) populations during 5 consecutive days, with measurement of population abundance and GFP-MYC levels. Dot plots with bar show the mean intensity of GFP-MYC endogenous signals of the clones co-cultured in SR + LIF (ce) or N2B27 + F/A (fh) conditions and analyzed daily by flow cytometry for 5 days. e, f MycGFP/GFP;ROSA26RTdTomato and co-cultured MycGFP/GFP ESCs, d, g MycGFP/GFP;ROSA26RTdTomato ESCs and co-cultured MycGFP/GFP ESCs with homozygous deletion of the sub-cluster B (e, h), MycGFP/GFP;ROSA26RTdTomato ESCs and co-cultured MycGFP/GFP ESCs with homozygous deletion of the sub-cluster C. 3 independent clones with 2 biological replicates each were used for the analyses in (d, e, g, h) and two independent clones with biological replicates only on Day 5 in (c, f). The number of cells quantified per clone/biological replicate is available from the source data in Figshare. Mann–Whitney test, two-sided; ns: P-value > 0,05; P-values for significant differences: e Day 1-Day 4 = 0.0022; g Day 2 = 0.0022; h Day 1-Day 4 = 0.0022. The difference of GFP-MYC levels is shown as percentages significantly different comparisons. Evolution of the tomato- populations is represented as percentage of the whole culture in SR + LIF (i) or N2B27 + F/A (j) conditions for 5 days. In i, j, dots represent mean values and the error bars show the Standard Deviation. 2 different clones were used for WT and cluster B KO and 3 different clones were used for the cluster C KO. The number of cells quantified per clone/biological replicate is available from the source data in Figshare. Day 1 is normalized to 50% and the decrease of the sub-cluster C KO cells is represented as percentage each 24 h. 2-way ANOVA Dunnett’s multiple comparisons test; *P-value = 0,0112 for Day 4 and 0.0144 for Day 5; ****P-value < 0,0001. Non-significant comparisons are not indicated. Source data for all graphs are available from the Source Data file and raw data from Figshare (see “Data availability” section).

Similar articles

Cited by

  • Skin Development and Disease: A Molecular Perspective.
    Dermitzakis I, Chatzi D, Kyriakoudi SA, Evangelidis N, Vakirlis E, Meditskou S, Theotokis P, Manthou ME. Dermitzakis I, et al. Curr Issues Mol Biol. 2024 Jul 30;46(8):8239-8267. doi: 10.3390/cimb46080487. Curr Issues Mol Biol. 2024. PMID: 39194704 Free PMC article. Review.

References

    1. Takahashi K, Yamanaka S. Induction of pluripotent stem cells from mouse embryonic and adult fibroblast cultures by defined factors. Cell. 2006;126:663–676. doi: 10.1016/j.cell.2006.07.024. - DOI - PubMed
    1. Nichols, J. & Smith, A. Naive and primed pluripotent states. Cell Stem Cell10.1016/j.stem.2009.05.015 (2009). - PubMed
    1. Hackett, J. A. & Azim Surani, M. Regulatory principles of pluripotency: from the ground state up. Cell Stem Cell10.1016/j.stem.2014.09.015 (2014). - PubMed
    1. Sperber, H. et al. The metabolome regulates the epigenetic landscape during naive-to-primed human embryonic stem cell transition. Nat. Cell Biol. 10.1038/ncb3264 (2015). - PMC - PubMed
    1. Kinoshita M, et al. Capture of mouse and human stem cells with features of formative pluripotency. Cell Stem Cell. 2021;28:453–471.e8. doi: 10.1016/j.stem.2020.11.005. - DOI - PMC - PubMed

Publication types

Substances