. 2024 May 10;19(5):e0302701.
doi: 10.1371/journal.pone.0302701. eCollection 2024.

Sodium arsenite and arsenic trioxide differently affect the oxidative stress of lymphoblastoid cells: An intricate crosstalk between mitochondria, autophagy and cell death

Affiliations

Sodium arsenite and arsenic trioxide differently affect the oxidative stress of lymphoblastoid cells: An intricate crosstalk between mitochondria, autophagy and cell death

Nathan Earl Rainey et al. PLoS One. .

Abstract

Although the toxicity of arsenic depends on its chemical forms, few studies have taken into account the ambiguous phenomenon that sodium arsenite (NaAsO2) acts as a potent carcinogen while arsenic trioxide (ATO, As2O3) serves as an effective therapeutic agent in lymphoma, suggesting that NaAsO2 and As2O3 may act via paradoxical ways to either promote or inhibit cancer pathogenesis. Here, we compared the cellular response of the two arsenical compounds, NaAsO2 and As2O3, on the Burkitt lymphoma cell model, the Epstein Barr Virus (EBV)-positive P3HR1 cells. Using flow cytometry and biochemistry analyses, we showed that a NaAsO2 treatment induces P3HR1 cell death, combined with drastic drops in ΔΨm, NAD(P)H and ATP levels. In contrast, As2O3-treated cells resist to cell death, with a moderate reduction of ΔΨm, NAD(P)H and ATP. While both compounds block cells in G2/M and affect their protein carbonylation and lipid peroxidation, As2O3 induces a milder increase in superoxide anions and H2O2 than NaAsO2, associated to a milder inhibition of antioxidant defenses. By electron microscopy, RT-qPCR and image cytometry analyses, we showed that As2O3-treated cells display an overall autophagic response, combined with mitophagy and an unfolded protein response, characteristics that were not observed following a NaAsO2 treatment. As previous works showed that As2O3 reactivates EBV in P3HR1 cells, we treated the EBV- Ramos-1 cells and showed that autophagy was not induced in these EBV- cells upon As2O3 treatment suggesting that the boost of autophagy observed in As2O3-treated P3HR1 cells could be due to the presence of EBV in these cells. Overall, our results suggest that As2O3 is an autophagic inducer which action is enhanced when EBV is present in the cells, in contrast to NaAsO2, which induces cell death. That's why As2O3 is combined with other chemicals, as all-trans retinoic acid, to better target cancer cells in therapeutic treatments.


Conflict of interest statement

The authors have declared that no competing interests exist.

Figures
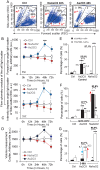
Fig 1
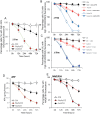
Fig 1. As2O3- and NaAsO2-treated P3HR1+ (EBV+) cells undergo distinct cell death processes.
A–Proof of concept: Cellular swelling associated with the treatment of P3HR1+ cells by 5 μM As2O3 or NaAsO2 as evaluated by flow cytometric light scattering analysis using forward light scatter (FSC) and 90° angle light scatter (side scatter, SSC) of the treated P3HR1+ cells in complete medium alone (Control) or treated for 48 h with 5 μM As2O3 or NaAsO2. Three different populations are defined regarding FSC and SSC: 1—Viable cells that are PI-negative, YO-PRO-1-negative—2—Intermediate cells that are PI-negative but permeable to YO-PRO-1 and—3—Dead cells are PI-positive and YO-PRO-1-positive. B and C—P3HR1+ cells were cultivated for 12, 24, 48 or 72 h in complete medium alone (Control) or containing 5 μM As2O3 or NaAsO2 and further analyzed by flow cytometry for their light scattering properties at 488 nm excitation. In B—Measurement of their forward low angle light scatter (FSC) and in C—Measurement of their scatter at ninety degrees (“side-scatter”, SSC). The experiments have been repeated with n = 10. D—P3HR1+ cells were cultivated for 12, 24, 48 or 72 h in complete medium alone (Control) or containing 5 μM As2O3 or NaAsO2. The quantification of mean cell volumes was performed on a Coulter Counter and Analyzer, as described in Materials and Methods. All the statistics have been taken from at least n = 8 separated experiments. For B, C and D. Asterisks indicate statistically significant variation compared to the corresponding population in control cells, calculated using Student’s t-test (*P < 0.01, **P < 0.001). E—P3HR1+ cells were treated with 5 μM of As2O3 or NaAsO2 for 72 h and stained with YOPRO-1/PI to determine their viability, that is the sum of YOPRO-1+/PI-, i.e., apoptotic cells + YOPRO-1+/PI+, necrotic cells (or “secondary necrosis”). All the statistics have been taken from at least n = 8 separated experiments. F and G—P3HR1+ cells were treated with 5 μM of As2O3 or NaAsO2 for 72h in presence of either the pan-caspase inhibitor QVD-OPH (Quinoline-Val-Asp-Difluorophenoxymethyl Ketone, 10 μM) that is blocking caspase-3, -7, -8, -9, -10 and -12 or the autophagy inhibitor 3-methyladenine (3-MA, 5 mM). The arrows are in red for necrotic changes (YOPRO-1+/PI+) and in black when it is concerning changes in apoptosis (YOPRO-1+/PI-). Asterisks indicate statistically significant variation compared to the corresponding population in control cells, calculated using Student’s t-test (*P < 0.01, **P < 0.001). All the statistics have been taken from at least n = 8 separated experiments.
Fig 2
Fig 2. Cellular activities and cell cycle analysis affected by the As2O3 or NaAsO2 treatment.
A–Malondialdehyde production at 0 h and 48 h for P3HR1+ and Ramos-1 cells treated with either 5 μM As2O3 or 5 μM NaAsO2 (n = 7). (B) Protein carbonylation in P3HR1+ and Ramos-1 cells treated with 5 μM As2O3 or 5 μM NaAsO2 (n = 8). (C) Lactate production induced by 48-h treatment with 5 μM As2O3 or 5 μM NaAsO2. Data are expressed as nmol/mg protein (n = 8). (D, E)—P3HR1+ cells were treated with 5 μM NaAsO2 or As2O3 for different times (0 to 72 h). Cell cycle distribution was detected by flow cytometry using PI staining to allow the exclusion of dead cells and normalization (since at 72 h too many cells are already dead). For each sample, 10,000 cells were collected and analyzed. Data were obtained from four independent experiments. The data represent the percentage of NaAsO2-treated cells or As2O3-treated cells in each phase of the cell cycle.
Fig 3
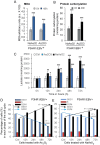
Fig 3. Effects of NaAsO2 and As2O3 on the mitochondrial bioenergetic properties of the P3HR1+ (EBV+) cells.
A—Differential effects of 5 μM NaAsO2 and As2O3 on the mitochondrial membrane potential as measured by DiOC6(3) fluorescence measurements. B and C—Modulation of the effects of 5 μM NaAsO2 and As2O3 on the mitochondrial membrane potential when challenged by 10 μM pan-caspase inhibitor QVD-OPH (B) or by 5 μM autophagy inhibitor 3-methyladenine (C). D–Measurement of ATP level when the P3HR1 (EBV+) cells are treated with NaAsO2 and As2O3.
Fig 4
Fig 4. Effects of NaAsO2 and As2O3 on the level of ROS produced and possible down-regulation of the antioxidant defense [(SOD and GSH of the P3HR1 (EBV+) cell]).
Cells were treated with 5 μM NaAsO2 or As2O3 for 0–72 h. The parameters of oxidative stress, including ROS, GSH and SOD, were measured. A -Intracellular ROS level was determined by using a fluorescent probe (DCFH-DA), and the fluorescent intensity of DCF was evaluated with an excitation wavelength at 488 nm and an emission wavelength of 530 ± 30 nm. PI staining was done concomitantly to ensure the exclusion of dead cells together with the light scattering properties. B–The superoxide anions that originate from mitochondrial respiratory chain dysfunction are measured with the MitoSOX red fluorescent probe. TO-PRO-3 iodide staining was performed concomitantly to ensure the exclusion of dead cells together with the light scattering properties. C—SOD activity was tested using a commercial SOD kit and normalized according to the protein concentration. D—The content of GSH was detected by flow cytometry analysis by using monobromobimane (mBrB). Data are given as the mean fluorescent value (F mean) and the ± SD is the standard deviation given along the curve (data from the flow cytometry data and the FlowJo software are the means of 6 independent experiments). Moreover, the background of the mBrB staining was deduced from the measurement with GSH depletion as indicated in the materials and methods. For (A) and (B), the data were taken from six independent experiments and expressed as mean ± S.D. One-way ANOVA analysis including the least significant difference (LSD-t test) multiple comparisons was performed to evaluate the statistically significant difference.
Fig 5
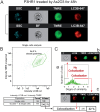
Fig 5. Flow cytometry analysis of acridine orange staining associated with LC3B detection.
A—Image cytometry of the acidic compartment and LC3B staining of the autophagosomes of P3HR1+ cells treated with 5 μM As2O3 for 48 h. The measurements were done with an Amnis ImageStream100 (Amnis, Merck Millipore) imaging flow cytometer. The images presented are bright field (gray) and the red channel for the LysoTracker red fluorescence, the green channel for the LC3B antibody green fluorescence and the colocalization of green and red. B—Biparametric flow image cytometry analysis of EGFP-LC3 versus LysoTracker Deep Red of P3HR1+ cells treated with 5 μM As2O3 for 48 h as a proof of concept. C, D and E—Flow cytometric analysis of AO staining of PH3R-1 cells as described in materials and methods when treated or not (C—control) with either 5 μM arsenic trioxide (D) or 5 μM sodium arsenite (E) for 48 h. We obtained green fluorescence when the AO molecules were free or bound to DNA, whereas AO red fluorescence is emitted from an acidic environment where the molecules aggregate and form stacks (Stokes shift). The histograms of green and red fluorescence show the enhancement of the acidic compartment (red fluorescence), but also the death of cells, which usually lose their acidic vesicles and have a compacted DNA resulting in less green fluorescence (green fluorescence). F, G and H–Histogram presentation of the AO staining of control cells, 5 μM arsenic trioxide or 5 μM sodium arsenite (F) for different times. The same treatment in the presence of the pan-caspase inhibitor QVD-OPH (G) or the autophagy inhibitor 3-methyladenine (3-MA) (H).
Fig 6
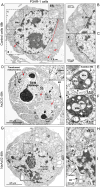
Fig 6. Electron microscopy of P3HR1 cells treated with either 5 μM NaAsO2 or As2O3 for 72 h.
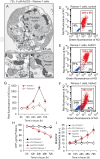
A—P3HR1 cells, control and highlighting of the mitochondrial compartment. With detailed mitochondria situated in the enlarged part of the cytoplasm designated as B and C. D—P3HR1 cells treated with sodium arsenite (NaAsO2 5 μM, 72 h). The early phase of DNA condensation due to cell death is visible; the nuclei are undergoing pyknosis. E—Enlargement of the mitochondria in the cytoplasm that appear translucent and have lost their cristae membrane. Smaller mitochondria, resulting from mitochondrial fission, are also present. F—Enlargement of a portion of cytoplasm and nuclei allows the detection of a large lumen at the nuclear membrane that is characteristic of the cell death process. It can also be seen that the ER is slightly swollen and numerous vacuoles are present. G—P3HR1 cells treated with arsenic trioxide (As2O3 5 μM, 72 h). The cells are clearly blocked in the cell cycle in G2/M (see Fig 4). The nuclei present marked condensation of the DNA. The mitochondria are numerous, small, translucent, without cristae membranes and widely condensed close to the nuclei. In H and I, autophagosomes. H—The enlarged picture shows an autophagosome with a well-defined isolation membrane (a double membrane that surrounds the content). Mitochondria are enclosed in the autophagosome. H—Enlargement of a portion of cytoplasm and nuclei allows the detection of a large lumen at the nuclear membrane that is characteristic of the cell death process. The ER is slightly swollen and numerous vacuoles are present. I—The enlarged picture shows an autophagosome with a well-defined isolation membrane (a double membrane that surrounds the content). Mitochondria are enclosed in the autophagosome. Abbreviations used in the pictures: Mb, Cristae membrane; ER, endoplasmic reticulum; Isolation Mb; Isolation Membrane, Mito., mitochondria; V, vacuole. The sizes in μm of the diverse intracellular organelles are indicated by the bars (__, in black).
Fig 7
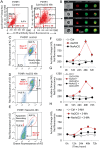
Fig 7. Image cytometry (Amnis) of the double staining of LC3B cells treated with 5 mM ATO for 48h stained with TMRE and LC3B-647.
A—Example of single cell analysis for two cells (2) obtained after 48h incubation with 5 mM ATO and double staining by 40 nm TMRE (orange/red fluorescence) and LC3B-647 (far red fluorescence) taken in false green fluorescence. B—Biparametric histogram of Green (false color) of TMRE orange/red and, LC3B-647 fluorescence. A double stained population is highlighted representing 94,2% percent (744) of the whole population analysed (789 cells at the total). C—Similarity analysis for correlation between TMRE fluorescence and LC3B-647 fluorescence. The analysis of the colocalization of the TMRE and LC3B-647 has been performed by using the Similarity Score included in IDEAS 6.0 software™ (Amnis). This score, a log-transformed Pearson’s correlation coefficient between the pixels of two image pairs, provides a measure of the degree of co-localization by measuring the pixel intensity correlation between the TMRE and LC3B-647 images. Analysis performed on the 744 cells that exhibit a double staining as seen in (B). (a) A histogram giving the Gaussian repartition of the cells in term of similarity indicating or not the perfect colocalization of the two probes. (b) Cells with no or to little colocalization (c) Cells with almost full colocalization that have malfunctioning mitochondria enclosed in autophagosomes.
Fig 8
Fig 8. Electron microscopy of Ramos-1 cells and detailed information about their autophagic and cell death status associated with bioenergetic characteristics.
A, B, C Electron microscopic images of Ramos-1 (R-1, EBV-) cells treated with either 5 μM NaAsO2 or As2O3 for 72 h. B and C are enlargements of A in order to focus on mitochondria in B and on the picnotic appearance of the nuclei (with condensed DNA) in C. D-G, Fine analysis of acridine orange staining of the cells in different conditions: A detailed flow cytometry analysis is given for control cell staining (D), cells treated 48 h with 5 μM As2O3 (E) or with 5 μM NaAsO2 (F). G—Comparison between P3HR1 (in red circles) and Ramos-1 (empty circles) cells treated with 5 μM As2O3 for different times. H and I, bioenergetic information about Ramos-1 cells treated with As2O3 for different times.
Fig 9
Fig 9. Schematic interpretation.

Similar articles

References

    1. Hughes MF. Arsenic toxicity and potential mechanisms of action. Toxicol Lett. 2002;133(1):1–16. doi: 10.1016/s0378-4274(02)00084-x - DOI - PubMed
    1. Hughes MF, Beck BD, Chen Y, Lewis AS, Thomas DJ. Arsenic exposure and toxicology: a historical perspective. Toxicol Sci. 2011;123(2):305–32. doi: 10.1093/toxsci/kfr184 - DOI - PMC - PubMed
    1. Miller WH Jr, Schipper HM, Lee JS, Singer J, Waxman S. Mechanisms of action of arsenic trioxide. Cancer Res. 2002;62(14):3893–903. - PubMed
    1. Yang HC, Fu HL, Lin YF, Rosen BP. Pathways of arsenic uptake and efflux. Curr Top Membr. 2012;69:325–58. doi: 10.1016/B978-0-12-394390-3.00012-4 - DOI - PMC - PubMed
    1. Rosenberg H, Gerdes RG, Chegwidden K. Two systems for the uptake of phosphate in Escherichia coli. J Bacteriol. 1977;131(2):505–11. doi: 10.1128/jb.131.2.505-511.1977 - DOI - PMC - PubMed

Publication types

MeSH terms

Grants and funding

The INSERM and CNRS are the employers of PXP (CNRS) and Anne-Sophie Armand (INSERM, Université Paris-Descartes. This work has been entirely funded by C.N.R.S. and I.N.S.E.R.M common support. The funders had no role in study design, data collection and analysis, decision to publish, or preparation of the manuscript.